Game Theory & Prices/Options?I posted this before a long time, how crowd in markets always think of the same price.
Here I dont know how this works (but from market behaviors i can assume...), how options influence market? ie NASDAQ:PLTR breaking above the 100$, with enough strength... it has to clear the 150$ and next target is 200$. Because market makers are forced to buy the stock, when unlikely before this period anyone would buy 200$ options. Just a theory.
Prices

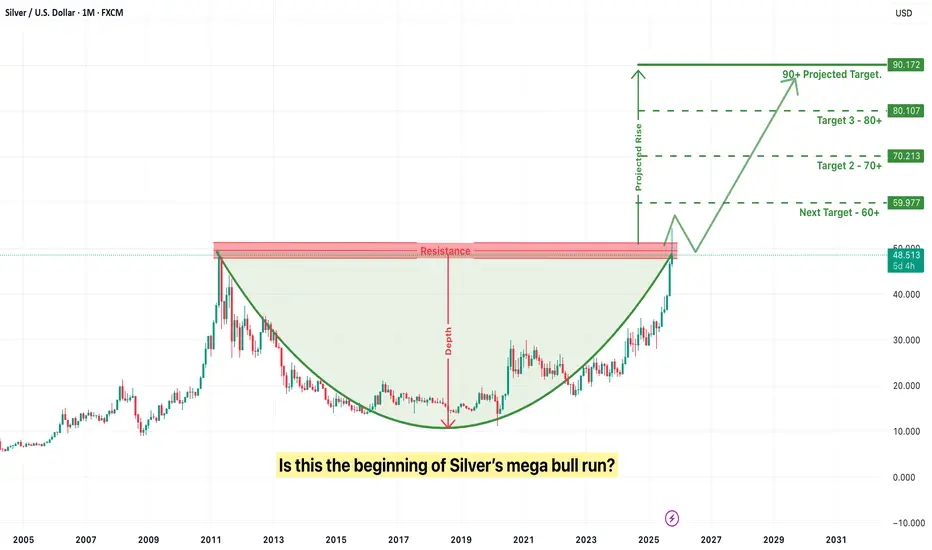
Is this the beginning of Silver’s mega bull run?For years silver has been seen as gold’s lesser companion — always important, but never truly leading. However, the world is now entering a new economic and technological era where silver is quietly transitioning from a secondary asset into a strategic metal of the future. What makes silver unique is that it is both an industrial metal and a monetary asset at the same time. Gold is used primarily for wealth protection, but silver has dual demand — it rises when technology adoption accelerates and it rises again when currencies weaken and investors seek a safe store of value. This rare combination places silver in a category of its own.
The most powerful driver behind silver’s future potential is the global energy and technology transformation. The world is rapidly shifting toward electric mobility, renewable power, high-speed communication networks and AI-scale computing. Every one of these megatrends directly increases silver consumption. Electric vehicles require significantly more silver than traditional cars because of their circuitry and conductivity needs. Solar panels have already become the single-largest industrial consumer of silver worldwide, and demand is projected to rise sharply due to green energy mandates and government policies. In the coming decade, silver will also be crucial to 5G infrastructure, robotics, space technology and medical-grade electronics. Simply put, modern technology cannot scale without silver.
While demand is rising rapidly, supply is structurally constrained. Most silver does not come from dedicated silver mines but as a by-product of mining other metals such as zinc, lead and copper. This means supply cannot simply increase when silver prices rise. If industrial base-metals mining slows, silver production automatically contracts. At the same time investment demand is rising, which creates a long-term deficit. This mismatch between rising demand and limited supply is exactly what leads to a major asset re-rating over time.
Another major factor supporting silver is the global macroeconomic cycle. Currencies across the world are losing value due to continuous money printing, rising debt and inflationary pressure. Investors are increasingly looking for hard assets that preserve purchasing power. Gold is traditionally the first choice, but it is already well accumulated and priced. Silver, being more affordable and under-owned, becomes the “accessible hedge” for the masses. Each time inflationary fears rise or fiat confidence falls, silver sees renewed investment flow.
Technically as well, silver is at a critical long-term juncture. The price structure is completing a multi-decade cup-and-handle pattern, which is one of the strongest bullish technical formations in commodity markets. Such large time-frame technical setups rarely appear, and when they do, their breakouts typically fuel multi-year trends rather than short rallies. A sustained breakout in silver has the potential to trigger a supercycle where price appreciation becomes exponential rather than linear.
However, while the long-term potential is extremely strong, investors should be aware of certain risks. Silver is far more volatile than gold and is known for sharp price swings in short timeframes. Breakouts can also produce temporary fake moves, trapping impatient investors who enter at the top and exit at the first correction. Because silver is tied to industrial demand, a short-term slowdown in the global economy can temporarily affect prices even when the long-term thesis remains intact. Another caution is the difference between physical silver and paper silver. Physical markets reflect real-world scarcity, while paper silver markets (ETFs, futures) can sometimes be suppressed by large institutional trading, creating short-term price distortions that do not reflect underlying fundamentals.
The key to winning with silver is adopting a patient, long-term perspective instead of a speculative trading mindset. Accumulation through systematic or staggered buying reduces timing risk and prevents emotional decision-making. A blend of physical holding for long-term security and digital exposure for liquidity creates the most efficient structure. Silver has historically rewarded patience and conviction while punishing emotional exits.
In conclusion, silver stands at the intersection of three powerful global shifts — technological transformation, monetary instability and resource scarcity. It is no longer just a precious metal; it is becoming a strategic asset for the coming decade. Gold protects capital, but silver has the potential to multiply it. This is why many economists, historians and market analysts believe silver is poised to become one of the most powerful wealth-building assets of the future.
Gold Price Analysis August 29✨ Gold Analysis Today
In the Asian session this morning, the Gold price reached 3320 and there was a slight profit-taking pressure from investors. Recent market developments show a familiar repeating scenario: Asia - Europe reduced and adjusted, while the US is often the place to trigger the rebound wave.
With the current picture, the intraday trading strategy still prioritizes buying when adjusting instead of chasing prices. Today's target is expected to be around 3328. Note, if the price breaks out, absolutely do not rush to sell, unless there is clear confirmation from the H4 candle showing that the downward pressure has returned.
🔑 Trading strategy:
Only wait for BUY at support zones when there is a signal confirming buying pressure.
Support zones to pay attention to: 3402 - 3390 - 3375.

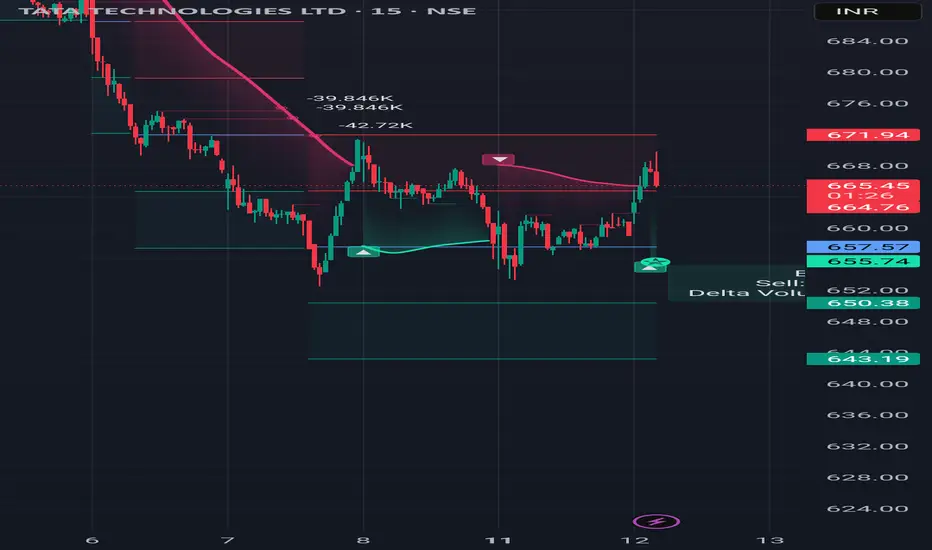
Short term Technical Idea TATATECH📢 PJV FINANCIAL – 1-2 DAYS TECHNICAL CALL 📢
🔷 SCRIPT: TATATECH
🔷 Action: BUY above ₹667.40
🔷 Stop Loss: ₹656 (📉 -1.71%)
🔷 Target: ₹688 (📈 +3.08%)
🔷 Risk–Reward Ratio: 1 : 1.80 ✅
📌 Short-term momentum trade idea – strictly follow SL.
🚀 #PJVSignals | 💼 #TechnicalCall
EURUSD Trading Price Channel, SELL Strategy✏️ OANDA:EURUSD H4 Timeframe EURUSD is trading in a bearish channel. This bearish channel may extend to the important support at 1.145. A break of this important support will form a Downtrend. Further upside recovery will remain limited by the channel, with the notable upper boundary at 1.16800.
📉 Key Levels
Sell trigger: rejection from 1.168 with bearish confirmation
Sell DCA: Break 1.155
Target: 1.145
Leave your comments on the idea. I am happy to read your views.

XAUUSD Weekly Trade Setup(14-18th July 2025) - Bullish StrategyIn the ever-volatile world of commodities, Gold (XAUUSD) has yet again presented a promising technical setup. For traders looking to capitalize on price action and structure-based strategies, the upcoming week (14th to 18th July 2025) offers a clean breakout and retest opportunity backed by a strong risk/reward ratio.
Let’s break down the trade plan in detail.
1. Overview of the Current Market Structure
As shown in the 4-hour chart, XAUUSD is approaching a key horizontal resistance zone around 3360–3370. Historically, this area has acted as a rejection point for buyers. However, the recent bullish momentum, supported by price trading above the 200 EMA, suggests a potential breakout.
This forms the basis of a Breakout-Retest-Continuation strategy – one of the most reliable setups in price action trading.
2. The Trade Plan
Here’s the structured plan for this setup:
🔵 Step 1: Wait for the Breakout
Price must break above the resistance zone (3360–3370) with a strong bullish candle.
Avoid chasing the breakout; instead, let the market confirm its direction.
🟠 Step 2: Look for the Retest
After the breakout, wait for the price to pull back to the broken resistance, now acting as support.
Confirm this retest with a reversal candlestick pattern (e.g., bullish engulfing or hammer) on the 1H or 4H timeframe.
🔴 Step 3: Entry and Stop Loss
Enter the trade after the confirmation candle closes.
Place a stop loss below the swing low of the retest zone.
This protects the trade in case of a false breakout.
🟢 Step 4: Set Your Target
The profit booking zone lies around the 3440–3450 region.
This setup offers a Risk/Reward Ratio of 1:4, targeting 1:2, 1:3, and potentially 1:4 if momentum continues.
3. Why This Setup Makes Sense
EMA Confirmation: Price is trading above the 200 EMA, showing bullish bias.
Clean Price Action: Well-defined structure makes it easy to identify breakout/retest levels.
Strong Risk Management: The stop is tight and logical, while the upside potential is considerable.
Psychological Support Zone: 3360–3370 has repeatedly acted as a key decision level.
4. Trade Management Tips
Trail your stop loss once 1:2 R:R is achieved.
Consider partial profit booking at 1:2 or 1:3 to lock in gains and reduce risk.
Be patient – the key to this strategy is waiting for the retest confirmation.
5. Final Thoughts
Trading XAUUSD can be both rewarding and risky. This weekly setup gives you a disciplined approach to enter the market at a high-probability point with excellent reward potential. Whether you’re a swing trader or an intraday scalper on lower timeframes, this strategy adapts well with proper confirmation.
Stay tuned for live updates, and as always – plan your trade, and trade your plan.
Happy Trading!
=================================================================
Disclosure: I am part of Trade Nation's Influencer program and receive a monthly fee for using their TradingView charts in my analysis.
=================================================================

LTTS Weekly Trade Setup(14th-18th July 2025) – Parallel ChannelThis week, L&T Technology Services (LTTS) is showing a potential breakout opportunity that requires patience and precision. As the stock approaches a key resistance zone near ₹4445, traders should resist the urge to jump in early and instead wait for a breakout and confirmed re-test before entering any long positions.
Let’s break this down.
1. Why the Breakout is Important
- LTTS has been consolidating within a parallel channel between ₹4280 (support) and ₹4445 (resistance). Breakouts from such structures often trigger significant moves — but only when confirmed.
- A false breakout can trap early traders. Hence, waiting for the price to break above ₹4445 and then re-test this level is critical.
2. The Strategy – Wait and React
📌 Step 1: Watch for Breakout
Monitor price action as it approaches and breaches the ₹4445 resistance.
Look for strong bullish candles with volume to validate the breakout.
📌 Step 2: Wait for Re-test
After breakout, price may pull back to test the previous resistance.
This re-test acts as a confirmation that bulls are defending the breakout.
📌 Step 3: Look for Confirmation
Enter only when you see a bullish candlestick pattern (like a bullish engulfing or hammer) near the re-test level on 15-min or 1-hour charts.
🛡️ Stop Loss:
Place your stop below the swing low of the re-test.
This protects you if the breakout fails.
🎯 Target:
Profit booking zone is near ₹4580–₹4600.
Risk/reward ratio: 1:2, 1:3, 1:4+
3. Why Re-test Entries are Powerful
They allow low-risk entries with a tight stop loss.
You avoid chasing price and reduce emotional trading.
Confirmation helps you filter out false breakouts.
4. Final Words
In trading, discipline often beats speed. This LTTS setup is all about timing and structure.
🔔 Watch for the breakout.
🧘♂️ Wait for the re-test.
🎯 Enter only with confirmation.
If executed properly, this trade offers a clean, high R:R opportunity with a clearly defined setup.

Gold Price Analysis July 10🔹 XAUUSD Analysis – D1
Yesterday's D1 candle showed a strong recovery, closing above 3313, thereby significantly weakening the previous downtrend structure. Currently, the price is reacting very strongly at the trendline around 3284. Buying pressure is clearly appearing, pushing gold back to trading in a wide range.
In the short term, the 3328 area will play an important resistance role. If the price cannot break this area, the possibility of a correction down to the Gap price area this morning is quite high. The peak-bottom trading method is still giving suitable signals in the current market context.
🔹 Important zones:
Support: 3312 – 3295 – 3279
Resistance: 3328 – 3339 – 3349 – 3363
💡 Strategy:
Confirm the trading signal when the price clearly rejects the resistance zones to ensure the highest winning rate.

Gold Trading Strategy February 7✏️As expected from the analysis, after the D1 candle showed buying pressure again, the price continued its uptrend yesterday and reached 3357.
Currently, the price is consolidating within a relatively wide sideways range, extending from 3328 to 3344.
A trend-following trading strategy will be set up when the price breaks out of this range.
The BUY signal is expected to bring good profits if the price retests the support.
The SELL signal at resistance is considered to look for rebound points in an uptrend.
📈 Key Levels
Breakout Range: 3344-3328
Support: 3310-3298
Resistance: 3368-3386
📊 Recommended Trade Setups
BUY: 3310-3308 | SL: 3305
SELL: 3368-3370 | SL: 3373

USD/JPY Consolidation Triangle – Breakout WatchThe USD/JPY pair is currently trading inside a well-formed symmetrical triangle pattern on the daily chart. This structure typically forms when the market is in a phase of consolidation, with neither buyers nor sellers able to break the range. Price is compressing between a horizontal resistance zone (~146.50) and a rising support line (~143.50), indicating that a breakout in either direction may be imminent.
This triangle has formed after a sharp downtrend, followed by a broad base formation. Such setups often precede a decisive move, especially if accompanied by volume.
🔼 Upside Breakout Scenario
If price breaks and closes above the resistance zone (above 146.50–147.00) with bullish confirmation, we can expect momentum to shift in favor of buyers. A confirmed breakout would open the path toward 150.00+, possibly even retesting the highs of 2024 near 152.00. This would be seen as a bullish reversal after a prolonged downtrend.
🔽 Downside Breakdown Scenario
Alternatively, if price fails to hold the rising trendline and breaks below the 143.00–142.50 support zone, it may confirm a bearish breakdown. This would suggest a continuation of the earlier downtrend with fresh bearish momentum targeting 140.00 and lower levels.
🧭 Trade Strategy Consideration
Bullish Plan: Buy breakout above 147.00 with SL below 145.50 and TP near 150.50–152.00
Bearish Plan: Sell breakdown below 142.50 with SL above 144.00 and TP near 140.00–138.00
Neutral Bias: Wait for breakout confirmation; no trade inside the triangle
This is a tight volatility setup where breakout traders should stay alert. The longer the consolidation, the stronger the breakout move tends to be.
=================================================================
Disclosure: I am part of Trade Nation's Influencer program and receive a monthly fee for using their TradingView charts in my analysis.
=================================================================

AUD/USD Parallel Channel Setup – Breakout or Pullback in PlayThe AUD/USD pair is trading within a clearly defined ascending parallel channel, with consistent rejections from both the upper resistance zone near 0.6550–0.6560 and repeated bounces from the rising support area near 0.6390–0.6400. This structured price movement indicates strong channel discipline, which traders can use for high-probability breakouts or reversal plays.
The current price action is approaching the upper boundary of the resistance, and a decisive breakout here could lead to a bullish rally toward the projected target.
📈 Bullish Breakout Scenario
If the price breaks and closes above the resistance zone (above 0.6560), it will confirm a bullish breakout from the channel. Based on the height of the channel, the projected breakout target is 0.67365, which is derived by measuring the vertical distance between support and resistance and projecting it upward from the breakout point. This could signal a major trend continuation in favor of the bulls.
📉 Bearish Rejection Scenario
If the price once again gets rejected at the resistance zone, a corrective move is expected toward the support area around 0.6400. The structure suggests that unless a breakout occurs, price may continue to oscillate within the rising channel. The next bearish leg could form a lower high and test the trendline support again.
🧭 Trading Strategy Outlook
Buy Breakout Strategy:
Entry: Above 0.6560
SL: Below breakout candle
TP: 0.67365 (projected target)
Sell Rejection Strategy:
Entry: Near 0.6550 resistance
SL: Above 0.6570
TP: 0.6400 support zone
This is a neutral-to-bullish setup, with a potential for continuation if the resistance breaks with strength. Traders should wait for confirmation before entering.
=================================================================
Disclosure: I am part of Trade Nation's Influencer program and receive a monthly fee for using their TradingView charts in my analysis.
=================================================================

#NIFTY Intraday Support and Resistance Levels - 26/06/2025Nifty is set to open slightly gap up today near the 25,250 mark, signaling a continuation of the ongoing consolidation phase. The market has been hovering around this zone for the past couple of sessions, making it a key inflection point. A sustained move above 25,300 can trigger bullish momentum, leading to targets of 25,350, 25,400, and 25,450+. This level also coincides with previous intraday highs, making it a potential breakout zone for aggressive buyers.
On the flip side, if Nifty faces rejection from this resistance zone and slips below the 25,250–25,200 levels, a downside move could emerge. In that case, short positions can be considered with immediate support levels at 25,150, 25,100, and 25,050. The opening hour will be crucial—traders should monitor for either a breakout above 25,300 or a breakdown below 25,200 to determine intraday direction. Volatility may increase due to expiry, so a wait-and-watch approach with tight stop-losses is advisable.

AVAX/USDTFor the Ava currency, I found the weekly time frame more convenient for analysis. The story is that the channel has ended and we are currently in a trading range and are moving towards the bottom of the trading range. Do you know how we should trade in trading ranges?

US Unemployment Rising: How Is This NOT a Recession?The U.S. unemployment numbers are steadily climbing, as indicated by recent Bureau of Labor Statistics data. Typically, significant rises in unemployment correlate directly with recessions, which are shaded gray in historical data charts.
Currently, unemployment has reached over 7 million, significantly higher than recent lows. Historically, every similar increase has coincided with or preceded an official recession declaration. Yet, mainstream economic narratives have avoided labeling this a recession.
What does this data tell us, and is the market accurately pricing in the risk? Are we already in a recession, or is this time different?
Share your thoughts below. Let's discuss the disconnect between the unemployment reality and official recession narratives.

GOLD...LONGPYTH:XAUUSD
Market structure suggests is preparing for its next move.
The AND level will likely play a critical role in the upcoming direction.
** If structure breaks and confirms the shift, a new bias might form after the retest. **

Berger Paints at Make-or-Break Point:Descending Triangle PatternBerger Paints is currently testing the upper boundary of a long-term Descending Triangle on the weekly chart — a pattern known for sharp breakouts or breakdowns.
📊 Resistance Zone: 600 – A breakout above this level could trigger a powerful upside rally towards 825+, supported by the pattern's height projection.
🔻 Support Level: 543 – A breakdown below this level may lead to a sharp fall towards 400 levels.
⚠️ Bearish Pin Bar Candle at resistance signals caution; confirmation is key before entering any trade.
📌 Watch closely for a decisive move – this zone is critical for trend reversal or continuation.
This setup offers a high-reward opportunity for positional traders, with clear entry and exit zones. Manage your risk wisely and follow with volume confirmation.

Gold Price Analysis April 21Gold price is currently at ATH and trading strategy is difficult. Gold is facing the round port level of 3400 and the lower boundary is the Break out zone around 3386. Any pullback of gold is considered as an opportunity to buy 3420 can be considered as today's boundary.

#NIFTY Intraday Support and Resistance Levels - 16/04/2025Today will be slightly gap up opening expected in nifty. After opening if nifty sustain above 23300 level then possible upside rally upto 23500 in opening session. This rally can be expected for further 200+ points in case nifty gives breakout and starts trading above 23550 level. Any major downside only expected below 23250 level.

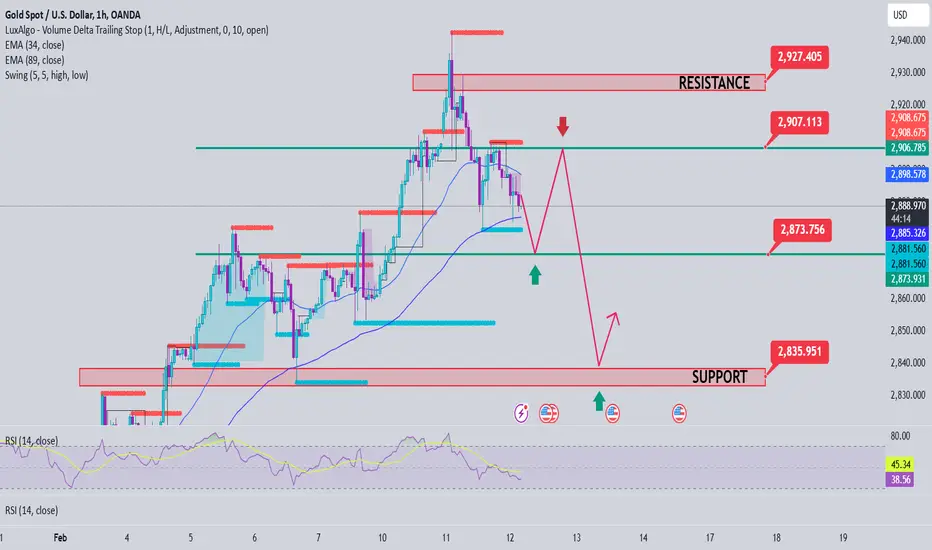
Gold Price Analysis March 4⭐️Fundamental Analysis
The market is concerned about the risk of a global tariff war that seems inevitable. US President Donald Trump affirmed to impose 25% tariffs on Canada, Mexico and increase tariffs on China to 20%, leading to retaliatory measures from China and Canada, which could escalate into a full-blown trade war.
In addition, Trump suspended military aid to Ukraine, causing tensions with European allies. The market continues to monitor the upcoming US employment data, which could impact the Fed's interest rate policy, affecting the USD and gold prices.
⭐️Technical Analysis
Today's price range is focused on 2905 and 2877. The Dow trend will still be prioritized when Gold finds it difficult to close above important resistance zones. The Sell zones of 2905 and 2918 are heavily concentrated by sellers today. The furthest target of the week for gold will be to touch the bottom of last week around 283x. Pay attention to important price levels to have a reasonable BUY and SELL strategy.

Price is never random! TSLA Tesla nice bounce. Did you eat?✅Nice bounce off Tesla. 👌
ℹ️Remember PRICE is just one point and in my opinion always second to TIME.
🟢When the WHERE (price) matches the WHEN (time) that is when it all comes together and the magic happens.

Gold Price Analysis February 12⭐️Fundamental Analysis
Asian and European traders were cautious ahead of Fed Chairman Jerome Powell's remarks to Congress. Powell said he was in no rush to adjust monetary policy and wanted to see more progress on inflation, saying the economy was in a "pretty good place." His remarks helped stabilize financial markets, helping Wall Street trim losses and the dollar recover.
Powell will continue his testimony on Wednesday, and investors are also awaiting January CPI data, which is forecast to have risen 2.9% year-on-year, with core annual growth of around 3.1%.
⭐️Technical Analysis
Gold is accepting the 2941 area as a top, and the decline has created quite clear structures. 2873-2871 is an important support zone in pushing gold prices to increase again. If gold prices cannot close the h4 candle above 2890, it will be considered a confirmation of a dow breakout and a downtrend wave that can extend to 2833. In the direction of gold going up again, 2807 and 2827 will be the zones that the SELL side will pay attention to in order to participate in the market.
GOLD DUMP ... POSSIBILITY OR NAH?Hello everyone, hope you're all having a wonderful day !
Price is currently heading to a block of orders just around 70 and that's why M5 was used to sharpen entries for a tighter Stop... kindly use proper risk management if you're comfortable using a stop of 20 pips !
Happy new year everyone !
#NIFTY Intraday Support and Resistance Levels - 07/01/2025Expected nifty will open gap up in today's session near 23800 level. After opening any bullish movement expected if it's starts trading and sustain above 23800 level. Below 23750 downside rally expected upto the 23550 and this rally expected for further 200-250+ points movements in case nifty gives breakdown of 23450 level. 23450-23550 in this range possible some consolidation movements in market.
