Wah You Just draw random Lines!! BITCOIN!!!!So I get plenty of haters because I am original and not a cuck parrot.
I've been saying for over a week that Bitcoin will do exactly what it is doing.
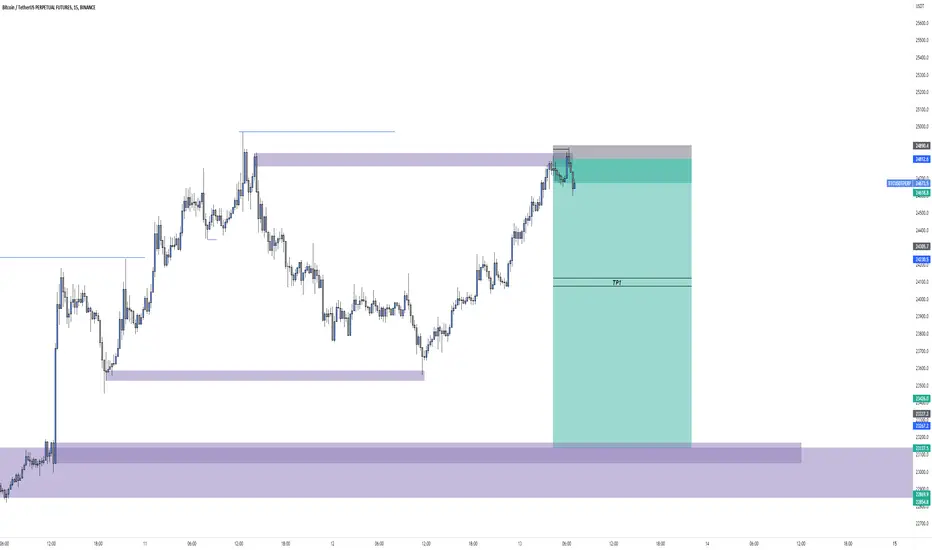
Big red sell with my ULTRA SIGNALS.
MACD Getting double RED DOTS.
Price can't break the yellow Grand Master Resistance. With a huge rejection out of the triangle and back for a touch with another rejection.
See how it works.. My T/A is on point.
If you're real you can relate.
If you're fake your gonna hate.
Be real to yourself.
Good luck 👍
Profits

Ace Trading Academy - AUDJPY Trade Precision AnalysisAUDJPY's previous 1-hour candle has closed and showed us a big wick rejection from the downside pushing back up to the upside. We have a previous wick rejection from the .5 area and a recent wick rejection from the .382 area on the fib tool.
Watching for a break to the upside!
Watch attached video for detailed explanation of trade.
Ace Trading Academy
Like, Follow, and Comment
Posting daily content and trades consistently!

BAKE AT YOUR ORDERS! 143% TRADE!! ️🔥We have a particular chart here. Not everything is bullish, but there is something that exposes the incoming rally; BTC dominance on BAKE.
Whenever BTC goes down, there the alts go. Well, BAKE does not! And has not done it this past days. Bullish rally incoming.
- Green lines are parcial TP zones.
- White lines are potential good entry zones, if you catch them.
Good luck traders . If you want to learn more about this chart, send me a private message or leave a comment.

Status: Porfolio UP 80%+ since 8/18 Post ..What's Next?Before: In my last post on 8/18 that it would be time for me to go heavy in the market, which I did.
Now: Up 80.45% on my portfolio since my huge short on $SPY and other adjacent tickers $QQQ, $IWM, $AAPL, etc. Could not have rode this move better.
Next: I'm out on a 90%+ shorts and would suggest trimming aggressively now in anticipation for a rally within the next few days. Will update on my thoughts of what's to come.
..there's so much frenzy in the markets, but your porfolio's got to feel good now 💸

NASDAQ100NAS100 overview this technical analysis is an analysis i did of what to expect from nasdaq today since the down trend has been broken the last touch was ontop of the other trendline this resulted in the drop nasdaq now nas100 is approaching our resisctance bar after that its going to rise up and we`ll be in major profits when this happens.
MYSTICFX

Handling losses like a pro!Hey traders,
Ever wondered how some of the professional traders can lose tens of thousands of dollars and still not be phased? Well, today I am going to chat about how and why they have the ability to remain consistent and trust the process, and how you can do the same.
Enjoy!

Reminescence of a Scam Operator (ANTI SCAMMER GUIDE)Reminiscent of the roaring 1920s, the 2020 epidemic and the inability to work for many people brought an influx of new retail investors to the public market. Furthermore, the FED's decision to prop up the market by dropping interest rates combined with stimulus checks handed out by the U.S. government lured in even more investors who were hungry for profits. Although the market sensation also brought a rise of omnipresent scams across all trading platforms.
Lack of workforce, sophisticated methods, and automated bots often play into the hands of perpetrators who try to get ahead of the platform and its users. Therefore, we decided to write this concise article with the purpose of helping new investors to recognize good apples from bad ones.
The most common means of communication for criminals is to use private chat, public chat, comments, ideas, and headline references. Several examples of red flags are shown below.
RED FLAGS AND OTHER POINTS:
Asking for personal information and TradingView account information
One common tactic criminals use to exploit their victims is to ask for personal information or account information (login and password). This information should not be disclosed to anyone, including someone claiming to be a platform's employee/support (as these people tend to have access to this information).
Asking for trading account information
Another standard method bad actors use is asking for trading account information. On such occasions, a perpetrator asks for existing account information or requests a victim to create a new account; then, a perpetrator usually asks the victim to invest money into the account and let them use it in return for shared profits.
False promises
The third point probably accompanies every other point on our list. This point relates mainly to false promises about trading achievements, which often include statements about having a high win rate, high net worth, and an unbeatable trading system.
Financial gurus and lavish lifestyles
A high follower count and strong social media presence do not equal reliability. Perpetrators often portray lavish lifestyles across social media platforms to entice more people and trick them into buying a trading signal service or trading course (or any other service). The public image does not necessarily have to match a person's authentic lifestyle. Indeed, trading as a career is highly time-consuming and does not come with trading from a vicinity of a pool or ski resort; that is just public perception.
Trading signals and trading courses
Unfortunately, most of the time, trading signal services (for buy) lack performance and do not consider subscribers' risk tolerance and account sizes. In regard to trading courses, we hold a similarly low opinion of them as we think learning a skill to trade goes far beyond a few hours of any trading course.
Unrealistic win-rate claims
Most brokerages report that their retail clients lose about 50-90% of the initial capital, especially when trading CFDs. Therefore, we would like to put in perspective how realistic claims about a high win rate really are. Professional traders tend to peak at approximately a 50% win-rate over a consistent period. Thus, claims about a 90% or higher win rate are likely to be false.
Guaranteed moves and risk-free investments
Another tactic of scamming utilizes guaranteeing moves in the market. However, there is nothing like a guaranteed move since the market constantly changes and is influenced by complex factors.
These are just few points we included, however, we ask a public to share their own points in the comment section.
DISCLAIMER: This content serves solely educational purposes.

Midweek Wednesdays - Time To Recover 👋 Hey everyone, so this week hasn't started off very well, but we found two setups that may be able to change that and set us up for another profitable week. So if you interested in learning what these two pairs are, then check out the video and let me know what you think.

The Truth About Trade AccuracyA critical component relating to trading success is the relationship between your win percentage and your bottom line. Many new traders hold some extremely inaccurate views when it comes to what kind of win percentage is required to generate net profit, including the notion they need a 70% or higher win percentage to achieve success. This notion is wrong and misleading. The relationship between your win percentage, your risk management, and the profit you generate from each trade are intricately related.
The beauty of this post is that the backtest logic in our Olympus Cloud indicator showcases the concepts covered with real trades, which is shown under this post in the data section.
The Positive Win Percentage
A win percentage over 50% is regarded as a probable edge or edge. Yet, even with a 60% win rate, you can generate a net loss. How? If your average loss is $100, but you are in the habit of falling prey to your emotions and prematurely selling your winners so you only generate an average of $50 when you win, you will lose money regardless of your 60% win rate.
No trader goes into a trade thinking, “Hey, I’ll lose $100 if I’m wrong and I’ll make $50 if I’m correct.” Nevertheless, random wins of $75, $25, $60, $40, $90, and $10 will average out to $50 per win. No one purposely tries to win half of what they lose, but random trading combined with random emotions produces random results.
We all desire winning and making good profits when we take a trade, but as emotions come into play, things quickly change. You may take a trade that reaches $75 in profit and then decide the move looks gassed out, so you sell. On another trade, you might get scared by some volatility, or notice a resistance you neglected to spot initially and sell for $25 of profit. It is all too common to fall prey to your emotions and behave in a way you didn’t plan to. The irony is, that you will regard the $25 trade as a winner, and it will raise your trade accuracy.
Let’s look at a simple example:
Example: 100 total trades with 60% trade accuracy
60 winning trades at an average of $50 per win = $3,000
40 losing trades at an average of $100 per loss = $4,000
Net loss of $1,000
In the example above, your break-even point is a 67% win percentage for a whopping $50 in profit. With this type of random risk and profit management, any meaningful net profit requires a win percentage upwards of 75-80%.
The psychological damage of having a higher average loss than an average win is hard to quantify, but it’s easy to feel frustration when one loss wipes out two wins. While this sounds like common sense, many, many new traders fall into the habit of random profit management and find themselves in this undesirable situation. The same theory holds true even if you let your winners play out, but you also let your losses escalate and take a few big hits to your account. In either scenario, your 60% win rate means nothing.
The Negative Win Percentage
In the case of a negative win percentage, you can produce a net profit even if you are correct less than 50% of the time. In this scenario, your advantage over the market is getting into trades that consistently provide large gains when you win, and by letting those winners play out fully. Furthermore, you can’t hesitate to cut your losses and keep your drawdown controlled. With this kind of win rate, you must not sell early or your entire business model falls apart. You must understand that the big winners will make up for any profit you leave on the table.
Let’s look at what happens if you are correct 40% of the time, but your average win is $100 and your average loss is $50:
Example: 100 total trades with 40% trade accuracy
40 winning trades at an average of $100 per win = $4,000
60 losing trades at an average of $50 per loss = $3,000
Net gain of $1,000
It is now clear that win percentage is not everything. You can make money even if you are correct on 40% of your trades as long as your average win is double your average loss. The smaller your average win compared to your average loss, the higher your accuracy must be to make a net profit.
Of course, if you can maintain a win percentage over 50% while also having proper risk and profit management you will end up far ahead.
Putting It Together
Clearly, the best approach is to combine a reasonable win percentage of over 50% with proper risk and profit management. You must consistently let your winners play out regardless of the emotions you feel in the moment and ensure you don’t take losses beyond a certain threshold. Furthermore, scaling out of trades – selling portions of your position as the market moves in your favor – will increase your accuracy and ease your mind. By dividing your position into two or three tranches you can lock in a certain amount of profit at predefined targets and then let the final portion ride out the trend with a trailing stop-loss.
Revisiting our example, let’s put these concepts together with a reasonable win percentage:
Example: 100 total trades with 55% trade accuracy
55 winning trades at an average of $100 per win = $5,500
45 losing trades at an average of $50 per loss = $2,250
Net gain of $3,250
Now, that’s what you want to see!
It’s more important you behave in a consistent manner and follow a predefined game plan than it is to have 80% trade accuracy. It is wise to strive for reasonable trade accuracy – 50% to 65% – and remain consistent in order to fulfill your trading potential.
After you have mastered your emotions with a consistent strategy, perhaps you can raise your win percentage to mythical values like 80%. As we have covered, though, such accuracy is not required for great trading results.

US30 20th of AugustUS30 closed the week amazingly. Breakout of the pattern, retest on the supply zone and price started going down. I'm expecting price to continue the bearish trend next week.

GOLD Hit All Targets +270 Pips CONGRATULATIONS Folks This Is An Educational + Analytic Content That Will Teach Why And How To Enter A Trade
Make Sure You Watch The Price Action Closely In Each Analysis As This Is A Very Important Part Of Our Method
Disclaimer : This Analysis Can Change At Anytime Without Notice And It Is Only For The Purpose Of Assisting Traders To Make Independent Investments Decisions.

🔆 16-8-22 Daily result+26.6%I trade 3 pairs Nasdaq Usdjpy and Bitcoin . All these pairs gave us a total of good profits , i constantly update my trade forecast and take trades based on them .

EUR/GBP: Free Sell Signal Is Ready For You Don't Miss It This Is An Educational + Analytic Content That Will Teach Why And How To Enter A Trade
Make Sure You Watch The Price Action Closely In Each Analysis As This Is A Very Important Part Of Our Method
Disclaimer : This Analysis Can Change At Anytime Without Notice And It Is Only For The Purpose Of Assisting Traders To Make Independent Investments Decisions.

Gold: New Setup With A Detailed Analysis You Can Enter NowThis Is An Educational + Analytic Content That Will Teach Why And How To Enter A Trade
Make Sure You Watch The Price Action Closely In Each Analysis As This Is A Very Important Part Of Our Method
Disclaimer : This Analysis Can Change At Anytime Without Notice And It Is Only For The Purpose Of Assisting Traders To Make Independent Investments Decisions.

AUDCADIn AUDCAD after market test its strong resistance trendline at 0.91059 price drop to 0.90930 after the market open if price break market structure 0.90830 than you go for short position and exit on the coming support which i draw in the charts. if price come back and push to upside than wait for the trendline resistance again test if you see again some strong bearish candles than you go short with very good R:R.
ENTRY SHORT 0.90808 AND 2ND 0.91049
TAKE PROFIT 0.90561
TAKE PROFIT 0.9030
STOP LOSS 0.91171

BTC Short setupShorting BTC till the first TP :) good luck.
BTC seems kinda bearish to me.. I`ll take the risk and short it from here.
SRM/USDT long positionSRM/USDT long high risk position , this coin gives profits a lot!!!
open: 1.027
Target 1: 1.060
Target 2: 1.085
Target 3: 1.110
Stop: 1.015
hope you enjoy it

Jubilant FoodworkWhenever break 0.5 Fib retracement with the good volume then long position is start

One final drop for natural gas and then a massive bull runWe're looking for one final drop in natural gas prices to complete a wave C for wave 2 before we will start accumulating positions to go long for the next bull run in natural gas. There's an energy crisis that isn't going to disappear anytime soon, there's plenty of fundamental reasons for this huge move we're expecting in wave 3. But in the mean time we're short on natural gas until this wave C is complete.

Shorting AUD/USD on the basis of S&R !! #ShortShorting AUD/USD on the basis of S&R !!
This trade is for Educational Purpose only.
The Goal is to highlight the importance of Support & Resistance zones (S&R) and how can Weak and Strong zones be identified.
Support & Resistance (S&R) can play vital roles when it comes to trading. Most traders use S&R in order to look for precise entries and exits.
The Pair has been Bouncing off from zone Marked in Red which acted as Support earlier. The Support was tested four times.. Soon it was broken with strong Bearish Candle. The more touches/bounces the Support zone had, the weaker it got and as a result it got broken. Often time Support acts as Resistance zones and Vice versa . It is important to note that S&R can act as a strong Confluence but trading just on the basis of it alone can be dangerous. Using other Confluences such as Market Structure, Divergences and Chart Patterns such as Double Top/Bottom are equally important. Since Trading is the game of Probability, it is Essential to have more than One Confluence.
The Trade Plan:
The trade plan is to Short AUD/USD, once it re-tests the broken support zone which is now likely to Act as Resistance.
Note: Take this trade after doing on your own analysis.
Target:
Target is set on the basis of Fibonacci Re-tracement which comes in between 0.618 & 0.5.
Stop Loss:
Stop Loss is simply set on the basis of 1:3 Risk to Reward Ratio.
Time Frame used:
1H
Analysis based on:
- Market Structure
- Support & Resistance.
- Fibonacci Retracement tool .. used for setting Target

Head & Shoulders Pattern Formed on GBP/USD !! #ShortHead & Shoulders Pattern on GBP/USD !!
The Head & Shoulder Pattern seemed to have formed on 4 Hour, I will wait for
Retest of Neck-Line before Shorting GBP/USD .The Risk to Return ratio is 1:3. It can be a really good trade if executed correctly.
Target is chosen by Measuring the Distance between Neck-line and the Head , further the same distance is then used after Break of Neck-line to establish correct Target area.
Stop loss is set where the Price is least likely to get hit hence the 1:3 RR.
note: Do your own analysis before taking the trade.
Analysis based on;
1, Price Action
2, Chart Pattern
3, RSI - Overbought/oversold zone
4, Candle-stick Pattern
Time frames used:
1 Hour
4 Hour

ENJOY YOUR WEEKEND FAMILY!!!! EURUSD has LEFT THE BUILDING!!!! "They that wait upon the Lord shall renew their strength.
They shall mount on wings of eagles and soar!' Excerpt from Isaiah 40:27-31
Patience and Discipline.
Patience to wait on your trade set up.
Discipline to stay with the BIAS determined for your set up aka Trading With the TREND.
If you followed my previous post you're gonna have a GREAT WEEKEND$:)! Treat yourself to something nice. Take your family out for ice cream.
Then re invest back into your account to compound again next week! This is a 7 TRILLION DOLLAR SPACE we are BLESSED to be apart of daily.
My Mandate is to show you where the $ is flowing and point you in the right direction. Mission complete.
Never over leverage.
Trust your trade set up.
Have fun!
I AM Pro Trading Made Simple.
We are #SniperGang

US30 : Hitting the target Few hours ago I’ve analysis for the US30 and I expect it will go down touching demand
