How to Use ATR in TradingViewMaster ATR using TradingView's powerful charting tools in this step-by-step tutorial from Optimus Futures.
ATR, or Average True Range, is a volatility indicator that helps traders measure market movement, set appropriate stop losses, and adjust position sizing based on current market conditions.
What You'll Learn:
Understanding ATR as a volatility measurement tool that tracks price movement regardless of direction
How ATR calculates the average range between highs and lows over a specified period — typically 14
Why rising ATR signals increasing volatility and larger price swings
Why falling ATR indicates decreasing volatility and quieter market conditions
Using ATR to set dynamic stop losses that adjust to current volatility rather than arbitrary dollar amounts
How to calculate stop distances by multiplying ATR by factors like 2x or 3x
Applying ATR for position sizing to maintain consistent risk across different volatility environments
Setting profit targets based on ATR multiples to align with actual market movement
Filtering trade setups using ATR levels to avoid low-volatility periods or confirm breakout momentum
How to add ATR on TradingView via the Indicators menu
Understanding the default 14-period setting and how shorter or longer periods affect responsiveness
Practical examples using the E-mini S&P 500 futures chart
Applying ATR across daily, weekly, and intraday timeframes for risk management and trade planning
This tutorial is designed for futures traders, swing traders, and risk-focused analysts who want to integrate volatility-based risk management into their trading approach.
The methods discussed may help you set smarter stops, size positions appropriately, and adapt your trading strategy to changing market conditions across multiple markets and timeframes.
Learn more about futures trading with TradingView: optimusfutures.com
Disclaimer
There is a substantial risk of loss in futures trading. Past performance is not indicative of future results. Please trade only with risk capital.
We are not responsible for any third-party links, comments, or content shared on TradingView. Any opinions, links, or messages posted by users on TradingView do not represent our views or recommendations.
Please exercise your own judgment and due diligence when engaging with any external content or user commentary.
This video represents the opinion of Optimus Futures and is intended for educational purposes only. Chart interpretations are presented solely to illustrate objective technical concepts and should not be viewed as predictive of future market behavior.
In our opinion, charts are analytical tools, not forecasting instruments.
Profittarget

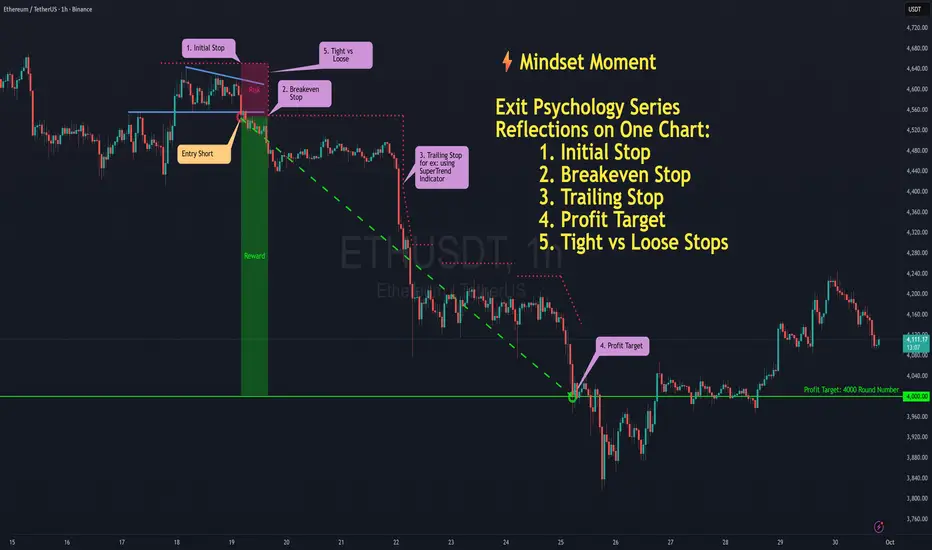
Exit Psychology – Reflections On The SeriesNOTE – This is a post on Mindset and emotion. It is NOT a Trade idea or strategy designed to make you money. If anything, I’m taking the time here to post as an effort to help you preserve your capital, energy and will so that you are able to execute your own trading system as best you can from a place of calm, patience and confidence.
Over the last few posts we’ve walked through the psychology behind many exits. Here on this chart, you can see how they all might have played out on a single trade.
One trade, four different exits. Whichever you choose to implement isn’t just a technical decision - it’s a psychological mirror.
Taking each in turn:
The initial stop: the line where you admit, “The trade idea didn’t work”
The break-even stop: the comfort of “I can’t lose now.”
The trailing stop: the wrestle between protecting gains and letting them run.
The profit target: the choice between certainty and potential.
Put them all on the same chart and you’ll notice something: none of them are just about price. Each is a reflection of the trader making the call.
What we’ve uncovered in this series:
The initial stop tests whether you can accept being wrong on a trade idea without making it personal.
The break-even stop shows how much discomfort you’re willing to tolerate before reaching for relief.
The trailing stop mirrors your balance between fear of giving back and trust in your process.
The profit target surfaces your relationship with certainty versus possibility.
And tight vs. loose? That isn’t just a preference. It begins with trader type: your personality, values and beliefs set a natural baseline. It’s shaped further by how well your strategy fits that style. And in the moment, emotion (fear or hope) nudges you tighter or looser than planned.
The bigger reflection:
Exits reveal more than entries. They show how you handle:
Loss and regret.
Control and uncertainty.
Trust and identity.
Comfort and growth.
But reflection alone isn’t enough. To turn insight into progress, you need practical ways to anchor behaviour:
Pre-commit in writing: Note where you’ll exit before you enter, it closes the door to mid-trade negotiation.
Separate outcomes from emotions: Journal not just where you exited, but how you felt in the moment. Patterns emerge quickly.
Differentiate protecting vs. controlling: Ask yourself, “Am I moving this stop to protect the plan, or because I’m uncomfortable right now?”
Train the nervous system: Notice the physical urge to act and how it shows up in the body (ex: shallow breath, tense shoulders). Pause before execution and breathe. Slow down the ‘urge’ and re-train self trust.
These small practices are how you build the consistency to stay aligned with both your system and your psychology.
Closing thought:
The market doesn’t care where you exit. But your mindset does - and so does your account.
Clarity in those decisions is where growth begins and where your odds of staying in the game increase.
In the end, your edge isn’t only your system. It’s your state of mind - before, during and after engaging with the market.
I hope you’ve enjoyed this series. If so would love to hear in the comments.
Here’s a recap of the entire Psychology of Exits series in case you’d like to check out the details of each:
Exit Psychology 1/5 : The Initial Stop
Exit Psychology 2/5 : The Break-Even Stop - Comfort or Illusion?
Exit Psychology 3/5: The Trailing Stop – Patience vs Protection
Exit Psychology 4/5 : The Profit Target – Certainty vs. Potential
Exit Psychology 5/5: Tight vs. Loose
And finally here is the link to the original article by TradingView that inspired this series as promised:
p.s. Apols if anything is odd in this post, I have had to repost it.
EURJPY 4H | Bullish Breakout & Retest – Next Big Move?The EUR/JPY 4-hour chart presents a compelling bullish breakout setup following a structured downtrend. The market recently broke through a significant resistance zone, indicating potential further upside movement. This analysis outlines key price levels, market structure, and an actionable trading plan.
📊 Market Structure Overview
🔸 Downtrend Reversal: The price was previously trading within a descending channel (highlighted in green), forming lower highs and lower lows.
🔸 Support Confirmation : The price bounced from a strong support zone around 158.500 - 160.000, confirming buyers' interest in this region.
🔸 Breakout & Retest : A strong bullish impulse broke through the 164.500 - 165.000 resistance zone, suggesting a shift in market sentiment.
📌 Key Trading Levels
🔹 Support Zone: 158.500 - 160.000
This area previously acted as a demand zone where buyers aggressively pushed the price higher.
It now serves as a safety net for long positions.
🔹 Resistance Zone (Now Potential Support): 164.500 - 165.000
Price has broken above this level, but a retest could provide an ideal entry for confirmation.
🔹 Next Major Resistance (Target Levels):
TP1: 165.000 → A psychological level and previous resistance.
TP2: 166.020 → A higher resistance zone where price may struggle to break through.
📈 Trading Plan – Long Setup
✅ Entry Confirmation:
Wait for price to pull back to the 164.500 - 165.000 zone.
Look for bullish candlestick patterns (e.g., pin bars, engulfing candles) to confirm buyers stepping in.
🎯 Take Profit Targets:
TP1: 165.000 (Initial resistance level)
TP2: 166.020 (Potential extended bullish move)
🛑 Stop Loss Strategy:
Below 160.038 (Previous structure low & key support level)
Ensures protection against potential fakeouts or trend reversals.
📢 Risk-Reward Ratio:
Aiming for 2:1 or better risk-reward ratio for an optimal trade setup.
📝 Market Outlook & Conclusion
📌 The recent breakout above resistance suggests bullish momentum is strong. However, traders should be patient and wait for a pullback to enter at a better risk-reward level. If price successfully retests and holds above 164.500, there is a high probability of continuation towards 166.020.
🚀 Trading Bias: Bullish – Until market structure shifts or a major rejection occurs at resistance.
📢 Final Trading Tip
🔹 Patience is key! Don’t rush into a trade immediately after a breakout. Wait for confirmation, as false breakouts are common in volatile markets. A successful retest of the broken resistance will provide a low-risk, high-reward entry opportunity.

EURUSD Momentum Break: Trade Setup and Alternative ScenarioBased on this morning’s analysis, we’ve seen a break above the momentum high, signalling that buyers remain confident the EURUSD isn’t too overvalued.
As a straightforward principle, we trade what we observe. Buy above the momentum high, aiming for the next decision point at 1.1140 (H4 Structural Point).
Stop Loss:
What gets you in, gets you out!
Technically, if the price drops back below the momentum high (1.10899), it will be a negative signal for buyers. Therefore, we’ll set a conservative stop at 1.1085.
Profit Target:
1.1134 (Fibonacci Target)
1.1140 (Structural Target)
Alternative Scenario:
If the price breaks below 1.1085, buying is no longer advised. We will reverse the position for a trend reset trade towards the Fibonacci buy zone range of .
Happy Trading!

USD/JPY - Bullish Trend ContinuationThis morning, the focus is on the Dollar-Yen pair. The bullish trend is evident across all timeframes. Yesterday, we observed a strong break of the reversal structure at 161.269 after reaching a momentum high of 161.95. This break is crucial for the continuation of the bullish trend. Following the break, a bullish pattern has formed, and the price has moved into the Fibonacci buy zones of the initial move. Given this setup, the high probability action is to buy or do nothing above 161.57.
Stop Loss: 161.14
Target 1: 162.35
Always think in probabilities.

📈 Tata Steel: Bouncing Off Support and Eyeing New Highs! 🚀Hello traders!
Today, let's dive into $NSE:TATASTEEL. Here's the breakdown:
📉 Support Bounce: Tata Steel has recently touched its support at Rs.132 and is now making a move upward.
📈 Targeting ₹140: The current trajectory suggests a push towards the near-term profit target of ₹140.
💹 Derivative Opportunity: For derivative traders, considering the 130 call option could be a strategic move.
✨ Potential Upside: With good support, there's a chance for Tata Steel to soar higher. Keep a close watch for further developments.
🔄 Dynamic Market: Always remember, the market is dynamic, and these are observations. Conduct your analysis before making any trading decisions.
🤔 Your Take: How do you interpret Tata Steel's movement? Share your insights in the comments!
📌 Stay Updated: Let's navigate these markets together. Stay tuned for more posts and updates!
Best regards,
Alpha Trading Station

CADJPY Successful Live tradeI am providing an update on the ongoing CADJPY sell trade. All the confirmation levels have aligned in favour of the short position, validating our initial analysis.
As anticipated, the price swiftly broke below the 1dh (one-day high) and continued its downward movement, breaching the structure (4). This development confirms the bearish momentum in the market.
The trade was eventually closed out at the trail stop, coming just 5 pips short of reaching the initial target. While the trade did not fully achieve our desired outcome, it still resulted in a profitable exit.
Additionally, I have conducted analyses on the GBPUSD, AUDUSD, and USDJPY currency pairs. These analyses provide valuable insights into their respective market conditions and potential trading opportunities.
Wishing you continued success!

Short Selling Opportunity Ahead: AUDCAD Analysis | 4h chartHello traders,
As you can see in my previous post the resistance level reached and profit target hit.
Now again short selling opportunity on the horizon. Wait for the OANDA:AUDCAD to close below stable support (0.91200-0.91500) and test resistance before opening short position.
Avoid long position due to downward trend and high supply.
Thanks & regards,
Alpha Trading Station
Disclaimer: This view is for educational purpose only & any stock mentioned here should not be taken as a trading/investing advice. We may or may not have position in the stocks mentioned here. Please consult your financial advisor before investing. Because Price is the "King of Market".

META - Entry. Profit Target, Stop LossThoughts on where I think META could go in the near future. Long Swing Trade on 3 Hour chart SST Strategy based, follow me for more insights and ideas on Stocks !! "Simply Successful Traders"

+200 pips bagged then a clean bounce from our Fib zoneOn friday which was on the 5th of this month August, i called in a signal for a sell, hours before the NFP data release which in truth was a pullback to a Fib zone (0.618) in M15.
Price reacted to the Fib zone by bouncing off of it which signals a continuation of the uptrend regardless of the NFP impulsive sells.
This is my own opinion of what the price of Nasdaq intends doing.

Market Structure Alignment DOGECOIN USING BAR CHART H4**************************************
Market Structure Alignment
DOGECOIN
M =
W =
D =
H4 = br
H1 = br
M15 =
M5 =
M1 =
**************************************
BIASES:
BB = Bullish BIAS
BRB = Bearish BIAS
****************************************
CODES:
b = Bullish
bg = Bullish Range
br = Bearish
brg = Bearish Range
****************************************
Bimb = Buyers IMBalance
Simb = Sellers IMBalance
****************************************
Boms = Break of Market Structure
Bboms = Bullish Break of Market Structure
Brboms = Bearish Break of Market Structure
****************************************
DZ = DemandZONE
SZ =SupplyZONE
************************************
H = High
HH = HigherHIGH
HL = HigherLOW
L = Lower
LL = Lowbrow
LH = LowerHIGH
*************************************
POI = Point Of Interest
IMB = Imbalance
IC = Institutional Candle
MIT = Mitigation
*************************************
Black = Monthly
Red = Weekly
Green = Daily
Yellow = H4
SkyBlue = H1
NavyBlue = M15
Pink = M5
Purple = M1
Orange = Alerts
************************************

READY FOR LIFTOFF?Lookin at a decending wedge, you have price touching the bottom trendline of a rising channel.If price falls below this zone your looking at the next zone below between $1.85-$1.61. Coming closer to the bottom of this wedge I don't see price retesting the lower trendline of the wedge, but anything is possible. 1st target looking at $9.75, if we get past that I'm projecting a 2nd tarjay @ $19.00, where we have the next major monthly supply zone and some resistance. Let me know your thoughts.

Cypher Pattern Profit Target Reached in Stocks!! 😎Stocks have broken down from our butterfly cypher pattern. This has been a long time in the making, and our analysis with harmonic patterns has foretold this correction weeks prior. We have actually broken down a bit past the target, to the 0.618 Fibonacci retracement level at 4144, which is also a technical level. If anything is going to slow the bleeding for stocks, it would be a level like this. That appears to be the case, as we have seen a bounce back to 4193. The Kovach OBV has definitely taken on a negative trajectory, but could be rounding off perhaps suggesting more momentum may come through. Momentum at the open will likely foretell where the price action is going today.

Eur/Gbp Profit target achieved 56 Pipsthis was a wonderful setup which we took the trade last week. and fortunate enough we saw a wonderful gap to dowside hitting our 56 pip profit target. have a look at the perspective on this week i broke down another setup . i will link it below watch it
Thank you for the support. and dont forget to follow me!!!

USD/JPY Profit Target Achieved!! 126 pipsWe have a wonderful trade, achieved 126pips. wow. hope you guys enjoy the breakdown. for those who wanna see the break down i will link it below
follow me for more updates

EUR JPY UPDATE I posted this morning I got into this trade
quick update, this went as to plan and we have just hit profit target.
think it is very important win or loose a trade to share this. in all trades you should look at risk first and worst case rather than how much money you could make.


USDCHF 2.34% on autopilotHit profit goal last night around 1am. Of course it kept running and we could have made a huge profit. But, the goal is to catch the wave consistently not squeeze every ounce out of every trade.

XBTUSDBitcoin has come down and tested the low from 2019-07-02, between it and the weekly were a nice entry zone. We only just tapped the range, only giving me a partial fill. Continuing higher, I'd look for some profit-taking around 10245.
You could use the profit target as a short entry but I would keep my stop tight.

Short term FUN trading idea for nice profitHello, guys as descirbed we might reach 1 st target soon and 2nd possible too in next also depending on how btc price will go

TSLA - 08/07Elon Musk just upgraded $TSLA to a BUY with a profit target of $420!
$420 PT must be based on Fundamentals?
Lol

Intermediate Trading Strategy - Part 3In the previous post we discussed risk:reward, profit taking and trailing stop losses. If you have not read part 1 and part 2 then you are highly recommended to start there.
Taking Profit
Always taking partial profits, never making decisions for the full position. This is true when entering and this is true when exiting. It minimizes anxiety and emotional decision making.
In Trending Markets: Stop loss is trailed once new highs/lows are established. If long then move it up to be slightly under the recent low and if short move it slightly above the most recent high. This can generally be illustrated with Bill Williams Fractals on the weekly and daily charts. Full profit can be taken on the third test of a trendline.
In Parabolic Markets: I like to gamble on house money, it makes me feel much more comfortable about the draw downs. Here is an example for how to take profits in a parabolic market: If +100% then take 10%-20% off the table. If +100% again then take another 15%-25% off the table. Keep doing this as long as price is making all time highs.
Take full profit if phase 4 or phase 3 of hyperwave is violated
If weekly and daily RSI (with 30 setting) are > 80 then take full profit. If Welles Wilder’s ADX is > 50 on the weekly and/or > 60 on the daily then time to take full profit.
For Bitcoin' watch for NVT to reach overbought zones and consider how this metric will be affected by Lightning Network and batching transactions.
If Trading a Pattern: A chart pattern will indicate a profit target. If your reason for entering the trade was the chart pattern then do not get greedy with the profit target! Relying on a trailing stop will often cause a trader to miss out on a large part of the profit when trading a pattern.
Be very specific about what you are investing in long term/hodling and what you are using to trade.
If investing/hodling then put into cold storage and don’t do anything for a minimum of 10 years.
In the final post we will delve into the best indicators and provide guidelines for when they are most effective.

aELF - Target 1 reached ... can we go to Target 2??Hello All,
Here's an update on aELF.
So those who followed my call last night would have woken up to a 15% profit this morning. BTC is expected to make a pullback and could very well be doing that now (this appears to be wave b of an abc correction up). Once wave b is complete, BTC could start moving up in wave c and that could propel ELF through resistance. IF wave a of the ELF correction is over (it might not be), that would make wave a $0.25 long ... and assuming wave c does the same ... this could bring us to the next target level of 1.55.
For those who bought low, perhaps take partial profit, but it may be worth the gamble to see if we can get to 1.55.
Personally I'm holding, as I don't see a huge BTC drop coming in yet. I have raised my stops though so I do protect some profit. I'm willing to give it a shot, given generally most believe BTC will continue to 8600 - 8800 level ... there could be some good profits to be made on ELF!
Remember only a fool relies on one potential outcome.
Do not make financial decisions using this info. For educational purposes only.
If you wish to make a donation, based on profit you made on my ideas ... it would be greatly appreciated.
BTC address 14i2Xit5pH7Sz5TMegDn8vDT6VcoN85f42
ETH address
0x8a62eE1B2628297EA51aD08dadFFCed3F73e6eed
LTC address
LXoyzmL85HvED1LyHkJtGygUPbBUZd
