SKY | Ascending Triangle Breakout Position | Entry @ Pullback SKY | Thailand SET Index | ICT Sector | Price Action & Chart Pattern Trading
> Upcoming ASCENDING TRIANGLE BREAKOUT - Entry@Pullback position | strong momentum breakout anticipated
> RSI bullish signal above 50
> MACD bullish golden cross above baseline
Estimated TARGET POSITION above +20%
Strong DEMAND SUPPORT line for STOP ZONE
Trade with affordable risk ratio 3:1
Always respect your stop-loss
Good Luck
Pullbacktrade

SNX, MAY HAVE A BREAK !!!SNX may be able to break the both dynamic and static resistance areas as the rsi has retested the dynamic resistance...
Stay for pullback on 8.50 ,please. Market is really dangerous now !!!
-Thanks-

Bullish Continuation after Retrace from ATHAfter LUNA made a new ATH and establishing a break of structure on lower timeframe, I'm entering on a pullback to participate in the anticipated continuation of bullish momentum. Targets defined by Fib Extension: levels 1.27, 168 and 2. Will trail the stop along the way and manage this position moderately aggressive.

EURUSD - Higher Highs in Consolidation @ Weekly Support*** Trade at your own risk! ***
*** Not every idea is also traded by us ***
Hi Traders!
The idea of the market is that the Downtrend has turned to a Range.
Because the continuation of the Downtrend often happens at the weekly Trendline,
the market pulls back towards the weekly TL.
Let's check the little MTFA components out which led to this idea:
Weekly Stage:
- Price at weekly Support
- Normally Trend Continuation when weekly TL arrives
--> In this case is the weekly TL far away, that's why we don't have to resist against this problem
--> It's even the other way round: Price/Bears now has/have a target to wait before Downtrend continuation
Daily Stage:
- (just marking daily Support and Resistance)
H4 Stage:
- Market made higher Highs in Downtrend
- Downtrend turned to Range, where we have higher Highs
- Bullish movements a bit stronger than bearish movements
Possible Entry Scenario:
- Wait for the last fractal Top to break
- Wait for Retest
- Trade at Retest
- SL below last low
- TP at the Fib' Golden Zone + weekly TL
If you have any questions or another POV, feel free to comment!
Thanks and successful Trading :)!

$AMAT - Perfect Uptrend Flag Pattern and PullbackAfter 6 Months accumulation in flag pattern, Price started to go higher with sufficient volume. Pull back to resistance zone is good sign for going more higher level.


EURAUD SHORT IDEAHey guys, after the previous bull run, i expect this pair to retest the 1.56567 zone

EURUSD ready to go higher ??OANDA:EURUSD
according to my analysis about EURUSD on monthly timeframe I still I'm on my word about growth of EUR against USD and probably other pairs too .
what do you think ?
mention your idea about EUR in comments .

EURUSD to the moon ? xDOANDA:EURUSD
Hey guys , so here we are with EURUSD on monthly timeframe :
the long term downtrend is broken and now we are at pullback to this trendline ...
If we see a bullish candle (on monthly) then EUR may go higher in the future .
what do you think ??
mention your idea about EURUSD on comments .

GBPAUD Long Trade Opportunity I'm waiting for a pull back to the EMA. I would like to see a price action signal at dynamic support level (EMA 10 EMA 20).

Tesla Bullback down!!! (short)I think tesla goes down the next hours because its goes under the the line and is near at overbought and got a pullback down so yeah, im in tesla short!!

USDCHF MOVE ON COMING MONDAY ANALYSIS USDCHF had currently broke through it's resistance and we would not choose to enter the market at such a high price. As a smart trader we should wait for the price to have a small pullback but alot of trader would enter at a much higher price because their indicators told them to do so and this one of the way that bank or big institutions manipulate the market . As shown in the chart we have a good fibo level of 50% and is a good area to enter .
COMMENT DOWN BELOW OF YOUR OPINION AND LET'S IMPROVE TOGETHER. If you enjoy my content please like and comment . Thank you very much successful traders happy preparation day!!

POLKADOT (DOTUSDT) SELLING OPPORTUNITY (BEARS INCOMING)
We should always trade with market structure which has been a little down trending and honestly needs a correction for healthy movement of market to rally upwards.
One more strong reason for bear market is the "BTC: All Exchanges Estimated Leverage Ratio" is at all time high. And whenever that happens, we see a good/decent amount of correction.
Check here - cryptoquant.com
The yellow trend line recently got broken on daily timeframe which is a powerful signal of a small pullback in order to rally upwards.
If we go to 4h timeframe, currently 200-EMA is holding the market and taking support from region which was once a resistance zone.
If the price breaks 200 EMA on 4 hour time frame, we will see a good breakdown of price to achieve our target. And remember to accumulate also when the price reaches these targets for long term as I think we might never get polka dot again at 40$ ever.
ANALYSIS FOR TAKING SHORT
1. Recently broke trend line on daily timeframe.
2. Taking support from area which was once resistance before on 1 hour timeframe.
3. 200 EMA holding strong on 4 hour time frame.
If all of these things gets broken down, i.e. price drops below 200 EMA (Around 44.3), Go short with less leverage (3x-7x) and take profit as target given (41.7)
IMPORTANT : Market is most volatile in November and December. DON'T TAKE UNNECCESARY TRADES WITHOUT PLANNING.


Wedge & Pullback ($MANA)If we consider MANA past leg , chart gone from 0.6 to 4...
We see a Ascending Channel Pattern
Fibo is saying everything ()
TP : Fibo extention of the break out leg from wedge
SL : Fibo retracement
Note : As always this is just an idea open positions at you own choice of risk

GBPNZD - Bearish Continuation TradeIn this video we're going to take a look at a bearish continuation setup on the $GBPNZD. The idea behind this trade follows my 4-step I.P.D.E. process of Identifying what price has recently done & then using that knowledge to make a prediction of what direction are we likely to continue in next & IF we do continue in that direction THEN where is the next level that we're likely to run into trouble at.
In today's example the I phase was a previous level of structure support that was recently violated along with the reading of the last days candle. The P section used structure recognition, harmonic moves & psychological numbers to dial down on a target location.
I hope you guys enjoy the video, I hope it's informative & most of all i hope that you have a positive week on your trading journey.
If you have any questions, comments or just want to share you idea, please feel free to do so below.
Akil

NVDA , pullback and harmonic patternNVDA has broken the up trend channel and now it’s on pullback
There is also a weak resistance zone nearby
And there’s a harmonic pattern (BAT)
So I expect price to fall in the next day that WallST opens
What’s your opinion guys ??

EURGBP is in a key level!At the moment price reached a very important area for EURGBP and we have two different scenarios for this case:
----------------------------------------------------------
1. Wait for rejection and buy for a bullish movement.
2. Keep looking on the chart and wait for the breakout. then sell at the pullback.
----------------------------------------------------------
So it can be a good trading opportunity that we can focus on it in the following days.
We will update this post step by step and see what would be the best decision for this currency pairs.
Please share your idea about it and bring your reasons. Buy or Sell and why?
Thanks for being & supporting us.
Good Luck!

AUDCAD 4h technical analysis OANDA:AUDCAD
Recently audcad had a good support at 0.911
I just took a look at it's chart and understood that I missed the long position cuz it wasn't in my watchlist .
But let's see when we can enter it for long
The price is moving with a strong bullish momentum
There's a trendline and it seems it's gonna break because of the strong momentum we have .
So IF it breaks , the best strategy for entering long position is to enter at pullback to the trendline .
So we need to wait and see what gonna happen to audcad and we need to wait for confirmations and then enter with a good R/R and risk management .
what's your idea guys ?

ESTY - pullback tradeEtsy, Inc. is an online marketplace for buyers and sellers, and operates in the United States, Canada, the United Kingdom, France, Germany and Australia. It mainly focuses on handmade or vintage items and craft supplies that include unique jewelry, on-trend clothing, bags, toys, art, home decor and furniture. In addition, the company offers several services to sellers including payment processing, advertising platform and shipping services.
ETSY is a strong buy within the analysts circles, with an average buy target of USD 224.
Stock has been popular within the Blogging community, Hedge fund activity has also seen a bullish signal with about 341.5K shares added last quarter.
From a technical perspective, price is sitting right below the 20 Day Moving Average, but above the 20 Week moving Average. Both should add some indecision in some of the traders minds. However, RSI is bullish on multi time frames.
Out of the 147 stocks in the Retailing space, 42% are above the 5Day MA and 24% are above the 20 Day MA. The sector needs to show more action to bring the bulls interest back in here...I
If ETSY closes above the 20 Day MA, we could look for a swing trade.
ELong

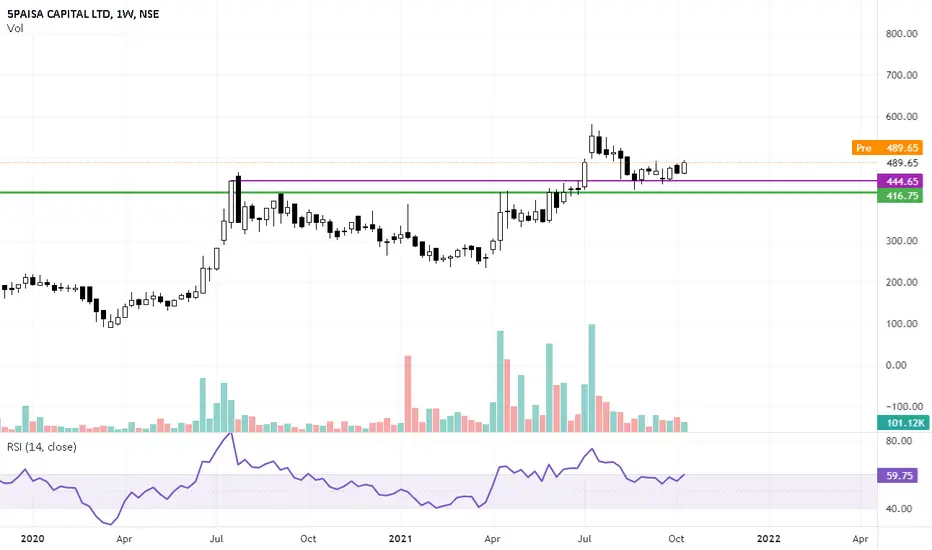
5 PAISA - Pullback Trade5 paisa made high of 444- 465 in July 2020 and retraced some part of its previous rally only to take support around 235 levels.
The stock then started rallying again but was not able to break through previous resistance( highs made in July 2020) and traded sideways near the resistance for about 3 months.
Finally, it managed to break above in the first week of July 2021 with a Big bull candle, volume also saw some rise.
Now Prices are retraced back to the breakout levels and sustaining above it.
It looks like stock may test its recent highs and also move beyond it, in the coming trading sessions.
CSCO has breakout from it's long term uptrend channelNASDAQ:CSCO
Hi everyone , we hope you're all fine and having a nice time.
let's take a look at CSCO chart together :
- A long-term uptrend channel is recently broken
- The price is going to move as a pullback now
- Also the price is so close to touching the 50 EMA
- also there are fundamental issues that can affect on the price of CSCO to fall
----------------------------------------------
I think we must wait for price action and candlestick confirmations to the pullback
and after that we can take a short position with 1.72 R/R
----------------------------------------------
what's your opinion guys ?
I'd be glad to see your comments and ideas .

