Dogecoin: Uptrend Intact, Eyeing $0.90–$1.00 ZoneCRYPTOCAP:DOGE #Crypto #Memecoin #ElonMusk — September 24, 2025.
Price (Sept 24, 2025): $0.24700
Chart (1D):
•
•
💡 Entry & Exit:
Entry: $0.24700
🎯 Take Profit: $0.8900 (+260.32%)
My View:
Dogecoin pulled back nicely, but the overall uptrend is still intact. We’re seeing that rounded base start to tilt toward acceleration. Remember, this is Elon Musk’s meme coin = and it’s also tradable on Robinhood.
Looking at Coinbase order books, there’s a grid of buy orders stacked all the way up to $2.50. If we factor in a light breakout and the 1.618 Fibonacci extension, the $0.90–$1.00 range looks like a logical zone to lock in gains and move on from this coin.
The recent dip across crypto definitely shook a lot of people = myself included.
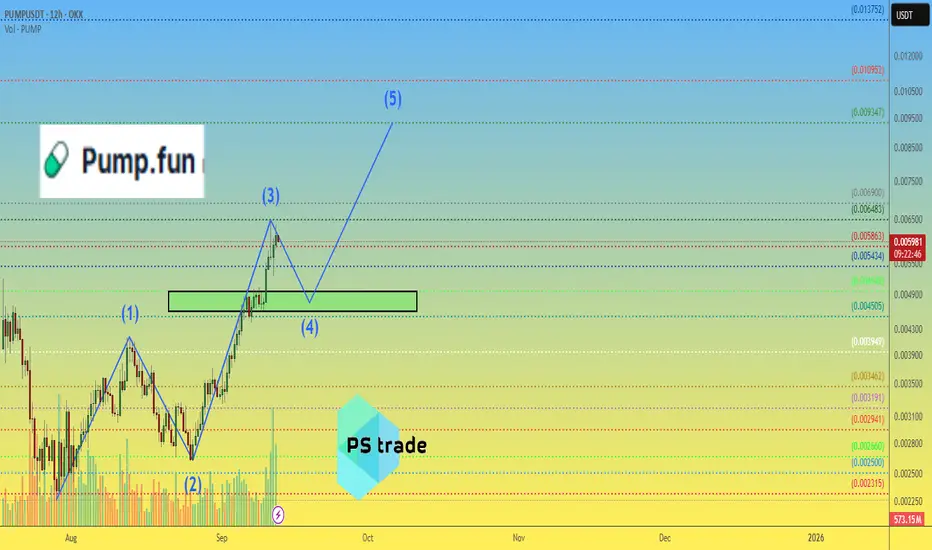
Pump

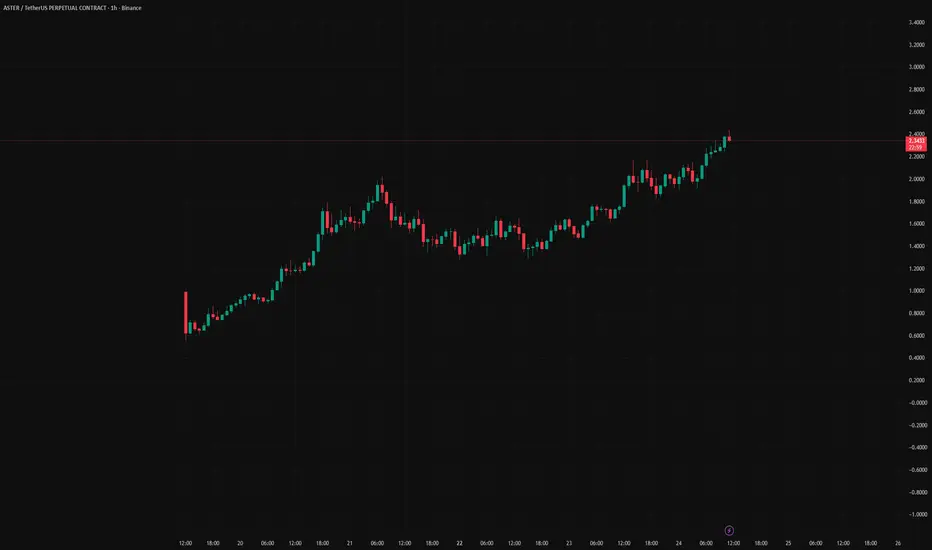
ASTER Momentum Could Push Toward $6
Aster (ASTER) has been one of the strongest performers in the market this week, rallying over 2,000% according to multiple sources. The project positions itself as a decentralized perp DEX with features like hidden orders, multi-chain support, and even on-chain stocks trading up to 100x leverage. Backing from YZi Labs, a firm associated with Binance’s founder CZ, has further fueled speculation and attracted whales.
Why I see $6 as a realistic short-term target:
Strong Momentum — Price action shows parabolic growth with high-volume confirmation. Momentum plays like this often overshoot before retracing.
Low Float & Supply Pressure — With a limited circulating supply, ASTER reacts quickly to buying pressure.
Speculative Catalysts — CEX listings (Bitunix already listed ASTER/USDT and perps) show growing traction, and traders are betting on a potential larger exchange listing.
Market Psychology — After such rapid gains, round numbers like $5 and $6 act as magnet levels, especially when retail FOMO is high.
My Trading Plan:
Entry: Pullbacks around $2.5–$3 zones (support from recent consolidation).
Target: $6 (psychological and Fibonacci extension level).
Stop-Loss: Below $2.0 (invalidate momentum structure).
Risk Factors:
Token unlocks could flood supply.
Extremely high volatility with potential 40–60% intraday swings.
Regulatory and adoption risks for perp DEXs.
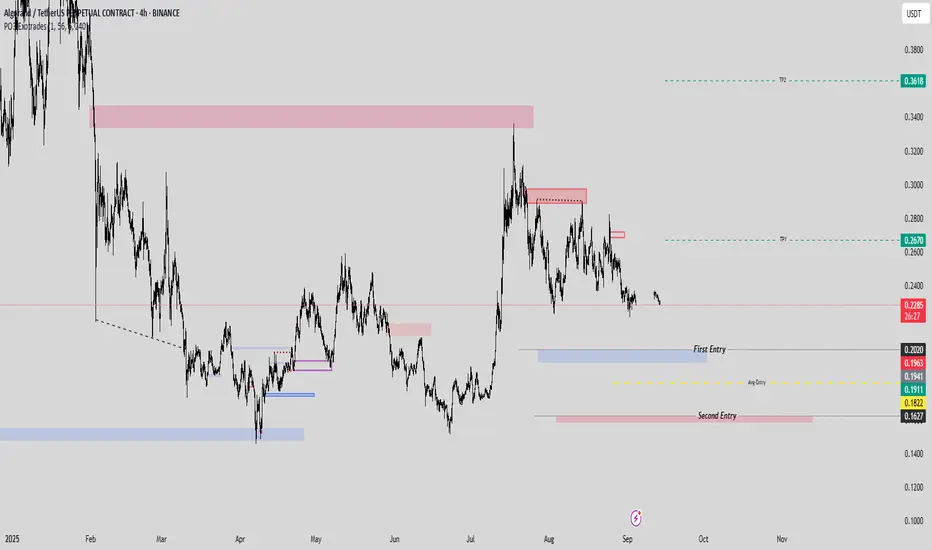
ALGO/USDT Double-Entry Precision Signal with 80% profitHere’s a strategic setup for #ALGOUSDT designed to lock in gains and eliminate downside risk through a two-tiered entry.
- Entry 1: 0.2020
- Entry 2: 0.1627 (purely to reduce overall trade risk; not a profit-seeking leg)
- TP1: 0.2670 (take 50% off the table)
- TP2: 0.1627
---
After TP1 is hit and you’ve secured half your position, shift your stop to breakeven on the remaining size. You can free-risk by moving your stop in the platform or setting a manual alert once 0.2670 is reached. This ensures the rest of the trade carries zero risk while letting profits run.
---
Note: the second entry point isn’t aimed at generating additional profit—it serves solely to widen your safety net and lower the average cost of your position. Trade smart, manage risk, and let the market work in your favor.
BINANCE:ALGOUSDT.P
#AVNT breakout on fire! Price blasted more than 50% #AVNT breakout on fire! Price blasted more than 50% in less than 24h. Unstoppable momentum is driving the rally. Buyers are flooding in with strong demand. Resistance levels are getting tested fast.
Bulls fully in control.

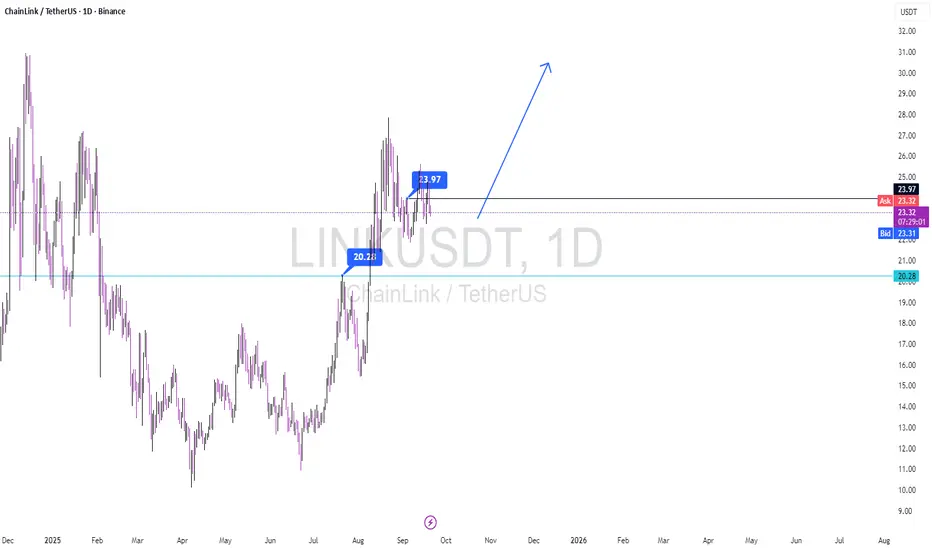
Professional Analysis: LINK/USDT (Daily Timeframe)Current Setup: LINK has successfully breached and held above the key support level of $20.28, demonstrating bullish momentum. The price action is currently consolidating in what appears to be a Bull Flag pattern, suggesting a potential continuation of the prior upward move.
Trigger & Confirmation: A decisive daily close above the pattern's resistance at $23.97 will serve as the primary buy signal according to my strategy. I am awaiting confirmation from a secondary indicator before considering this trigger fully validated.
Projection: Upon a confirmed breakout, LINK possesses a clear trajectory to target higher resistance levels on the daily chart.
Risk Management: A strict stop-loss is essential for this setup. Any move resulting in a daily close back below $20.28 would invalidate the bullish structure and signal an exit.
I will issue a formal ' SPECIAL SIGNAL ' alert once all confirmation criteria are met and the trade is officially live.
Trade Safe,
S.Reza Mehrjuyan / CEO FNS
Analyst, Manager
Pump fun update 3Alert: pump. Fun has reached the levels that were identified as a buy zone in the previous in-depth analysis. As I said before, I expect a fluctuation between $0.007/$0.0065, and then a rise to the following targets.
0.008$
0.01$
0.014$
0.019$
It's may achieve more goals than these, but I will suffice with these targets for now.

$PUMP Battle Between Buyers and SellersWill be an interesting next couple of days to watch for NYSE:PUMP
Appeared to be forming a bull pennant but that failed and lost the 9EMA.
Now is the battle between buyers and sellers at previous ATH.
Must hold this level otherwise it will print 3 Black Crowes and retest ~.006

Buyback Fuelled Rally | Can PUMP Push Another +20%?Hey everyone, today I want to dive into a project that’s been making a lot of noise — Pump fun and its token PUMP ( BINANCE:PUMPUSDT ). In the past three days, the price has jumped over +40% — is this just hype, or does it have staying power?
Let’s look into what’s driving this surge, where the risks lie, and whether there's still room to ride the wave…
Reasons behind PUMP’s recent +40% rally:
Massive Buybacks : Over $90M worth of PUMP tokens repurchased, reducing circulating supply.
Strong Revenue Growth : Daily platform revenue hit ~$3.1M, driven by rising user activity.
Live Streaming Relaunch : Attracted creators and audiences, competing with Kick & Rumble.
Exchange Listings : Wider market access and stronger liquidity.
Hype & Media Attention : Growing community engagement and whale activity boosted sentiment.
Key Risks to Watch :
Profit-Taking Pressure : Sharp corrections if hype cools down.
High Volatility : As with most memecoins, sudden swings are common.
Regulatory Uncertainty : Potential future restrictions on token-creation platforms.
Competition : Rival platforms could erode Pump fun’s growth momentum.
-------------------------------------------------------------------------
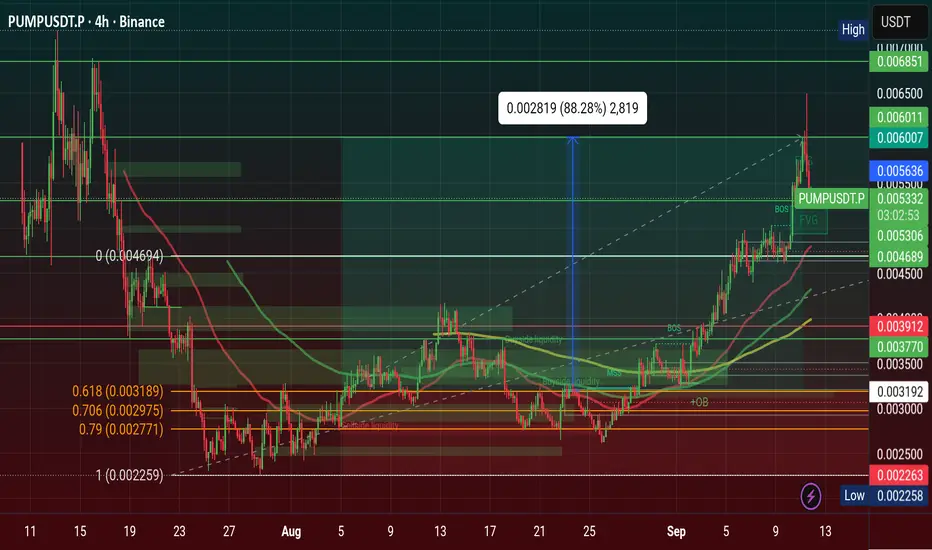
Now let's take a look at the PUMP token chart on the 4-hour time frame .
The PUMP token is currently moving inside a descending channel , near a set of Support lines and Potential Reversal Zone(PRZ) .
In terms of classical technical analysis theory, it seems that the PUMP token has the potential to form a Bullish Flag pattern .
In terms of Elliott Wave theory , it seems that the PUMP token is completing microwave 4 of the main wave 5 . The structure of microwave 4 could follow a Double Three Correction(WXY) .
I expect the PUMP token to start rising after entering the Potential Reversal Zone(PRZ) and approaching the Support lines and increase to at least $0.00876(First Target/+20%) .
Second Target: $0.00932
Cumulative Long Liquidation Leverage: $0.00749-$0.00716
Cumulative Short Liquidation Leverage: $0.010-$0.00876
Note: Stop Loss(SL): $0.006770(Worst)
Please respect each other's ideas and express them politely if you agree or disagree.
Pump fun Analyze (PUMPUSDT), 4-hour time frame.
Be sure to follow the updated ideas.
Do not forget to put a Stop loss for your positions (For every position you want to open).
Please follow your strategy and updates; this is just my Idea, and I will gladly see your ideas in this post.
Please do not forget the ✅' like '✅ button 🙏😊 & Share it with your friends; thanks, and Trade safe.

TRONJust a line I drew while I'm drinking.
TRX is forming a strong ascending structure after a long consolidation. Price has broken above the mid-level resistance and is now retesting it as support. If this level holds, we could see a breakout toward the next resistance zone around 0.4184 USDT, which is a potential 16% move from current levels.

Pump doubles from here before year endWith a billion $ in annualized revenue, pumpfun in following in the footsteps of hyperliquid as crypto's second killer app with a massive buyback flywheel. As long as daily revenue does not drop off, this narrative should pick up steam over the next few months. If the team executes it will be crypto's first successful social app into the mainsteam, succeeded where so many projects before failed.

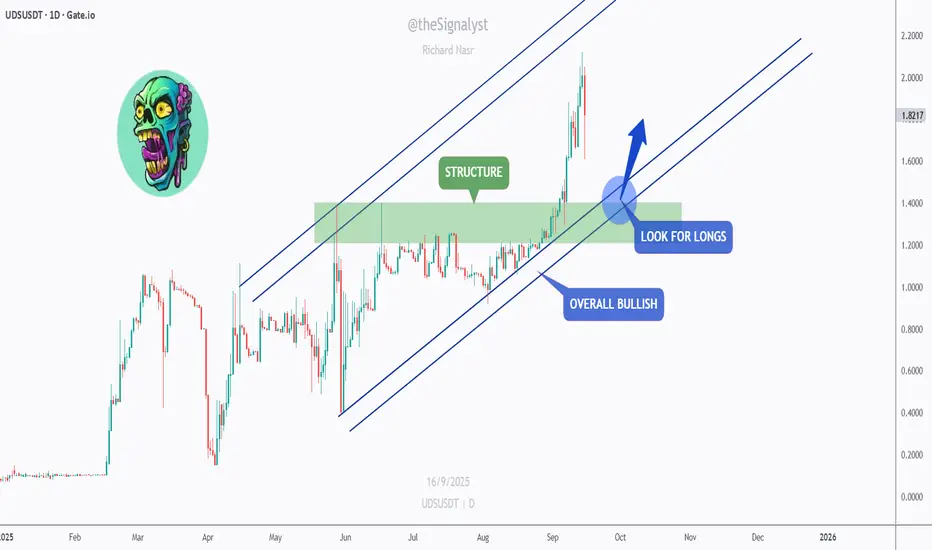
UDS – Bulls on the Move!Hello TradingView Family / Fellow Traders. This is Richard, also known as theSignalyst.
📈UDS has been overall bullish trading within the rising channel marked in blue.
This week, UDS has been retesting the lower bound of the channel.
Moreover, the green zone is a strong structure.
🏹 Thus, the highlighted blue circle is a strong area to look for buy setups as it is the intersection of the lower blue trendline and green structure.
📚 As per my trading style:
As #UDS approaches the blue circle zone, I will be looking for trend-following bullish reversal setups (like a double bottom pattern, trendline break , and so on...)
📚 Always follow your trading plan regarding entry, risk management, and trade management.
Good luck!
All Strategies Are Good; If Managed Properly!
~Richard Nasr
PUMP SOMETHING LIKE THIS!!PUMP is now in price discovery and that means the only place to look for a long trade to join the PUMP is the previous pivot lows getting swept which will show us a clear defined area to put our stop-loss.
Calculate Your Risk/Reward so you don't lose more than 1% of your account per trade.
Every day the charts provide new information. You have to adjust or get REKT.
Love it or hate it, hit that thumbs up and share your thoughts below!
This is not financial advice. This is for educational purposes only.

PUMP NOW THANK ME LATERBeen holding this gem since 0.0028, project has perfect tokenomics with team specialising on draining crypto degen-monkeys, investing profits from pump.fun platform into SPOT token buybacks, no sell-out has been started yet (and it won't be until new ATH).
So I expect at least x2 from current price range in the upcoming weeks with a rapid parabolic-like growth on the daily.
I used basic fibs to mark support/resistance levels, feel free to comment and suggest ideas/takes.
I cannot see a reason to search for any kind of any more advanced patterns because BYBIT:PUMPUSDT is just starting to grow and the trend is mostly towards new price-discovery.
pump.fun has already facilitated over 5.3M token launches since early 2024, generating nearly $800M in revenue and even pulling off a $1.3B ICO in minutes. Current market cap sits above $1.7B with daily volume regularly crossing $200M — massive liquidity for a memecoin-born project. With ~350B tokens circulating (vs. 1T max), the room for valuation expansion is still huge.
So back to 'crypto degen monkeys' - don't become one, chose your exit points cleverly and avoid high margin (I know it might be tempting).

Pfizer’s Next Big Shot: COVID Levels Back on the Table?Huge Crisis or Groundbreaking Discovery?
This scenario suggests that once the running flat correction is completed — which we are very close to — the price is set to explode by at least 300% in the coming years (see red box).
Why do I think so?
• The running correction is approaching its final target zone, meaning the price should soon stop, reverse, and start pumping.
• After the correction phase comes the impulse, and we are expecting Wave 3 — the most volatile and dynamic wave of all.
• Minimum target: $108
It’s only a matter of sooner or later.

NEAR’s Biggest Move of 2025 Incoming?NEAR has been consolidating for months, carving out a textbook accumulation phase within the broader descending channel. Each previous cycle bottom (marked in red) has acted as a launchpad, and price is once again aligning with the cycle rhythm.
As long as the $2.5 – $2.7 demand zone holds, NEAR remains well-positioned for a potential breakout. A clean push above the short-term descending structure could ignite the impulse leg toward the $5.5 – $6.5 zone, where the next projected cycle top lies.
📌 Key Takeaways:
Structure: Price is respecting the descending channel with repetitive cycle bottoms and tops.
Accumulation: Sideways action suggests smart money is loading up.
Impulse Potential: Breakout could trigger a strong rally into the next resistance zone.
Invalid Level: A daily close back below $2.5 would put the bullish scenario on hold.
Patience is key here ⏳—waiting for confirmation above structure ensures we catch the move, not the noise.
⚠️ Disclaimer: This is not financial advice. Always do your own research and manage risk properly.
📚 Always follow your trading plan regarding entry, risk management, and trade management.
Good luck!
All Strategies Are Good; If Managed Properly!
~Richard Nasr

PUMP price— Correction or another rally?If bulls manage to keep OKX:PUMPUSDT price above the $0.0046–0.00495 support range, there’s room for another x2 #PumpFun move.
Such a rally would lift market capitalization above $3 billion.
⚠️ However, the 5th Elliott wave is notoriously unpredictable and could drive price impulsively higher.
❓ Which target do you see for #PUMP? $0.01? $0.02? Or even more? Comment below.
______________
◆ Follow us ❤️ for daily crypto insights & updates!
🚀 Don’t miss out on important market moves
🧠 DYOR | This is not financial advice, just thinking out loud.
$PUMP Surprised Today $0.0064 and Finally hit $0.006, My PredictPump Price is Consolidation Now, i guess If the Prce is Breakout at ATH with Retest than My Prediction will hit $0.011-$0.022 in 2026. Pump.fun Price Jumps 42% in a Week, Bulls Eye $0.0069 Resistance
Pump.fun has been one of the most talked-about tokens this week, and for good reason. The memecoin launchpad is not only helping new tokens gain traction but also making a strong case for its own native token, PUMP.
At press time, PUMP is changing hands at $0.005814, with a daily premium of 10.52%, and an impressive 42.34% weekly jump. With a market cap of $2.06 billion and intraday trading volume soaring 89% to $500.47 million, momentum around the project is building fast.
Onchain Metrics PUMP Coin
Revenue is one of the signals of Pump.fun's current strength. According to DeFiLlama, Pump.fun generated $2.57 million in the last 24 hours, placing it right behind Hyperliquid among the top protocols. This revenue primarily comes from trading and token launch fees, which the platform keeps at a rather slim 0.05%, making it attractive for new projects.
What's pushing adoption further is the growing ecosystem impact. On September 8, MEXC listed TBCN, a Solana-based memecoin born out of Pump.fun's platform. This listing came shortly after Pump.fun launched the Glass Full Foundation in August, a liquidity injection initiative designed to support fresh projects.
These moves highlight the platform's growing role as a memecoin incubator. On the tokenomics side, Pump.fun has aggressively reduced supply through buybacks. Since July, the protocol has bought back over $30.65 million worth of PUMP, including $705,000 in a single day last month. This reduced the circulating supply by 0.76%, directly easing selling pressure from early investors and fueling the latest rally.
PUMP Price Analysis 2026
Pump Price is Consolidation Now, i guess If the Prce is Breakout at ATH with Retest than My Prediction will hit $0.011-$0.022 in 2026. Pump.fun Price Jumps 42% in a Week, Bulls Eye $0.0069 Resistance.
From a technical perspective, PUMP has been showing strength. The token reclaimed the 23.6% Fibonacci retracement level at $0.005, a critical support zone that now underpins bullish sentiment. As long as the price stays above this level, the path of least resistance points higher. Immediate resistance sits at $0.006888, a level traders are eyeing for the next breakout attempt. If PUMP clears this hurdle, bulls could push toward the $0.0075 zone, setting the stage for a run back to its all-time high of $O.01214.
Conversely, a close below $0.005 could see PUMP retest support at $0.0045. The RSI is currently at 72, suggesting the market is flirting with overbought territory, so short-term pullbacks cannot be ruled out. Still, with buybacks, listings, and revenue momentum backing the move, dips are likely to attract fresh buyers.
#Write2Earn #BinanceSquareFamily #Binance #PUMP #SUBROOFFICIAL
Disclaimer: This article is for informational purposes only and does not constitute financial advice. Always conduct your own research before making any investment decisions. Digital asset prices are subject to high market risk and price volatility. The value of your investment may go down or up, and you may not get back the amount invested. You are solely responsible for your investment decisions and Binance is not available for any losses you may incur. Past performance is not a reliable predictor of future performance. You should only invest in products you are familiar with and where you understand the risks. You should carefully consider your investment experience, financial situation, investment objectives and risk tolerance and consult an independent financial adviser prior to making any investment.
We are up 40% on $PUMP - let's go! 1 week later.... 🔥
+40% up on NYSE:PUMP , setup given on a silver platter!
Congrats if you followed team!
PUMP - Price discovery mode soon? As expected NYSE:PUMP , is gonna fly hard soon! 🚀
✅ Bullish breakout confirmed on my lines
🔥 Liquidity inflow, plus weekly token burn & buy back coming in hot!
💸 TP4 already hit for us, congrats if you jumped in around the $0.0320–$0.0330 retest area I highlighted!
🎯Upper key resistance zone: 0.0450 - 0.0470$
Momentum looks set to continue.
Who’s still holding with me? 📈

PUMP/USDT – Retest Trendline: Bullish or Bearish Continuation?🔎 Market Structure & Pattern
PUMP/USDT is showing signs of momentum shift after being trapped in a prolonged downtrend. The major descending trendline (yellow) — which has consistently acted as a dynamic resistance — has finally been broken to the upside.
This signals the potential transition from a distribution/sideways phase into an accumulation → expansion phase.
The 0.0030 – 0.0032 zone (yellow box) is now a key support area. Previously it acted as a strong resistance, but after the breakout, the zone is being retested (role reversal). How the price reacts here will determine the next major move.
---
📈 Bullish Scenario
Condition: Price holds above 0.0030–0.0032 after the breakout.
Additional confirmation: Strong 6H/Daily close above the trendline with rising volume.
Upside targets:
R1: 0.003692
R2: 0.004108
R3: 0.004459
R4: 0.005521
R5: 0.006779 – 0.006891 (previous high)
If these levels are cleared one by one, the structure will officially shift into higher highs & higher lows, confirming a trend reversal.
---
📉 Bearish Scenario
Condition: Price fails to hold above 0.0030–0.0032 and closes back below the support zone.
Additional confirmation: Strong bearish rejection at R1–R2 with patterns like bearish engulfing or shooting star.
Downside targets:
First support: 0.0028
Key structural low: 0.002254
If this happens, the current breakout will be considered a false breakout, and the long-term downtrend may continue.
---
⚖️ Conclusion
The market is currently at a critical juncture.
A confirmed hold above 0.0030–0.0032 could open the door for a rally towards 0.0044 → 0.0055 → 0.0067.
Failure to hold this support, however, may send the price back to 0.002254.
Risk management is essential — keep tight stop-losses below the support zone.
---
🚀 PUMP/USDT (6H) Trendline Breakout
Price has broken out of the major downtrend and is now retesting the 0.0030–0.0032 key support zone.
📈 If the zone holds → potential rally towards 0.003692 / 0.004108 / 0.004459 / 0.005521 / 0.006779.
📉 If the zone fails → watch for downside continuation to 0.002254.
🔥 The market is at a decisive point — watch price action closely.
(Not financial advice — always apply proper risk management.)
#PUMPUSDT #Crypto #Altcoins #Breakout #Trendline #TechnicalAnalysis #PriceAction #SwingTrade #CryptoTrading #RiskManagement

BIG PUMP COMING ON SAND!SAND is looking like a classic market cycle, ready for a strong recovery and bull run. I expect a significant pump on this coin soon. This is a prime opportunity to buy at these levels.
A huge vertical move is coming—mark my words.
As always, stay profitable.
Dalin Anderson

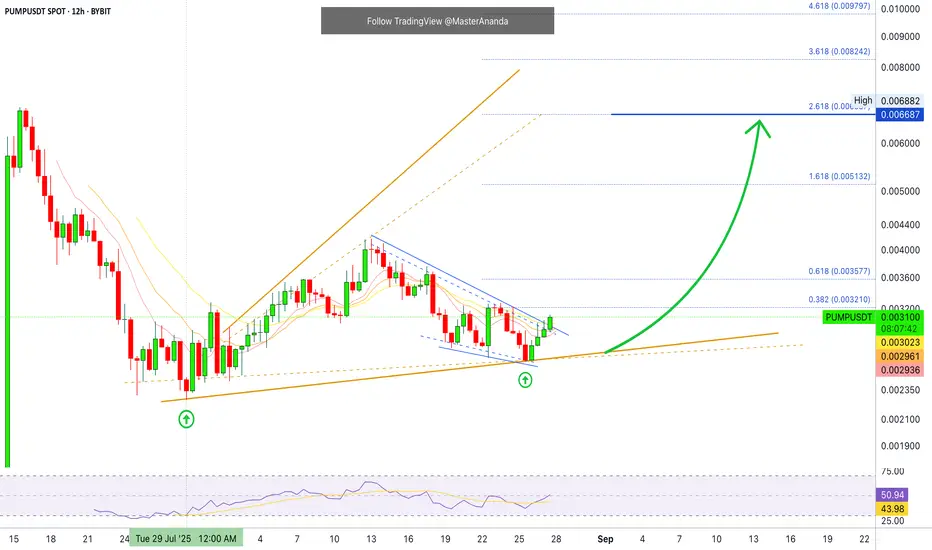
Pump.Fun · Futures Trade-NumbersPUMPUSDT and we are trying to catch the next bullish wave trading futures. We have some supporting signals for a bullish move. It is early but the market is moving ahead.
PUMPUSDT is trading just now above EMA8/13/21. We have a strong RSI and a higher low. The current bullish chart appeared after a major launch crash.
Pump.Fun started trading and went down strong. This is good, the market looks for support. There was a low 29-July followed by no new lows. Here I am seeing an early change of trend. We are already on the bullish trend, it will be confirmed with the coming higher high and for this the numbers are available below:
________
LONG PUMPUSDT
ENTRY: 0.002900 - 0.003150 (STOP: 0.002800)
TARGETS: 0.003577, 0.004171, 0.005132, 0.005726, 0.006687
________
These Futures Trade-Numbers should all hit fast, short-term. It is early in the move, only 24 hours green but we are ready to move ahead.
I will show you a chart which proves with 100% certainty the altcoins market bull market is on. It happens over and over, after each major low. When some projects break-up more than 100% in a single day...
Thank you for reading.
Namaste.
Dogecoin (DOGE) Market Update & Catalysts: Ready for 50 cents?🚀 Dogecoin (DOGE) Market Update & Catalysts
🐋 Whale Accumulation & Trading Activity
Large players (“whales”) have been steadily absorbing DOGE, fueling upward momentum. Recent market structure shows that bulls defended the $0.22 zone, while primary support and reload range sits at $0.15–$0.16 — the bottom of the accumulation range. A breakout above $0.25 could spark a run toward $0.40, especially if short positions get squeezed.
🏦 ETF Prospects & Institutional Tailwinds
Optimism is building around a potential Dogecoin Spot ETF, with growing speculation that approval could arrive in the next cycle. An ETF would open the doors for institutional capital, mirroring what happened with Bitcoin’s rally.
🔗 Expanding Utility (DogeOS & DeFi)
The development of DogeOS, which allows DOGE to interact with Ethereum DeFi ecosystems, could give the coin a major utility boost beyond its meme status. This evolution may help sustain higher valuations long-term.
📈 Technical Signals & Price Forecasts
Chart patterns are turning favorable:
Golden cross (50-day MA crossing the 200-day) shows momentum strength.
Oversold RSI signals suggest a potential reversal upward.
If support at $0.15–$0.16 holds and bulls reclaim $0.25, upside targets expand to $0.34–$0.40.
🔮 Bullish Scenarios & Analyst Sentiment
Mid-term projections highlight possible price zones:
Conservative path: $0.30–$0.33 into 2025.
Aggressive path: Retesting all-time highs near $1 if institutional demand + ETF + DeFi traction align.
🌟 Key Positive Catalysts
🔑 Catalyst 🚀 Impact
🐋 Whale absorption & accumulation Strengthens base; short squeezes possible.
🏦 Spot ETF approval potential Brings institutional demand.
📊 Technical bullish patterns Golden cross + RSI suggest uptrend.
🔗 DogeOS & DeFi integration Expands DOGE’s real-world use cases.
💬 Strong community + hype Keeps DOGE in the spotlight.
✅ Summary
Dogecoin is holding its accumulation base at $0.15–$0.16, with strong whale support and growing catalysts like ETFs and DeFi integration. If bulls can reclaim the $0.25–$0.26 zone, momentum could build toward $0.40 in the mid-term — with long-term upside scenarios eyeing $1+ if institutional and utility drivers align.
