GOLD Market Update: Pullback in Progress BUY DIPS TP 3200 USD🏆 Gold Market Update (April 1st, 2025)
📊 Technical Outlook Update
▪️Bullish OUTLOOK
▪️Broke out and set new ATH
▪️Strong UPTREND: Sequence of Higher Lows
▪️Recommend to BUY DIPS at $3,050 USD
▪️Price Target BULLS: $3,150 USD - $3,200 USD
📈 Market Performance & Price Action
🚀 Gold Hits All-Time High: Surpassed $3,100 per ounce
📊 Driven by: Geopolitical tensions and economic uncertainty
🏦 Federal Reserve Impact
🛑 Fed Keeps Interest Rates Steady: Maintained at 4.25%–4.50%
🔮 Signals: 2 rate cuts likely in 2025 due to slowing growth
📉 Lower rate outlook supports bullish gold sentiment
💹 Gold Investment Trends
📈 Gold ETFs Outperform Physical Gold
GDX (Gold Miners ETF): ↑ 32%
GLD (SPDR Gold Shares): ↑ 15.5%
📊 Investors leaning toward mining stocks & ETF exposure for higher returns
Pump

XRPUSDT.P — Is This the Beginning of the Next Pump?
BINANCE:XRPUSDT.P is bouncing back with style — and this long setup is giving off real “king of the charts” vibes. Look at that clean risk-to-reward!
Entry: 2.0905 USDT
Stop-loss: 2.0574 USDT
Take-Profit: 2.2238 USDT
R:R Ratio: 3.28
Why this setup matters:
Confirmed bounce off intraday support
Momentum shift with bullish engulfing candle
Targeting a clean resistance level for optimal exit
Tight stop, juicy upside — exactly what scalpers and day traders crave. Add to watchlist and get ready to trail that stop if momentum holds.

Tesla PushI see a valid break and retest forming with nice volume
the trade is simple
Im buying the retest of the break and im taking my trade to the breakout high
most likely im going to get 50% of the move back to the high either way im going to make cash

ALGO / USDT - Big Move AheadEvening fellas,
I got an order ready near the gap I believe its at $0.1844, it would require coming back down to the purple between both trendiness, one placed at the wick low, and the other at the body.
Maybe it moves up to resistance once again before a final shakeout.
It'll be a nice long.
Trade thirsty.

BNB/USDTBNB$ pascal hard fork today and holding well above the 200-day EMA.
_ Expect a 10%-20% pump from here.

Big pump incoming for XRPI send a signal for all to buy XRP as i said big changes is coming and the end of lawsuit with SEC had came to an end !!
XRP will hit over 3$ then passed over 5$ qnd its possible possible will hit 10$ worth of XRP.
Keep holding and dont sell

The Next Leg nas100To me this is very bullish (break and retest on lower time frames and even the 6month chart is showing a retest to the last candle close) Im looking for a 50 percent push back up on the bearish candle on the 6month chart and if we continue i will continue to hold and close partials

DOT 10x Possibility Very SoonHello once again friends,
Here's a coin that I'll long for a nice 10X from the lows.
Make sure to scoop some out, because its a solid project.
Trade thirsty!

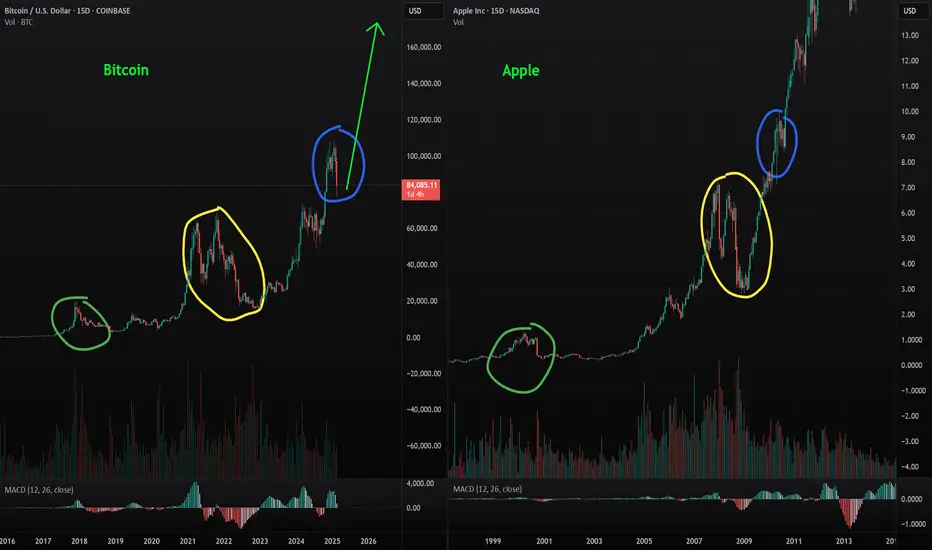
Last Leg of The Bull RunBased on historical patterns, I believe we are in the final phase of the current bull run. Analyzing previous market cycles, the peak of the 2013 bull run to the 2017 peak had a 49-month bar separation, while the 2017 to 2021 cycle exhibited a 47-month separation. Following this established “-2” pattern, the next peak is likely to occur with a 45-month separation.
Additionally, we are currently positioned within a monthly fair value gap, which could drive the market to new highs. However, I remain skeptical about the sustainability of this rally due to the impact of the U.S. crypto reserve. Institutional investors may perceive this as an opportunity for exit liquidity, aligning with the well-known market principle: "Buy the hype, sell the news."
- Gavin
do your own research
not financial advice just a speculation

POPCATUSDT is setting up for a potential long opportunity!
🚀 The price BINANCE:POPCATUSDT.P is testing a critical support level at 0.2056 USDT , and if bulls hold, we could see a strong upward push.
🔑 Key Levels:
Support:
- 0.2056 USDT – Key support, maintaining the trend.
- 0.2010 USDT – Deep liquidity zone for potential wicks.
Resistance:
- 0.2200 USDT – Short-term target for scalpers.
- 0.2774 USDT – Major resistance; breaking above could trigger a rally.
🚀 Trading Strategy:
Long Entry: On a clear bounce from 0.2056 USDT with volume confirmation.
Stop-Loss: Below 0.2010 USDT to avoid liquidity grabs.
Profit Targets:
- 0.2200 USDT – First take-profit for quick gains.
- 0.2500 USDT – Solid mid-term target.
- 0.2774 USDT – Full extension if momentum builds.
📊 Technical Outlook:
- The trend remains bullish as long as support holds.
- Increased volume at support suggests whale accumulation.
- A break below 0.2010 USDT may invalidate the bullish setup.
💡 What to Watch?
- Volume spikes = strong bullish interest.
- Retest of support with a strong bounce = long entry signal.
- Manage risk and avoid FOMO!

Bitcoin Final UpdateEverything on the charts...
Up to you now... Yes... I believe it's just Reaccumulation
Look at the previous posts for more explanation and all perspectives
I'm holding and I'm bullish...We will witness an alt season this year (those saying we won't will be proven wrong...)
BTC.D will fall and strong alts will rise (with massive returns)
Until Next Time...

Don't lose sight of what is about to happen with Bitcoin.Bitcoin will blow investors away. Be ready for an expansion that most investors are simply not anticipating. This growth could be massive. Please don't lose sight of what’s coming.
Stay profitable.
– Dalin Anderson
BTCUSD: Fvg to be FIlled?Hello. Relatively new in the BTC field, any feedback will be appreciated.
As seen on my chart, im expecting price to come back and fill a FVG formed on a recent dump. Seems that we have a somewhat decent bullish trend.
My entry is based on liquidity, currently set at 96206, but I am aware we might see a stop hunt slightly below.
First TP was set on a possible liq sweep reversal point since market does not really have a strong direction as of now, and Second TP is at the fvg start point.
SL is set right below a lower high to avoid getting stopped from a stop hunt, if it reaches said point.
Please, let me see your thoughts and if possible, to get feedback and learn more together:)

SHIB1000USDT: Reversal or Breakdown?
📉 BYBIT:SHIB1000USDT.P is currently trading at a critical support zone around 0.019900 USDT . After multiple tests of this level, buyers are stepping in, but is it enough to trigger a rally?
---
🔑 Key Levels:
Support:
0.018347 USDT — the last support level, a breakdown here could lead to further downside.
0.019825 USDT — current liquidity accumulation area.
Resistance:
0.022000 USDT — the first target in case of a bounce.
0.026403 USDT — a liquidity zone that could act as a magnet if the price breaks through local resistances.
---
🚩 Trading Strategy:
Entry Point:
- Consider a long position if 0.019825 USDT holds with increasing volume.
Stop-Loss:
- Below 0.018347 USDT to minimize risks in case of a breakdown.
Take-Profit Targets:
0.022000 USDT — first target for partial profit-taking.
0.026403 USDT — potential target if a bullish impulse kicks in.
---
📈 Technical Analysis:
The price is testing a support level with repeated buyer reactions.
A breakout could trigger a recovery phase with potential movement towards 0.026403 USDT.
If the support fails, a drop to 0.018347 USDT is likely.
---
💡 Conclusion:
The price is at a crossroads: a bounce could yield great profits, but a breakdown could spell trouble. Stay alert! What’s your take? Waiting for a retest or already in? Let’s discuss in the comments! 🚀

CHoCH (Change of Character) in Crypto TradingWhat is CHoCH?
CHoCH (Change of Character) is a concept from Smart Money Concept (SMC) used in technical analysis. It signals a shift in market behavior and often marks the beginning of a new trend phase, whether a trend reversal or consolidation.
Unlike Break of Structure (BoS), which confirms trend continuation, CHoCH indicates a potential change in direction.
---
How to Identify CHoCH?
1. In an Uptrend:
Price forms Higher Highs (HH) and Higher Lows (HL).
If the price breaks the last HL but fails to create a new HH, this is CHoCH, signaling a potential bearish reversal.
2. In a Downtrend:
Price forms Lower Lows (LL) and Lower Highs (LH).
If the price breaks the last LH but does not form a new LL, this is CHoCH, suggesting a bullish reversal.
---
How to Trade CHoCH?
CHoCH is a powerful tool for spotting trend weakness and entering trades early.
1. Spotting Trend Weakness:
In an uptrend, if the price fails to make a new HH and breaks the last HL, a trend shift might be occurring.
In a downtrend, if the price fails to form a new LL and breaks the last LH, expect bullish momentum.
2. Entry Strategies After CHoCH:
Wait for confirmation with a retest of the key level.
Use volume indicators to check if the breakout is significant.
Enter the trade after the retest of the broken support/resistance level.
3. Combining CHoCH with Other Tools:
CHoCH works well with Order Blocks, Liquidity Zones, and Fair Value Gaps (FVG).
Volume analysis helps confirm institutional activity in the trend change.
---
CHoCH Trading Example
Imagine an uptrend where price forms Higher Highs (HH) and Higher Lows (HL). Suddenly, the price fails to create a new HH and breaks the last HL. This is CHoCH, suggesting a potential shift from bullish to bearish.
💡 Traders can use this signal to exit long positions and prepare for short setups.

TURBOUSDT: Breakout Incoming or Another Fakeout?
Hey traders! Today we’re watching BINANCE:TURBOUSDT.P The price is consolidating around 0.0084450 USDT , testing a key resistance level. We’re seeing a classic ascending triangle forming — a textbook pattern before a big move. Will we see a breakout, or is this just another fakeout?
---
🔑 Key Levels:
Support:
0.0082000 USDT — a key level where buyers could step in again.
0.0080000 USDT — the last line of defense before a potential drop.
Resistance:
0.0087261 USDT — the first barrier keeping price in check.
0.0087928 USDT — the final line before a potential surge.
---
🚩 Trading Strategy:
Entry Point:
- Long entry on a confirmed breakout above 0.0087261 USDT with volume confirmation.
Stop-Loss:
- Place a stop below 0.0082000 USDT to avoid unnecessary drawdowns.
Take-Profit Targets:
0.0087928 USDT — the first level to lock in some profits.
0.0090000 USDT — a target in case of a strong impulse.
---
📈 Technical Analysis:
An ascending triangle is forming, signaling potential accumulation.
Increasing volume near resistance indicates strong buyer interest.
If the breakout fails, we may see a retest of support before another attempt.
---
💡 Conclusion:
This setup looks promising, but confirmation is key. What do you think? Seeing order book liquidity or potential rejection signs? Let’s discuss in the comments!

NEIROUSDT: Is the Market Ready for a Breakout?
Hello, traders! Today we’re analyzing $NEIROUSDT. The chart is showing an upward trend with key resistance at 0.0008378 USDT . The current price sits at 0.0008189 USDT , and the market appears poised for a move. Will it be a pump, or are we in for a pullback?
---
🔑 Key Levels:
Support:
0.0008100 USDT — a zone where buyers may hold the market steady.
0.0007800 USDT — a backup support level in case of a dip.
Resistance:
0.0008378 USDT — the critical level that must break for continued growth.
0.0008700 USDT — a profit-taking target after the breakout.
---
🚩 Trading Strategy:
Entry Point:
- Consider going long after a confirmed breakout above 0.0008378 USDT with volume confirmation.
Stop-Loss:
- Place your stop below 0.0008100 USDT to minimize risk.
Take-Profit Targets:
0.0008500 USDT — the first target for partial profit-taking.
0.0008700 USDT — the final target for this move.
---
📈 Technical Analysis:
The upward trend signals increasing buyer interest.
Volumes are gradually increasing, confirming bullish intentions.
If the price consolidates above 0.0008378 USDT , it could trigger a significant impulse.
---
💡 Conclusion:
The NEIROUSDT market is at a critical decision point. Will buyers maintain control, or are we heading for a pullback? Share your thoughts in the comments and keep an eye on key levels!

ETHUSDT: Attempting a Recovery After the Dump
Hey, traders! Today, we’re focusing on $ETHUSDT. The price is trying to recover after a sharp dump, currently sitting at 3,345.52 USDT . We see a support level at 3,308.46 USDT , which has held up under pressure, but its retention remains critical.
---
🔑 Key Levels:
Support:
3,308.46 USDT — the key zone where buyers might keep the market steady.
3,302.52 USDT — an additional defense level in case of renewed pressure.
Resistance:
3,360.00 USDT — the nearest target to test the bulls' strength.
3,400.00 USDT — a zone for partial profit-taking if the upward momentum continues.
---
🚩 Trading Strategy:
Entry Point:
- Consider a long position after confirming the support at 3,308.46 USDT and observing a bullish impulse.
Stop-Loss:
- Place your stop below 3,302.52 USDT to minimize risks.
Take-Profit Targets:
3,360.00 USDT — the first profit-taking point.
3,400.00 USDT — the final target for this upward move.
---
📈 Technical Analysis:
The sharp volume dump indicates a liquidity grab attempt.
If bulls can hold the 3,308.46 USDT level, recovery toward resistance is possible.
It’s important to monitor volume and price reaction at key levels.
---
💡 Conclusion:
Ethereum is clearly attempting to recover after a strong dump, but buyers must hold support. Will the market manage to reclaim lost ground? Share your thoughts in the comments!

GMTUSDT: Breakout or Pullback? Long Position Ready to LaunchHey, traders! 🐂
Today, BINANCE:GMTUSDT is in the spotlight. The price is holding at 0.16123 USDT , and the chart is forming an ascending triangle — one of the most popular bullish patterns. Resistance at 0.16425 USDT has been tested multiple times, but bears are still holding the line. Will it break through, or should we expect a pullback?
---
🔑 Key Levels:
Support:
0.16330 USDT – the nearest point for a retest.
0.16000 USDT – the main line of defense for buyers.
Resistance:
0.16425 USDT – the current zone that needs to be breached.
0.16643 USDT – the first target after a breakout.
0.16986 USDT – the final target for the long position.
---
🚩 Trading Strategy:
Entry Point:
- Consider going long after a confident breakout above 0.16425 USDT , confirmed by volume.
Stop-Loss:
- Place your stop below 0.16100 USDT to minimize risks.
Take-Profit Targets:
0.16643 USDT – the first target where partial profits can be taken.
0.16986 USDT – the final target if the momentum continues.
---
📈 Technical Analysis:
The ascending triangle signals growing strength among buyers.
Volume is increasing near the resistance zone, confirming bullish activity.
A retest of 0.16425 USDT before the breakout presents an excellent entry opportunity.
---
💡 What to Expect?
If the 0.16425 USDT level is broken, we have every chance of seeing a strong upward move. However, if bears maintain their resistance, a pullback to support at 0.16000 USDT is likely. What’s your take? Share your ideas — collective wisdom always wins! 🚀

SUI 6th try was perfect trade6th try was spot on for SUI
As mentioned in my previous post SUI was testing the highs for the 6th time. Sooner or later one of these tests should make it. Most of the time i check them from the 4th on. Every try after has a higher probabillity for succes if the older test failed.
SUI mad a clean breaktrough and retested the line of resistance making it support. Volume is good but we can also see that the bear volume is rather high in the red candles.
Due to the new ATH there will be more and more people taking proffits at certain levels of the fibonacci trend for example.
DYOR and take proffits along the way or move the Stop loss towards lows that should not break anymore.
Next lever should be between $5,24 and $ 5,34 because that is where the next liquidity is hiding.

Arb Analysis BINANCE:ARBUSDT BINANCE:ARBUSDT.P MEXC:ARBUSDT
Here’s a detailed analysis of the ARB/USDT (Arbitrum/USD Tether) weekly chart, including Fibonacci retracement levels, support and resistance zones, and possible price movements.
---
### **1. Key Levels**
- **0% (low)**: **0.4224**.
- **0.618 Levels**: **1.1879** and **1.1238—Fibonacci's golden pocket area, representing a strong resistance zone.
- **0.5 Level**: **1.4244—the midpoint of Fibonacci retracement, acting as a secondary resistance level.
100% (High)**: **2.4263**.
---
### **2. Price Action and Current Situation**
Current Price**: **0.8310**, sitting near a support zone.
Support Zone**: **0.812**, where price has found stability so far.
Key Resistance**: Fibonacci levels between **1.1238–1.1879**.
---
### **3. Support and Resistance Zones**
- **Support**:
-0.812: Current support level holding the price.
- **0.4224**: Strong historical support, acting as the last defense if the price drops significantly.
- **Resistance**:
1.1238–1.1879: The golden pocket zone (strong resistance where a pullback or slowdown may occur).
1.4244: Secondary resistance at the 0.5 Fibonacci level.
---
### **4. Fibonacci-Based Trading Strategy**
Buying Opportunity (Buy)**:
Consider entering near the **0.812** level if support holds.
Stop-loss: Place below **0.812**, such as at **0.750**, to limit losses.
- **Take-Profit Targets**:
First target: **1.1238–1.1879** zone.
Second target: **1.4244** level.
---
### **5. Technical Analysis and Possible Scenarios**
Bullish Scenario (Upward Movement)**:
If the price holds above **0.812**, the next move could be toward the **1.1238–1.1879** resistance zone.
A break above this zone could push the price to $**1.4244** or higher.
Bearish Scenario (Downward Movement)**:
If the price breaks below **0.812**, it might revisit the **0.4224** support level.
---
### **6. Trading Recommendations**
Current Buying Opportunity**:
Buying near **0.812** can be a good entry, considering clear stop-loss and take-profit levels.
- **Confirmations**:
RSI: Check if the price is oversold or overbought to validate the entry.
MACD: Use to confirm trend strength or weakness.

Dot Target why 20$ KUCOIN:DOTUSDT BINANCE:DOTUSDT BINANCE:DOTUSDT.P CRYPTOCAP:DOT
---
### **1. Fibonacci Retracement Analysis**
- **Levels Observed**:
- **0% (High)**: **55.081** (all-time high or recent significant high).
- **0.236**: **42.594**.
- **0.5**: **28.625** (midpoint of retracement).
- **0.618**: **22.381**.
- **0.65**: **20.688** (golden pocket).
- **0.786**: **13.491**.
- **1.0 (Low)**: **2.168** (all-time low or recent significant low).
---
### **2. Current Price**
- The price is currently around **7.790**, significantly lower than the golden pocket (0.618–0.65) and closer to the lower Fibonacci levels.
---
### **3. Take-Profit Level at $20**
- **Why $20?**
- **Golden Pocket Zone**: The **0.618–0.65 Fibonacci zone** is considered a high-probability reversal area. Many traders set their take-profit just below this zone to ensure profit capture before significant resistance is encountered.
- **Psychological Level**: The $20 price point serves as a psychological resistance, where many traders might exit, amplifying sell pressure.
- **Confluence with Historical Data**: Previous price action near this level likely showed significant resistance/support, aligning with Fibonacci levels.
---
### **4. Resistance and Support Zones**
- **Major Resistance Levels**:
- **22.381–20.688**: The golden pocket and primary target zone.
- **28.625**: Midpoint retracement, another key resistance level.
- **Support Levels**:
- **13.491**: **0.786 Fibonacci level**, which may act as a strong base for further upward momentum.
- **2.168**: All-time low or significant recent low.
---
### **5. Potential Price Scenarios**
- **Bullish Case**:
- If the price breaks through **13.491**, it could rally toward the golden pocket zone near **20.688–22.381**.
- A breakout beyond **22.381** could extend the rally toward **28.625** or even higher.
- **Bearish Case**:
- If the price fails to hold **13.491**, it may revisit lower levels, potentially near the all-time low of **2.168**.
---
### **6. Strategy and Recommendations**
- **Entry Point**:
- Current prices near **7.790** are ideal if the upward trend continues.
- **Take-Profit**:
- The take-profit at **$20** is conservative and aligns with the golden pocket zone.
- **Stop-Loss**:
- Set below **13.491** to minimize losses if the trend reverses.
---
### **7. Market Psychology**
- Many traders use Fibonacci retracement levels to define take-profits. The golden pocket is a popular area where selling pressure increases, causing potential reversals.

PEOPLEUSDT Loaded for a Breakout: Go Long or Wait for a Retest?
Hey, traders! 🐂🐻
Today’s radar is on BINANCE:PEOPLEUSDT , and the market is definitely "buzzing". The price is sitting at 0.04588 USDT, and we’ve seen it knock on the resistance at 0.04689 USDT a couple of times. What is that level? A wall of liquidity! Whales are clearly capping the price.
Now, let’s get to business. The chart is forming an ascending triangle – a classic setup. If the price breaks through the liquidity up top, we’re in for a pump. But as they say, "don’t go all in until you see a clean breakout."
🔑 Key Levels:
Support: 0.04300 USDT – buyers are stacked here. If this level breaks, get ready for a dump.
0.04100 USDT – the bulls’ last stand. Reaching here puts the trend at risk.
Resistance: 0.04689 USDT – the critical level. Break it, and we’re flying; fail, and the whales keep pushing us down.
0.04900 USDT – the first target to "skim the cream".
0.05050 USDT – the ultimate target if the market picks up speed.
🚩 Strategy:
Entry Point:
Enter long after a clean breakout above 0.04689 USDT (let the volume confirm it).
Stop-Loss:
Place stops below 0.04300 USDT to avoid "liquidity grabs".
Take-Profit Targets:
0.04800 USDT – lock in some gains to avoid FOMO.
0.04900 USDT – for those who like "cold, calculated moves".
0.05050 USDT – the final stop when the market gives everything it can.
📈 Technical Breakdown:
The triangle is screaming: the market is gearing up for a move.
Rising volumes – a signal that buyers are revving up.
A retest of 0.04689 USDT before the breakout is a great chance for scalpers or those "hunting setups."
💡 What’s next?
The big question: are we catching a pump, or will it fizzle out? If 0.04689 USDT doesn’t break, expect bulls to pull the plug ("handbrake") and possibly some tilt for those who entered too early.
Your thoughts? Maybe someone spots a sell wall or a divergence on the indicators? Share your observations – the collective mind wins, as they say. 🚀
