QCOM Prediction using Fixed Range Vol w/ S&RSo - I've been playing a new tool (to me it is), the 'Fixed Range Vol' I only recently realized is available in TradingView's arsenal.
I'm not exactly sure if I am using the correct way that it's intended to be used but so far, it's been a pretty reliable tool for my chart analysis attempts.
1.) I start by selecting the HH's and LL's on a higher time chart, let's say for example either the D or 4H and then again on a smaller time frame, let's say 4H or 1H and then again on the same or similar time frame as the last except this time I'd select points that are relevant to the symbols last noticeable trend movement.
2.) Then I would correlate the outcomes from those Fixed Range results withthe Supply & Demand areas generated from the indicator 'FluedTrades-SMC Lite' .
More times than not - there is a fairly clear pattern or indication as to what the chart's next movements might be. So far - I've actually been quite surprised with the number of times this unusual method I somehow started using has been correct.
Or is this a commonly used strategy that I just don't/didn't know of?
QCOM

NVIDIA - A Scenario Few Are Considering. Few. Few. Few.NVIDIA's price action last week was a historic event in the markets, and at a very strange time. Whenever you see such an outlier, it's time to perk up and really give a deep think to what's going on in the world at large.
For me, I had long since anticipated NVIDIA would print a new ATH, but I did not believe it would do it until the markets at large had started to moon, which I stated in a March call, which turned out to be pretty accurate.
NVDIA - Expect Sideways Until Bear Puts Expire Worthless
The fact that a megacap could take out the November of 2021 highs before the Fed started hiking is extremely indicative of what's going on, namely that the indexes and the market at large are sure to follow.
I've heard some pretty good theories that NVIDIA being able to do what it's done has a lot to do with Chinese Communist Party entities running a "boomerang" through Cayman Islands-based proxies that are shuffling liquidity through big enterprises like the US banks located in Hong Kong.
NVIDIA also reportedly relies on Taiwan-based TSMC to make its processors, and right now, Taiwan is the springboard for the western globalist interests to attempt to take control of Mainland China when the CCP collapses in the upcoming future.
The Party has recently stated that the mainland is scheduled to get hit up by 60 million new cases ***per week*** of the nouveau variant of the Omicron version of the Wuhan-originating Coronavirus Disease, and yet the Communist Party is not reporting any hard figures on case counts and death through the global faucets, and has not since Xi dropped the Zero COVID social credit scheme in January.
And on top of that is the soon-to-be 24 year long persecution of Falun Dafa by Jiang Zemin and its Shanghai faction combining with the CCP itself, a persecution that targeted 100 million people and committed the unprecedented sin of live organ harvesting.
The sin of the persecution is so enormous that once brought into the public eye, no matter who you are in this world, you'll be brought down as retribution for evil.
So there's a lot to watch out for in geopolitical tensions, and a lot at play. The biggest thing right now is that the markets are set to pump to provide people with a new distraction as they try, once again, to get rich, and quick, instead of paying attention to what is important in life.
Everyone is now convinced that NVIDIA is unshortable, and some are even looking for a mild pullback to go long on the "parabolic trend line."
Frankly speaking, there's a lot of risk in buying ATHs when you're dealing with something governed by a clever MM, and if the Q2 ER scam doesn't convince you that NVIDIA's MM is clever, "Sorry, I don't have time to explain it to you."
In making this call, I would like to say that NVIDIA going parabolic is pretty likely.
I'd also like to say that some formation like this, which we saw on Sun Microsystems in the Dotcom bubble, is also pretty likely:
If the Sun fractal is valid, then this call is invalid. How it would play out is kind of like what Boeing did in 2018-19:
Or what BTC CME Futures has already done
Meaning that shorting will remain extremely risky, but going long won't necessarily have any opportunities to meaningfully pay.
However, if the MMS are intending to conduct a turtle soup into a three drives/three Indians pattern, you do actually have the opportunity to Shortgod the top, get long at the bottom, and collect an even bigger trade.
What this would involve is that starting in June NVDIA begins to retrace, and if it were to be so, it would likely retrace with a consistency that is as good as selling volatility has been in the last 9 months.
It would refill the May gap completely, and rebalance the unbalanced March gap, which coincides with the recent market structure's range equilibrium at $250 and the week of April 24's pivot.
Many have said that the debt ceiling crisis being resolved by the Federal government often results in a stock market crash since the market has to absorb all the new TBonds that the Treasury has to issue to keep the government afloat.
If you couple that with how the market didn't go down at all during the debt ceiling crisis itself, a bear impulse appears more and more likely.
If it were to do this, NVIDIA would also never print a $1 trillion market capitalization despite being so close.
NVDIA likely would quickly bounce at this point and then the target would be one standard deviation above the May high, coming in at $540, which would also take the psychological $500 level.
Doing this will encourage and trap bears all the way down, and then slaughter bulls over $500. Doing this will slaughter the bulls that have already bought the top, and at present, the bears have literally all been killed.
Projected time frame for this to happen would be something like a September bottom and the top would come in the middle of '24 with the next U.S. Presidential Election on the horizon.
Of course, that assumes that the world remains in good enough shape to be stable in any way a year from now.
I do not have conviction that this will be the case it will play out, but I wanted to post this theory because the timing, logic, and price action all support it strongly, and it's the one scenario that nobody is considering, which also happens to generate a lot of alpha if you can get on top of it.

QCOM Expecting QCOM to continue much higher in the coming months. Basic breakout continuation play. Lagging behind the rest of it's sector and ready to pop.

QCOM LongJust a decent risk/reward trade here on QCOM. Good company that will be around for a long time. I'm going to give it a shot.

QCOM - Rising Trend Channel [MID TERM]🔹QCOM shows weak development in a falling trend channel in the medium long term.
🔹QCOM has broken a resistance level in the short term and given a positive signal for the short-term trading range.
🔹QCOM is approaching's resistance at 120, which may give a negative reaction.
🔹Overall assessed as technically negative for the medium long term.
Chart Pattern;
🔹DT - Double Top | BEARISH | 🔴
🔹DB - Double Bottom | BULLISH | 🟢
🔹HNS - Head & Shoulder | BEARISH | 🔴
🔹REC - Rectangle | 🔵
🔹iHNS - inverse head & Shoulder | BULLISH | 🟢
Verify it first and believe later.
WavePoint ❤️

Is the bullish run on tech stocks done? check out QCOMAfter taking out the October and November lows, QCOM has surged to activate a Fake Break Down reversal pattern, as well as an odd looking island reversal pattern, leaving behind almost the entire month of May's trading days. It might need a breather here as it runs into some short term resistance, but I'm long.... 🤷♂️

2000 vs 2020 Tech crashesQCOM was the hottest stock of 1999, and had a similar fall from grace as the biggest tech names of the time, if not faster. Some of the top tech stocks by market cap were: MSFT, CSCO, INTC & IBM
I believe in a 2-3 year bear market, but we are pretty close to 2000 levels in a lot of major Tech stocks already. A lot of people wanna sell it to the floor as fast as possible, but that's not what the bear market really looks like. It's the white box.

FOMC Summary | QQQ & SPY Analysis | KRE & PACW Bust | QCOM ER- FOMC Summary: 0.25bps hike today, Powell saying no cuts this year may made the market a bit red but he said that last time too. I personally think it was because market participants this time wanting to hear a pause due to it being so price in but he didnt say any of that so market went down.
- QQQ bounce off of Key support yesterday but broke below today
- NASDAQ:QQQ and AMEX:SPY both below 12 EMA
- NASDAQ:PACW NEWS wanting to sell its entire bank AH, causing market to drop
- NASDAQ:QCOM ER saying lower demand on phones made NASDAQ:AAPL drop

Qualcomm stock and best entry pointsI will be intereseted to aquire this stock if it reaches 55-70 level or less.Not before that. What do you think?


Qualcomm Inc (Long)Qualcomm Inc
Long
Entry at 131.03
Take Profit at 142 (8.32% profit from entry)
Stop loss at 125

In a sea of red there still some bulls standing Just talking walk down wall street AKA the HeatMap looking at a sea of red I notice a small pace of green as i zoomed in long behold it was QCOM as i started my top down analysis i seen it was breaking its down trend as i made my way to the daily chart i stumbled upon a Cup & Handle at the neckline looking ready to take off any moment with a measured move of 17 points if it fully play out so that's a very juicy target for trades to pass up !!!!

Qualcomm play . Hi,
Definitely risky one.
As you can see very wacky chart and price move . over all shooting for 107 area.
Playing this one short by end of the day based on news .
Martch 17 . 100 Puts .

QCOM daily pinnacle pattern consolidationOrder BUY QCOM NASDAQ.NMS Stop 116.64 LMT 116.64 will be automatically canceled at 20230401 01:00:00 EST
QCOM daily pinnacle pattern if we break above can expect C wave ABC correction up.


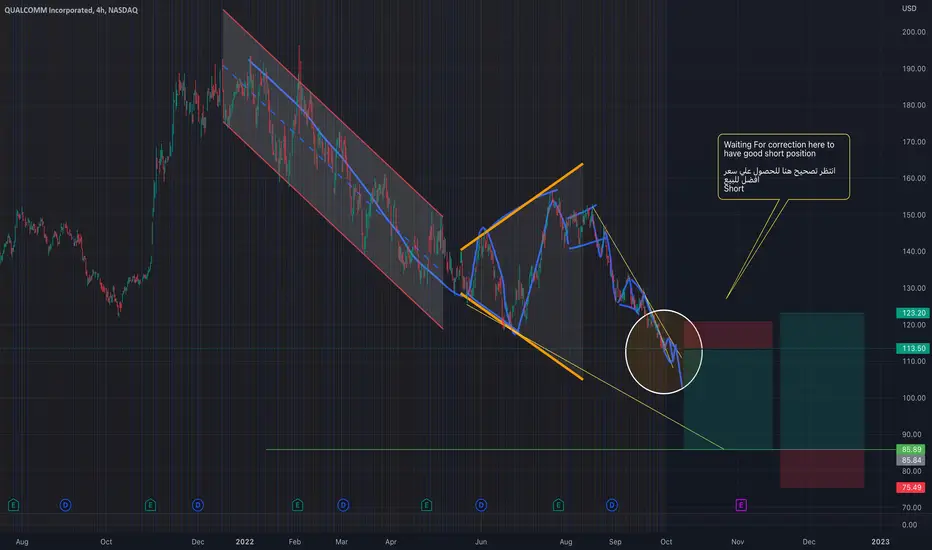
QCOM Head and shoulders patternhello,
QCOM
I see Head and shoulders pattern with target around $85, also Waves analysis there is we are in correction (daily) with target about $85 also, I will wait good price may be (117) to short
not financial advice DYOR
Bullish on Qualcomm. QCOMBetting on in the position of the B Wave in this pretty epic zigzag. Taking retrace of ?B of B for targets of C. C's within triangle tend to be the largest of the lot, so a chance we may come back to this idea and extend the goals to hyperextension incase of an epic C at a later stage.
We are not in the business of getting every prediction right, no one ever does and that is not the aim of the game. The Fibonacci targets are highlighted in purple with invalidation in red. Confirmation level, where relevant, is a pink dotted, finite line. Fibonacci goals, it is prudent to suggest, are nothing more than mere fractally evident and therefore statistically likely levels that the market will go to. Having said that, the market will always do what it wants and always has a mind of its own. Therefore, none of this is financial advice, so do your own research and rely only on your own analysis. Trading is a true one man sport. Good luck out there and stay safe.

8/17/22 QCOMQUALCOMM Incorporated ( NASDAQ:QCOM )
Sector: Electric Technology (Telecommunications Equipment)
Market Capitalization: $166.799B
Current Price: $148.53
Breakout price trigger: $151.35
Buy Zone (Top/Bottom Range): $146.80-$141.25
Price Target: $164.20-$165.30
Estimated Duration to Target: 32-35d
Contract of Interest: $QCOM 9/16/22 150c
Trade price as of publish date: $4.75/contract

Qualcomm: Things are looking bullish!Qualcomm
Short Term
We look to Buy at 143.04 (stop at 138.51)
Preferred trade is to buy on dips. Buying continued from the 38.2% pullback level of 141.98. 20 1day EMA is at 143.50. Posted a Bullish Hammer Bottom on the Daily chart. We look for gains to be extended today.
Our profit targets will be 156.56 and 159.40
Resistance: 156.60 / 160.00 / 190.00
Support: 141.00 / 120.00 / 100.00
Disclaimer – Saxo Bank Group. Please be reminded – you alone are responsible for your trading – both gains and losses. There is a very high degree of risk involved in trading. The technical analysis, like any and all indicators, strategies, columns, articles and other features accessible on/though this site (including those from Signal Centre) are for informational purposes only and should not be construed as investment advice by you. Such technical analysis are believed to be obtained from sources believed to be reliable, but not warrant their respective completeness or accuracy, or warrant any results from the use of the information. Your use of the technical analysis, as would also your use of any and all mentioned indicators, strategies, columns, articles and all other features, is entirely at your own risk and it is your sole responsibility to evaluate the accuracy, completeness and usefulness (including suitability) of the information. You should assess the risk of any trade with your financial adviser and make your own independent decision(s) regarding any tradable products which may be the subject matter of the technical analysis or any of the said indicators, strategies, columns, articles and all other features.
Please also be reminded that if despite the above, any of the said technical analysis (or any of the said indicators, strategies, columns, articles and other features accessible on/through this site) is found to be advisory or a recommendation; and not merely informational in nature, the same is in any event provided with the intention of being for general circulation and availability only. As such it is not intended to and does not form part of any offer or recommendation directed at you specifically, or have any regard to the investment objectives, financial situation or needs of yourself or any other specific person. Before committing to a trade or investment therefore, please seek advice from a financial or other professional adviser regarding the suitability of the product for you and (where available) read the relevant product offer/description documents, including the risk disclosures. If you do not wish to seek such financial advice, please still exercise your mind and consider carefully whether the product is suitable for you because you alone remain responsible for your trading – both gains and losses.

QCOM Long IdeaQcom just broke above a zone and as of now is retesting and holding the zone. First pt is the dashed line final pt is the next zone proceeding the first pt

QCOM SELLQCOM is an established downward trend with several overbought or reversing indicators from Stochastic, CCI, bollinger bands, long term support, Fibonacci, williams percentage, at cloud resistance, top of downward channel. We are nearing a wedge formation to break out or break down, I'm guessing the latter will occur. No position yet

Long | QCOMNASDAQ:QCOM
Possible Scenario: Long
Evidence: Price Action
TP1: 136$
TP2: 139$
This is my idea and could be wrong 100%. do your own DD.

piling up bad news on semi conductor industryAMD is on a really important zone here. if this breaks, its going to be a disaster for it. we can see 59-60. most of the semi conductor names like AMAT, NVDA or just semi etf SMH are pretty close to 200 weekly moving range. we might see it next week.
MU reported ok numbers for this quarter but their guidance is awful.
• They slashed EPS by 40% and REV by 20% in guidance.
• Operating margins of this quarter are inline but they guided way lower operating margins for next quarter which shows the pressure on their raw materials
and inventory side.
• Operating cash flows for this and next quarter are also a miss but thats not surprising considering their margins going down.
• Also, CEO on call said the demand is weaker for semi’s right now which probably is why semi’s have been getting hit in the last week or so.
The biggest issue i see on MU’s ER is declining mobile sales. They have had y/y declining sales and this might spill over to big names like APPL, QCOM, QRVO and also ad spend companies like APPS, TTD.
If a new leg down starts in the market, chip manufacturers and mobile makers, ad spend and 5G network companies should be on watch.
Also, the demand weakening comment should put a lot of pressure on NVDA and AMD as there will be doubts about them being able to fulfill their guidance with weakening demand. Especially AMD guided way higher last quarter.
TSM put out news friday that majority of their big suppliers are scaling down their chip orders for rest of 2022. this consists of AMD NVDA AAPL cutting from 5-12% of their chips.
please note that this post is not for monday trading, it is intended in general for the next 3-4 months.
