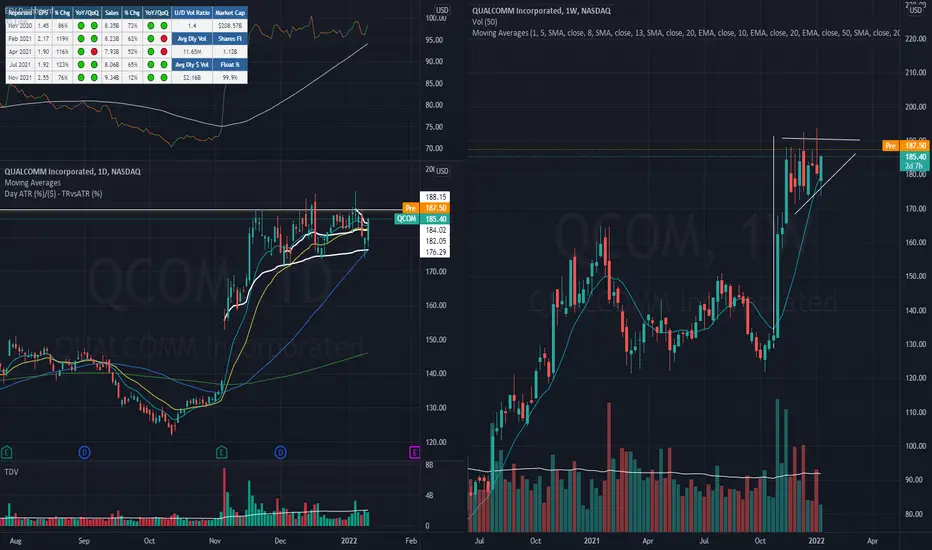
US Stock In Play: $QCOM$QCOM upon its Q3 earnings gap up, it remains relatively resilient to market weaknesses since december. also flagging in weekly chart.
yesterday's closed have $QCOM trading beyond all significant VWAP, above 10/10/50 MA.
$188.15 is the ideal level for a tight entry to size up
QCOM
Is Qualcomm a durable tech stock?Hi everyone,
Today we will talk about NASDAQ:QCOM , a semicunductor manufacturing company.
As we saw almost all tech stocks selling off from late November through to 2022, NASDAQ:QCOM managed to stay up there quite nicely.
The question to ask now: Is it lagging?
Will [ symbol="NASDAQ:QCOM"]NASDAQ:QCOM follow broad tech market and proceed to a major correction?
Or will it continue grinding higher?
Inasmuch as semdiconductor industry is carrying world's supply chain on its shoulders, I still think we could see a correction in the stock.
We've got a looming danger of Fed's interest rate hike somewhere in March-June this year.
I cannot believe any risk asset such as tech stock would stand still when it happens.
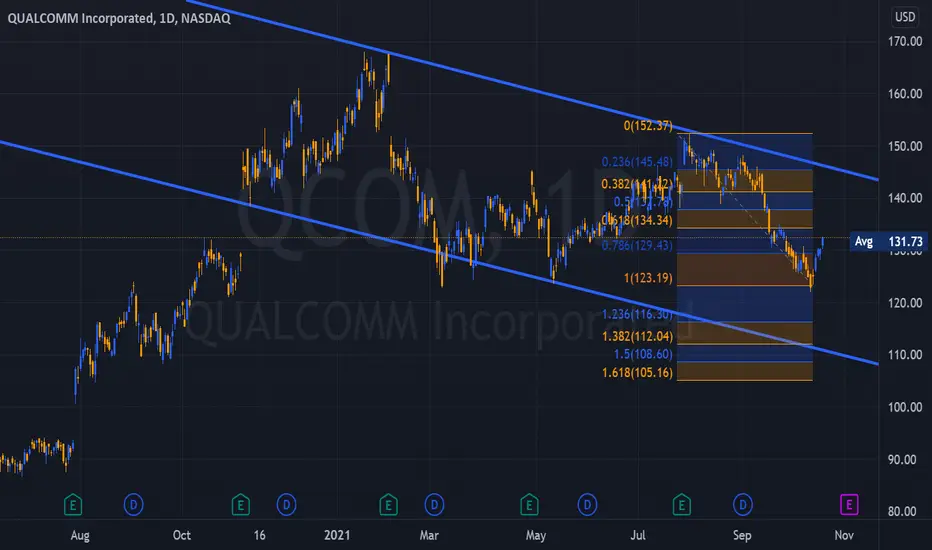
Putting macro stuff aside for a moment, we can see a similar pattern in the past of the stock price, where ATHs were reached, touching a rising trend resistence, which led to a rapid 26% correction and 260 days consolidation in the lower range.
I strongly believe that the conditions are ripe for the same scenario to repeat.
I will buy the stock after new consolidation pattern is established, preferrably near 150 level.
Please let me know if you found my macro rant useful and if you would like to see similar content in the future.
Trade wisely and good luck!
-----------------------------------------------------------------------------------------------------------------
Disclaimer!!!
This is not financial advise

QCOM - Qualcomm Inc.Bought position into break of pivot from the previous earnings-gap run. This is the fourth attempt to breakout from this pivot. Stop loss below the low of the day.
Bigger picture, the stock is breaking out from a large base to new all-time highs and remains one of the leaders in the market. It has big growth numbers and is in one of the strongest areas of the market.

US Stock In Play: $QCOM$QCOM setup on both daily and weekly displays a pretty HTF with 50DMA / 10WMA catching up to its current consolidation.
this is one of the few semicon setup that have not rallied beyond its ATH this week

$QCOM approaching ATH.$QCOM approaching all time high and price target recently upgraded to 215. $QCOM setup is clean sitting above the ema lines. today tech stocks bounce after fed meeting and there might be bullish continuation tomorrow.
buy call above $191.30
buy puts below $186-185
always take profits as you see one and always follow your risk management.
Hello everyone,
welcome to this free technical analysis . ( mostly momentum play )
I am going to explain where I think this stock is going to go over the next day or week play and where I would look for trading opportunities.
If you have any questions or suggestions which stock I should analyze, please leave a comment below.
If you enjoyed this analysis, I would definitely appreciate it, if you smash that LIKE button and maybe consider following my channel.
Thank you for stopping by and stay tune for more.
My technical analysis is not to be regarded as investment advice. but for general informational proposes only.
Bull flag without a Flag Pole ?Im undecided but there is a gap so i guess wait for confirmation lol but if anyone has any suggestions I'm all ears.

10-20% correction in Qualcomm It seems QCOM is making a top formation and could experience a 10-20% correction in the coming weeks!
I was not Bearish on this one!
You can see the most important support (green lines) and resistance (red lines) to watch in the coming days in these charts!
Best,
Moshkelgosha
DISCLAIMER
I’m not a certified financial planner/advisor, a certified financial analyst, an economist, a CPA, an accountant, or a lawyer. I’m not a finance professional through formal education. The contents on this site are for informational purposes only and do not constitute financial, accounting, or legal advice. I can’t promise that the information shared on my posts is appropriate for you or anyone else. By using this site, you agree to hold me harmless from any ramifications, financial or otherwise, that occur to you as a result of acting on information found on this site.

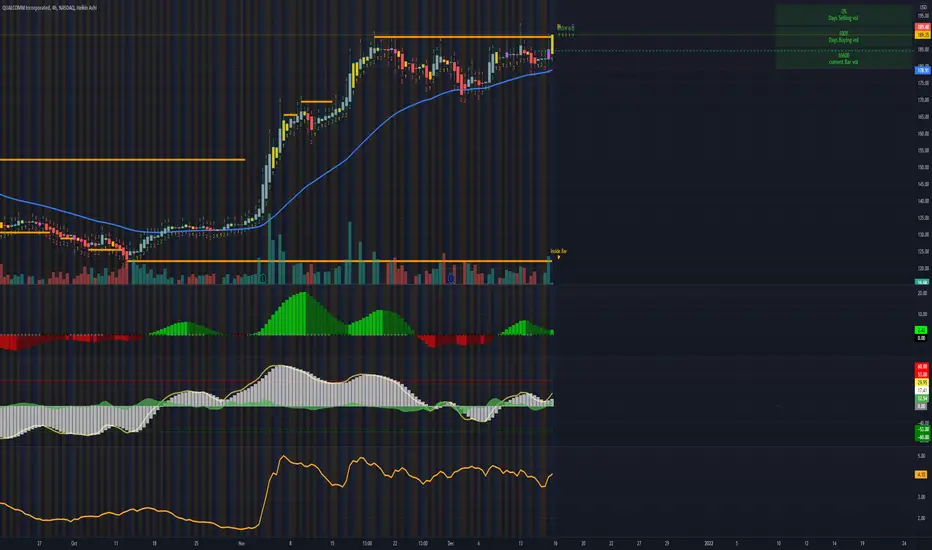
QCOM - Inside Day BreakoutQCOM looking to breakout to above the inside day and push higher than the trend line,. Looking to take calls above $185

$AMD: Classic DotCom bubble $QCOMAMD has had quite a run over the past 3 months building a lot of negative divergence in both MACD and RSI (Same as $AFRM - buy time and there will be a dumpster fire). Similar to dotcom bubble QCOM, just another ponzi scheme by WallStreet to ensure the next generation remains wage slaves - totally love this perspective.
Having said that:
$AMD Long above 164.46: Targets - 172,177
$AMD short below 155.64: Targets - 150,147
Lastly, shout out to the bulls, we need them to have a steady employment rate in the country.

11/28/21 QCOMQUALCOMM Incorporated ( NASDAQ:QCOM )
Sector: Electric Technology (Telecommunications Equipment)
Current Price: $175.74
Breakout price trigger: $181.00
Buy Zone (Top/Bottom Range): $172.00-$165.00
Price Target: $196.00-$200.00
Estimated Duration to Target: 61-69d
Contract of Interest: $QCOM 2/18/22 200c
Trade price as of publish date: $5.40/contract

QCOM Similar pointsOn this chart I have used Gann and a Parallel channel to display two similar points in the evolution of QCOMS value
Where the green Gann fan and Parallel channel meet through the uptrend can be considered similar both because of there place on the chart, and price action
Using this I have plotted a white Bars pattern, where I expect price to move to
Using the MavilimW indicator, it can be seen within both wedges , the indicator becomes very unstable, swinging between up and down
Perhaps an intrinsic property of the Wedge pattern
This is the weekly chart for QCOM

Long | QCOM | Intraday 11/16/21NASDAQ:QCOM
Possible Scenario: LONG
Evidence: Price Action , Dark pool activity, Options flow.
Entry point: current price, it can drop more but not important.
TP1: 176$
Call options 12/17/21 strike 170$
Call options 11/19/21 strike 172.5$
*This is my idea and could be wrong 100%.

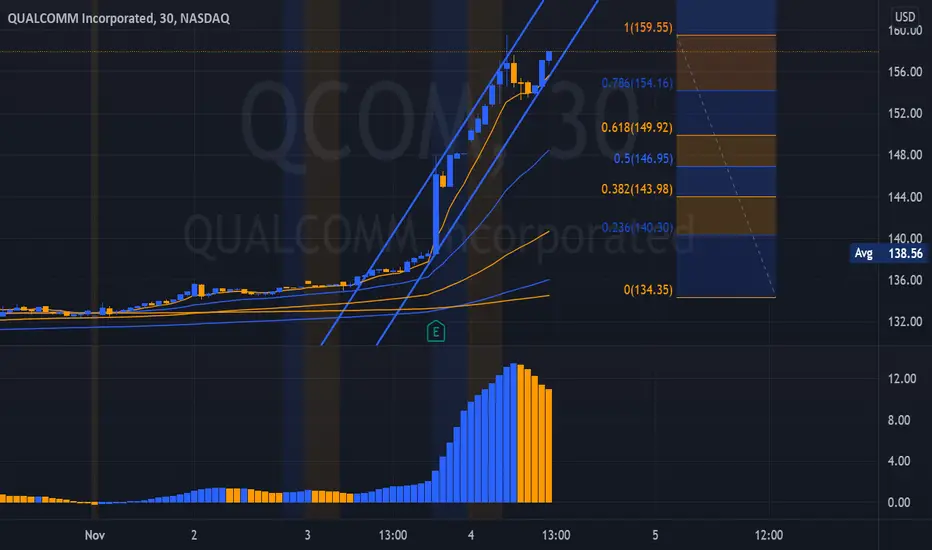
Every Traders and Analysts should know their Limitations!In this article, I would like to review some of my best trades in the past 2 months!
My goal is to talk about earnings and how unpredictable their outcome could be.
In the past few months, I have tried to find reliable methods to predict the price movement after the earnings!
Unfortunately, I did not find any reliable and fairly accurate method so far!
Having said that, I prefer to stay out of trades before earnings to manage the risk of exposure to big gaps!
I do this because I know it is in my favor in the long term!
For example, I opened a perfect entry at 125.5 for Qualcomm, and closed with a +7.66% gain before the earning! It popped with +12% after earnings!
Should I regret it?
My answer is NO, I am actually very proud of this trade, although I missed the bigger chunk of profits in this trade, my decision was right in Palantir and AMC case!
PLTR: trade closed with +10% in 21 days
AMC: trade closed with +26% in 4 days
Also, I prevent a catastrophe in PYPL: closing with a -2.16% loss.
But why should I be proud of my trade?
I think any trader needs to define his rules and follow the rules!
In the long term, those who do not follow their rules will have the same result, most of them will fail..!
How did I decide to not hold my positions during earning calls?
I apply one of the game theory rules!
Minimax
In game theory, minimax is a decision rule used to minimize the worst-case potential loss; in other words, a player considers all of the best opponent responses to his strategies and selects the strategy such that the opponent's best strategy gives a payoff as large as possible.
The name "minimax" comes from minimizing the loss involved when the opponent selects the strategy that gives maximum loss and is useful in analyzing the first player's decisions both when the players move sequentially and when the players move simultaneously. In the latter case, minimax may give a Nash equilibrium of the game if some additional conditions hold.
Minimax is also useful in combinatorial games, in which every position is assigned a payoff. The simplest example is assigning a "1" to a winning position and "-1" to a losing one, but as this is difficult to calculate for all but the simplest games, intermediate evaluations (specifically chosen for the game in question) are generally necessary. In this context, the goal of the first player is to maximize the evaluation of the position, and the goal of the second player is to minimize the evaluation of the position, so the minimax rule applies. This, in essence, is how computers approach games like chess and Go, though various computational improvements are possible to the "naive" implementation of minimax. (Brilliant)
Minimax has many applications:
In game theory or decision making, a tactic in which individuals attempt either to minimize their own maximum losses or to reduce the most an opponent will gain. For example, a health researcher may propose an intervention that would be the least aversive treatment for a serious disease, thereby minimizing the adverse effects patients may expect to experience as a result of the disease.
I can apply what I learned in med school to the market!
When should you use Minimax in trading?
The answer is simple:
Always..!
Actually, Minimax is the mathematical reason behind using stop loss!
I think I do not need to talk about the importance of stop-loss, I just want to mention WD Gann quote about stop loss:
"Stop loss orders are a trader's best friend."
Price Gap:
Generally speaking, stock prices experience a price gap after earnings! makes it very hard to execute your stop loss without slippage if you are on the wrong side of the trade! this slippage could harm your overall performance in long term as a trader!
Decision-making in the presence of uncertainty.
Minimax, as the name suggests, is a method in decision theory for minimizing the maximum loss. Alternatively, it can be thought of as maximizing the minimum gain, which is also known as Maximin.
It all started from a two-player zero-sum game theory, covering both the cases where players take alternate moves and those where they made simultaneous moves. It has also been extended to more complex games and to general decision-making in the presence of uncertainty.
Stock Market is a Non-zero-sum game, While options are a zero-sum game!
To wrap it up, you should use minimax when your opponent is very sophisticated and its activities are very unpredictable!
No need to say that market is very sophisticated and unpredictable!
"Why do you think the same five guys make it to the final table of the World Series of Poker EVERY YEAR? What, are they the luckiest guys in Las Vegas?"
-Mike McDermot, 'Rounders'.
Reference articles:
brilliant.org
dictionary.apa.org
uh.edu
becominghuman.ai
PEducation

$QCOMIf it can close above the weekly candle 168.55 and hold 166 expect to see ATH in a (BLNK) of a eye see what I did there. .. But forreal tho..
ibb.co darkpool
ibb.co option data

QCOM - This won't end well short term - RSI overboughtRSI indicator showing that QCOM is overbought on the 4H chart. We see a retracement to $140
For educational purposes only.

NQ - 4Hr + Macro / Gamma - Delta Accident - JPow Fools AgainThe Macro Data Calendar for Today:
Non-Farm Payrolls
Average Hourly Earnings
Unemployment Rate
Coupons - $8.425 Billion 2s to 4s.
______________________________________________________
ZN continues to Trade the Lower End of the Range.
The BOE Stick saved the US Treasury Market, although FED FUNDS...
Disagree - www.cmegroup.com
Oops... Again - www.cmegroup.com
Powell Blindsided everyone with the Taper while FED FUNDS...
Accident moving forward in TIME.
2x Ooops.
______________________________________________________
Our Thesis was the Federal Reserve would begin to move forward,
quickly forward to Increase FED FUNDS far more rapidly than the
Retail Trader/Investor anticipates.
This Thesis has been ongoing since JULY 2021.
2024 to 2023 to 2022 to now 2021.
We were Correct - 100% Correct.
Thereby creating a large Event taking the Equity Complex to its knees
and down to the 200SMAs, where they would find minor support for
a Counter-Trend, only to reverse and Trade to closer to the 400SMAs.
Nothing, and I am quite resolute in this Thesis, has changed.
The Probability has increased substantially - Exponentially.
______________________________________________________
Disagree?
Up to you, it is your Capital @ RISK.
We continue to mount a large Position in Options for the IMPENDING
reversal.
______________________________________________________
NQ will be in 8/9 today, the Price Objective we stated for the Profit
Target... was met during Globex @ 16424. SOLD NQ on a FR.
Resistance has Traded First.
______________________________________________________
I have been repeatedly Asked in PM @ TV why I am a "Bear" in this
Mania.
Answer: Continue to chase Gamma/Delta, we Fade it, there is no
Top Picking is ongoing, there is, however, an acute understanding of
how this ends, and it will.
Positioning for it, taking heat... taking losses, all part of the entry.
We hold no Underlying Sells in the NQ ES YM RTY.
We do Hold Derivatives in the QQQ SPY SMH TQQQ TSLA QCOM
TLT AMC AAPL and continue to build on these Positions from
November to January.
Top pickers have at it, wading in is more our style and we know
how to do so with a minimal negative effect - Hedge Underlying.
______________________________________________________
We see a very large Market Dislocation directly ahead.
Agree/Disagree - immaterial.
It is our Trade Plan and it is not changing, not remotely.
______________________________________________________
The unwind will be of extreme velocity, most will indeed miss
the majority of the Negative Price Actions.
Presently - 32% Positioned into the impending SELL.
______________________________________________________
Trade Safe everyone - HK

QCOM - VerticalPressed Put Positions @ higher Levels.
QCOM - DEC - JAN Put Spread
135 x 25
140 x 25
145 x 25
150 x 25
155 x 10
160 x 10
Needless to say, early Puts were smoked.
We increased these by 150% and will continue
to add into next Tuesday.
1 - Equity trade 1.5 x 141.00 closed @ 153.30.
$QCOM | UPDATEAll targets HIT and gap nearly filled after a monster move from earnings! Idea was shared when QCOM was trading at just $130 resulting in over 20% move in equity.
Congrats if anyone played this one!!

$QCOM | WEEKLY WATCHLIST 11/1 Didn't have time to do a full Elliot Wave Theory analysis on this one, I apologize for that. However, very clear supply/demand zones labeled, while trading within a wedge. Extremely attractive bullish inverse head & shoulders shown on the chart, looking to potentially confirm and breakout early in the week.
The only thing holding me back from this is the fact that Qualcomm reports earnings on November 3rd. Setup is extremely good on this one, so I may make an exception and possibly day trade this one before earnings. Not looking to swing until after earnings is reported.

QCOM - First Apple, Now GOOGLEGoogle chose Samsung to partner in the Exynos Extension - the Tensor.
While Exynos has had its detractors over the years, with good reason, the Tensor is an
entirely new beast.
No Taiwanese Manu is required, South Korea is safer.
Another number of Nails in the QOCM coffin.
Google is going to capture large amounts of Market share from everyone - Including the iMob.
The phones are, IMHO, quite nice in appearance and performance.
Integration is the Key.
No other TECH company on the planet can match Google.
They are finally, fully committed to entering the market and their new Flagship... it is a remarkable
piece for Kit @ $899, well below its competitors.
The combination of exceptional Software and Solid, robust hardware, will provide an experience
unlike any other. Mid-Band 5G will rip as T-Mobile finally begins to integrate the Licenses from their
merger with Sprint.
The Pixel 6 is the world's first truly international Smart Phone and seamless carrier switching the
competition lacks and will for a period of time.
QCOM will continue to lose Market Share, their attempt to enter the Smart Phone Market was less
than spectacular.
Our strategy is to build a Put Calendar spread in QCOM from 140 to 150.
We believe QCOM will be moving far lower in Price as Google gains immense Market share with the
introduction of the Pixel 6 and Pixel 6 Pro.
I'm watching the Google Pixel Live Stream and am impressed with a very Non-Apple presentation.
Believe this to be a Game Changer with QCOM in the 90s once again - HK
Keep Qualcomm on your watchlist for a possible breakout..!Price action to:
-123 as an important support level.
-Lower border of downward channel and bounce back perfectly
Now QCOM is at the upper border of the downward channel and a possible breakout is imminent..!
My most recent analysis:
Oct13,2021
Entry: 125.5
Stop loss:122.15
Reward/Risk:2.95
Target range: 135
Time Frame: 4wks
Possible gain: 7.66%
Possible loss: 2.6%
Position size: 5 % of trading capital
DISCLAIMER
I’m not a certified financial planner/advisor nor a certified financial analyst nor an economist nor a CPA nor an accountant nor a lawyer. I’m not a finance professional through formal education. The contents on this site are for informational purposes only and do not constitute financial, accounting, or legal advice. I can’t promise that the information shared on my posts is appropriate for you or anyone else. By using this site, you agree to hold me harmless from any ramifications, financial or otherwise, that occur to you as a result of acting on information found on this site.
Qualcomm (QCOM) designs, develops, and supplies semiconductors and collects royalties on wireless handheld devices and infrastructure based on its dominant position in CDMA and other related technology patents.

$QCOM | WEEKLY WATCHLIST 10/18Nice bounce off the bottom of the wedge here. Looking for continuation upwards to targets above at $135, $139, $141 and $145 as long as the low holds. Take note of the Daily MACD curling positive as well as the Daily RSI breaking out of downtrend!
I am already positioned in a long swing from last week on this.

QCOM | In a major support zone | Possible paths to expectToday, we will take a look at QCOM
The price is currently against a major support zone that has been working effectively since October 2020. Let see what we can expect in case of bearish or bullish resolutions.
This analysis is meant for people that develop short-term setups. Why am I saying this? because, at the moment, we can't think about new trends like the one from March 2020 until January 2021. To start thinking about something like that, I want to see a breakout of the current structure, at least. Alright, with all that said, let's start.
BULLISH scenario: If the price effectively bounced on the support zone, a propper invalidation zone for it would be 120 (there, we will start thinking that the level was absolutely broken)The target we will use for this idea is the white descending trend 142.00. There we will be open to rejections.
BEARISH scenario: If the price is able to break the support zone reaching a price of 117.00, we will expect a pullback towards the broken support level. IF that happens, a new low on that pullback would confirm the bearish movements with a target on 100
Thanks for reading!
