Qualcomm (QCOM): A Fundamental and Technical AnalysisIn this post, I’ll be providing my own analysis on Qualcomm (QCOM), shedding light on the fundamental and technical aspect of the stock.
What is Qualcomm?
Qualcomm (QCOM) is short for ‘Quality Communications’.
The American company was established by a communications engineer, Irwin Jacobs.
It’s a company that focuses on semiconductors, software, and wireless technology services.
Business Model
- Qualcomm is divided into two main businesses: QCT, and QTL
QCT
- QCT (Qualcomm CDMA Technologies) develops and supplies integrated circuits and system software
- Specifically, it develops and supplies systems and software used in mobile devices, wireless internet, communications devices, internet of things, and semiconductors used for vehicle infotainments.
- The smartphone AP is a core device that controls the OS, CPU, memory, audio, and the camera
- Qualcomm currently covers 50% of the market share for mobile device APs, and dominates 88% of the 5g Smartphone AP market.
- They are way ahead of their counterparts in both market share and technology.
- Qualcomm also offers a cloud service for vehicles, allowing wireless updates to take place
- They have also developed an autonomous driving solution chip called Snapdragon Driving.
- We will see cars that use this chip in 2023
- The RF Solution, a wireless network that allows signals to be identified without confusion, is also increasing in demand
- QCT covers 75% of the company’s revenue.
QTL
- QTL (Qualcomm Technology Licensing) grants licenses and rights to use intellectual property to others.
- Qualcomm possesses patents on CDMA, LTE, 5g, video and audio codec, WIFI, GPS, NFC and Bluetooth.
- QTL covers 23% of the company’s revenue
Financials
- Despite the numbers not being anything extraordinary, Qualcomm has reported a consistent increase in yoy revenue
- Especially in the case of Q3 2020, we have seen revenue and earnings skyrocket.
- The firm’s Q1 earnings was $468m, $845m in Q2, and $2.96b in Q3
- Along with this, their EPS has also skyrocketed, and analysts estimate a an EPS of $2.07 for Q4
- Qualcomm has not been profitable for the past few years due to their heavy investment in research and development
- While a lot was invested in R&D, the commercialization of proprietary 5g technology could bring immense profits to the company in the near future
Technical Analysis
- The daily chart shows a clear uptrend, with prices creating higher lows and higher highs
- Prices are trading within an ascending parallel channel, having been rejected by the top trend line resistance
- There are two major gap supports at $100, and $140
- The Moving Average Convergence Divergence (MACD) demonstrates diminishing bullish momentum, with decreasing histograms
- Nevertheless, as prices trade above the Ichimoku cloud and the 60 Simple Moving Average (SMA), the overall trend is very bullish
Summary
In conclusion, Qualcomm is a company that has a proven, solid business model. Their heavy investment in research and development is finally seeing light as the company turns increasingly profitable. Technical analysis also demonstrates immense bullish momentum behind the stock’s price.
If you like this analysis, please make sure to like the post, and follow for more quality content!
I would also appreciate it if you could leave a comment below with some original insight.
QCOM

SOXX 5smaNotice how the 5sma has been resistance for the SOXX for the past 12 trading days (red oval).
This tells us that short-term, SOXX has to break the 5sma to get out of its current down-trend.
The purple line is the 50sma, which is now also resistance, as we crossed below it, and is now touching the 5sma.

QCOM w43 2020. Risky long to 132$. Better w8 correction to 100$Whole Picture
Price in upward channel
Weekly
Uptrend reach its high.
Now its time to loose steam and get corrected for price.
If it is not good earning on Q3 it is better sell. and open from 112 - 118.
Price is on the top of channel. too risky to buy.
Case 1.
Positive Earnings and good political sitatuion = Long up to 143$
Open Now
TP 132$
SL 115$
Case 2 - more possible.
Weak earings in Q3. - deep correction to 100$
For now i think the best way is to work in short terms.

Long Position with break triangle patterGood day!
I see the clear triangle patter on 1w chart, now the price covered 2/3 of pattern and probably ready to test support and resistance.
After falling of SMP I expect accumulation of Momentum and power to make trend go up.
On RSI and chart we have slight Divergence, but i suppose its related to SMP falling and reflex it.

QCOM 4 hr symmetrical triangle breakout scenarios NASDAQ:QCOM Recently exploded above 100, fueled by the hype of 5G. looking at the 4 hr chart, we have a strong symmetrical triangle pattern formed with breakout potential to both the bull and bear side. QCOM appears to have only slowed down due to the recent sizable pullback to QQQ and the tech sector as a whole. I am feeling very bullish on QCOM and will be looking to scalp on breakouts of the 120.2 supply and the ATH. If tech continues to bleed, we could see a solid short opportunity on a break below the trend line support, using the demand zones as TP points.


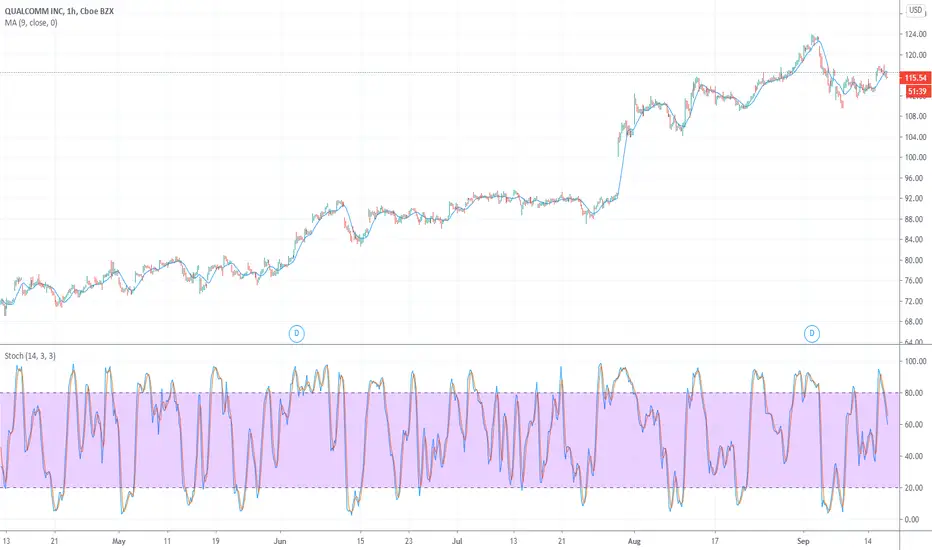
QCOM, enters monthly bullish trend. Expect Uptrend continuationQualcomm, Inc. (QCOM, $116.58) is predicted by Tickeron A.I.dvisor to grow by 4% to $121.24 or more within the next month. Keeping in mind similar previously-analyzed scenarios where the stock trended up during the month, the odds of an Uptrend continuation are 87%. Current price $115.85 is above $105.05 the highest support line found by Tickeron A.I. Throughout the month of 08/13/20 - 09/15/20, the price experienced a +3% Uptrend. During the week of 09/08/20 - 09/15/20, the stock enjoyed a +6% Uptrend growth.
Bullish Trend Analysis
The Stochastic Indicator suggests the stock price trend may be in a reversal from a downward trend to an upward trend. 38 of 60 cases where QCOM's Stochastic Oscillator exited the oversold zone resulted in an increase in price. Tickeron's analysis proposes that the odds of a continued upward trend are 81%.
The Aroon Indicator entered an Uptrend today. Tickeron A.I. shows that in 175 of 281 cases where QCOM Aroon's Indicator entered an Uptrend, the price rose further within the following month. The odds of a continued Uptrend are 62%.
Tickeron has a positive outlook on this ticker and predicts a further increase by more than 4.00% within the next month with a likelihood of 84%. During the last month, the daily ratio of advancing to declining volumes was 1.22 to 1.
The Tickeron Price Growth Rating for this company is 6 (best 1 - 100 worst), indicating outstanding price growth. QCOM’s price grows at a higher rate over the last 12 months as compared to S&P 500 index constituents.
The Tickeron SMR rating for this company is 10 (best 1 - 100 worst), indicating very strong sales and a profitable business model. SMR (Sales, Margin, Return on Equity) rating is based on comparative analysis of weighted Sales, Income Margin and Return on Equity values compared against S&P 500 index constituents. The weighted SMR value is a proprietary formula developed by Tickeron and represents an overall profitability measure for a stock.
The Tickeron Profit vs. Risk Rating rating for this company is 10 (best 1 - 100 worst), indicating low risk on high returns. The average Profit vs. Risk Rating rating for the industry is 82, placing this stock better than average.
The Tickeron PE Growth Rating for this company is 18 (best 1 - 100 worst), pointing to outstanding earnings growth. The PE Growth rating is based on a comparative analysis of stock PE ratio increase over the last 12 months compared against S&P 500 index constituents.
QCOM LongClassic reversal for up-trending stock.
probably will retest the high at 124$
Stop is at today's low around 115$
Good luck!

QCOM BUY OR LONG , TARGET UP TO $122QCOM surpassed the established set (Gap big) and the volume was very large, showing a strong determination to raise
prices, I conducted "OPEN LONG", the model took a target equal to 80% of the V-shaped height .
Normally this pattern I will measure Target as SHS Pattern or Cup and Handle Pattern.
QCOM buy : $105
QCOM target : $120 +-2
Stop loss : 10%
Wish you good deals!

Qualcomm sell signals on D1.Qualcomm, daily timeframe: Resistance level + 2 Hanging Men + Divergence

TSLA 10K+ in 2021TSLA is the QCOM of the 2020 tech bubble. Compare QCOM from 1992-2000 and you'll see where I got this idea.

QCOM: Expect the bulls to win the $92.0the bulls have been very persistent with QCOM. it took more than 4 attempts to break the $81 and the $89.
next we should expect to breach the $92, maybe today by market close (that would be great), maybe Monday? we have good tail wind and positive/green sentiment - but the current short term move is not yet a fully formed uptrend (on the 1hr and Renko views)
let's keep watching. Projected target of $98 by Wk4 July still holds so far.
thoughts?

QCOM Breakout IdeaQCOM looks prime for breakout to $100+.
Volume Profile since November gap up forming base at $90 as launchpad. Moving Averages stacked. Lots of taps at this resistance, not going to hold much longer imo.

QCOM Massive Fractal Breakout5G architecture / devices rolling out to the end of the year. Tech as a whole heading to its second bubble. It would only make sense QCOM is one of the leaders of the rally.


QUALCOMM INCThe market. Continues its upward trend. there is a probability that we are going to the level of 105 if ever we break with power the resistance of 92

QCOM: Ready, Steady, Go!beautiful pattern and a breakout at the end of the day today.. Seems the move up hit some buy stops that were waiting the breakout
first target hit, and looks like there's room to move higher. let's keep watching (and holding)


Purchasing QCOM calls in June.May's monthly candle closed above April's high.
If price returns to April's high, then I will begin purchasing call options at the 80.00 strike with a July 2 expiration.

QCOM - Changing direction?QCOM created a nice bottoming pattern inv. H&S
the only thing is price hasn't broke above neckline resistance at 81.8
posting for tracking for the next few days

QCOM - strong company, heavy buying volume today, good supportEntered a long position here today - feel like this one will reverse pretty good along with overall QQQ

QCOM: Key levels and test-driving a new indicatortest-driving my new "VolumeViewer" using QCOM - to find key supply / demand balance levels.
the key balance levels are found either as the VV crosses 0, or when it changes direction and they usually correspond to S&R levels for the underlying.
note: i'm long QCOM and looking for opportunities to add to position.

QCOM trade and the (Fisherman) setupTook a long position today on QCOM , and it worked well. entry point was $75, and the first target is $83.6, with a possibility that i just hold it for a long term (I like QCOM for the 5G motion)
i wanted to share this trade cause it's a classic example of a setup that i call "the fisherman" - and while it's very easy to learn and use, it can provide high probability trades.
here's how the fisherman works...
- first we need to look at a Renko chart - you can see from the dual view here how super easy it is to see the signals on a Renko vs a regular bar or candle chart - Renko is a real secret weapon -- maybe we talk more about that in future posts
- on the price chart, i have the MagicWave - ignore the Wave (aqua/orange) line, the other lines are a 10sma (purple) and a 30ema (blue) -- easy to add to the chart individually. the main one we need is the 30ema
- on the lower panel there's my own version of the Balance Of Power - but you can use the Dual RSI indicator that i published before. why we need this? cause it shows momentum for 2 periods, a fast and a slow - and that's important for the signal we want to see. use a fast length of 5 (yes we want this to be really fast) and a slow length of at least 6 to 8 times the fast - we don't want the slow length to be "too sensitive".
how does the fisherman setup work? what signals do we look for:
1- the price will cross the 30ema going up (the yellow circle), at the same time, both the fast and the slow momentum (RSI) will go positive (as in the yellow box)
2 - the price will retrace back towards the 30ema then will bounce off the 30ema (the green circle), and at the same time, the 30ema will start moving up creating a bottom - the shape in our green circle looks like a "hook" - that's the fisherman's hook :)
3 - super important, while the price is doing "the hook", the fast momentum moves down, maybe even into the negative zone, *but* the slow momentum remains green - the setup fails if the slow momentum also goes negative - we need to have a positive "backdrop" that shows there's a prevailing commitment to the upside
4 - The Entry: you're the fisherman, you have the hook, and now you need to "catch" an entry as low as possible for maximum profit - yes, we will be "bottom fishing" here :). in today's trade, i got lucky and caught the $75.
5 - The Position: once in the trade, we set the target and exit loss .. and back to our regular programming :)
i hope some find this useful - practice the fisherman setup and add it to your arsenal of possible setups or even as a way to validate your good trades and entries
(the fisherman can also be used in catching a good entry for a short, the hook will be the other way around. see if you can identify the 2 other fisherman setups on QCOM since the beginning of March - zoom our the Renko as needed)
good luck!..
