Remninmi Bottomed?With the China crash still fresh on everyone's minds its time to ask if the Renminbi has bottomed out or if there is still room to crash. Based on the link attached, there seems to be the potential for a lot more bad debt that China is trying to avoid confronting, and probably couldn't even account for if they tried.
On the technical side, note the massive resistance from above via the Ichimoku cloud, successive massive drops and the inability to break previous highs. There seems to be a nice profit target at about 0.13730, which was tested and rejected on October 14th. As for a stop loss, there seems to be a level of support around 0.14032. The MACD and RSI do not indicate that this asset is oversold, despite the massive downturn as of late.
Quant

China fears bolster the EuroFollowing logic from my linked post on Commodity Currencies such as the AUD, we can expect attention on the Euro as a safeguard. In fact, EURUSD is picking up as I write this post. At this point, I'd wait for a dip entering a trade, as a brief retracement is inevitable. However the MACD indicates a bullish turn, the OBV is showing increased bullish pressure and the RSI indicates we are still a go.

China fears wreck commodity currenciesAs we all know by now, the Chinese markets were only open 14 minutes before a crushing 7% loss tripped safeguards. Recently, news came out to the effect that we can expect a further devaluation of their currency. This will hurt commodity currencies like AUD. In fact, its slipping as I'm writing this.
My short position is bolstered by massive pressure from above via the Ichimoku Cloud, and the difference between the MACD and signal is rapidly closing suggesting a bearish turnaround. The RSI gives us a green light.

Bearish outlook on the S&PA variety of technical indicators coupled with the Fed's recent rate rise may suggest a bearish outlook on the S&P 500. Note the gap up on 12/15 only to be followed by a gap down two days later, from which SPY was never able to recover. We also see tremendous pressure from above via the Ichimoku Cloud, but lots of room to fall from below.
The MACD/RSI combo suggest a meager attempt at reversal, though the OBV suggests massive selling pressure. Look to today's high at $202.67 as a stop loss and the congestion area right around 200.80 for a profit target

The Rich Get Richer...While the Fed is boasting good data supporting rate hikes, they neglect to mention the fact that 51% of Americans make less than $30K a year, or that they work more hours than any country in the world. Something else they focus on are broad market indices for which the top 500 companies carry the slack of the smaller cap companies which are feeling the weight of the economy on their shoulders.
The Vanguard small cap ETF tracks such small cap businesses and multiple factors besides fundamentals point to a good short position on a swing trade. For example, none of the highs can come anywhere close to December's levels. There's lots of resistance from above via the Ichimoku cloud, and MACD, RSI, and OBV indicators suggest lots of downward momentum and selling pressure. There's a relative vacuum below, but look for 12/17's high of $112.65 as a stop loss as this is the most recent high.

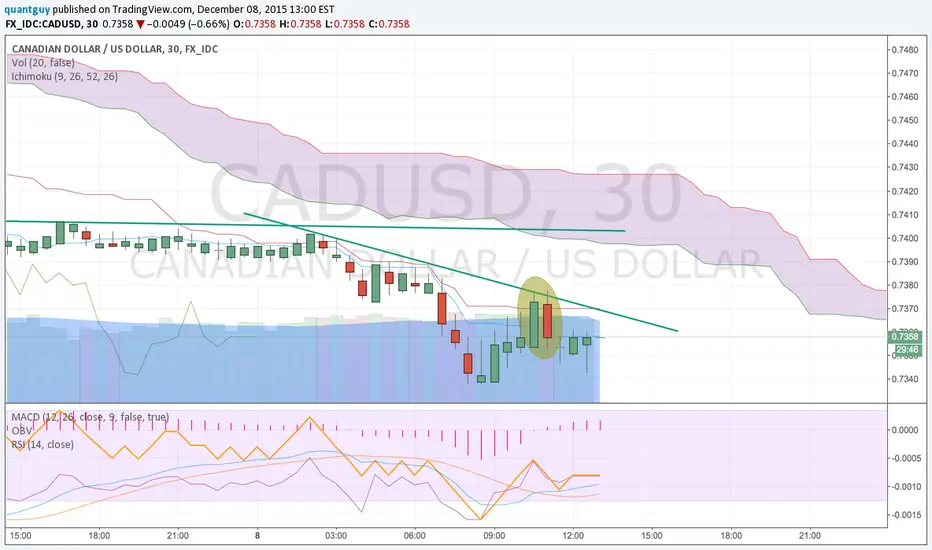
Candadian Dollar Still Can't Keep UpLargely a function of what crude oil is doing, the Canadian dollar simply cant keep up, even despite the rally in crude earlier today. Further, weak jobs data does not help.
Although we have a nice 0.7403, the slope of the upper bounds steepens indicating the bears are awake. Also, there is a "dark cloud cover" candlestick pattern indicating a level was tested and rejected. Finally, with a finer time scale we see what looks to be a head and shoulders pattern forming. There is strong resistance from the Ichimoku cloud from above as well. The MACD/RSI indicate a strong downtrend.
How to Profit from the IMF's Decision on the YuanFollowing the IMF's decision to add the Yuan to the SDR bucket. Fundamentally, this will imply a rush to stock up. Many central banks keep a reserve supply of other currencies, commodities, etc, with an emphasis on SDR's. This fact, coupled with the dollars eventual deceleration come an interest rate decision in December could imply that CNHUSD will be a good long trade.
The technicals look weak, to be completely honest. There is some resistance from above via the Ichimoku cloud and the MACD suggests some negative momentum, though the MACD/RSI combination does suggest now is a good time to make a move, not necessarily a long position.
This chart pattern does look conspicuously like an ABCD pattern waiting to happen. The ratio of the first leg is right in the sweet spot at just over 0.6, so assuming a completion of this pattern, we can expect the other leg between 1.2 and 1.6, so a conservative profit target has been set using a ratio of 1.2, which is right around 0.15829.
Assuming a 50% Fibonacci retracement anchored at 8/25 and 10/30, we can set a stop loss at 0.15208.

Markets Shake with Impending Rate HikeThe bullish run for the markets appears to be slowing especially as the impending interest rate hike gets becomes more of a reality. Some bearish signs are especially prevalent for QQQ, as we see a relative vacuum area from below and lots of room before we hit any resistance from the Ichimoku cloud. Moreover, the RSI, MACD and OBV all indicate an unfortunate turn of momentum for this asset.
For profit targets, consider the first fibonacci level at around 111.59, or the high of 10/22 at 109.82. Be especially wary of 115.52 as it corresponds to a recent high and a fibonacci level concurrently.
