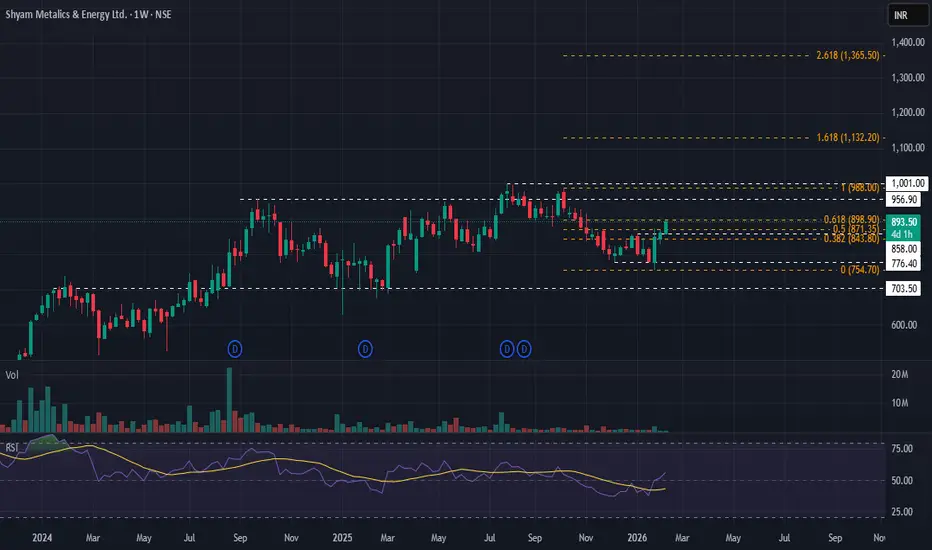
SHYAM METALICS & ENERGY – Upside Momentum Building🟦 SHYAM METALICS & ENERGY – Upside Momentum Building
Shyam Metalics and Energy is showing signs of upside momentum after a prolonged corrective and consolidation phase.
💰 Trade / Positional Plan
• CMP: ₹895
• Stop Loss: ₹774
🎯 Targets
• ₹958
• ₹1011
• ₹1132
📊 Technical View
• Stock remained in a broad range of ₹703–₹956 for ~6 months
• After falling from ₹988 → ₹754, price is now near 61.8% Fibonacci (~₹898)
• Holding and sustaining near this zone suggests strength returning
• Price action indicates potential range breakout and trend resumption
• If momentum sustains, structure can attempt fresh highs over time
📌 Trading Approach
• High volatility → keep quantity in check
• Prefer staggered entry
• Strict position sizing
• Patience trade, not a chase
• Avoid reacting to news flow; respect SL
⚠️ Clarification: Independent analysis. No part of Religare involved.
📝 Important: No responsibility for profit/loss. No fees charged.
📉 Disclaimer: Not SEBI-registered. Please do your own research.
✅ Range contraction + Fib support = potential upside, discipline decides outcome.
Rangebreakout
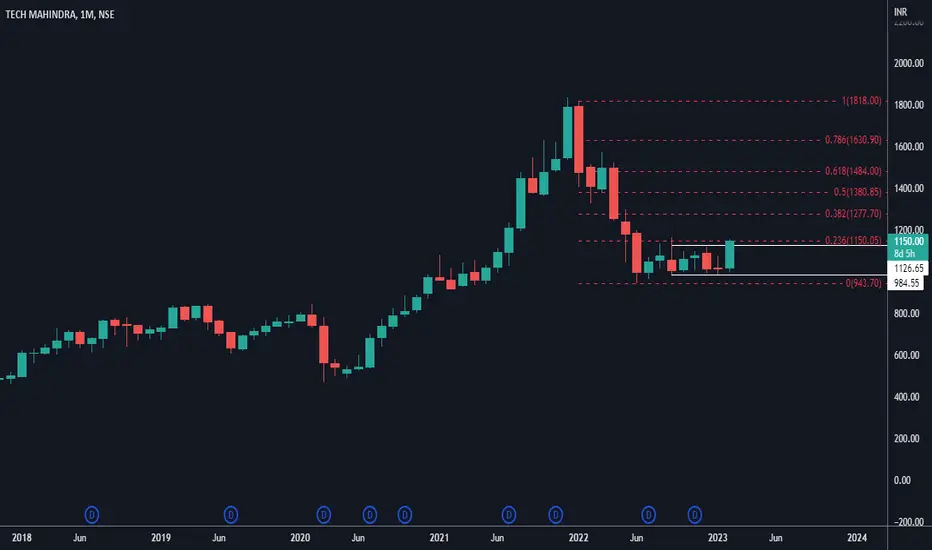
TECH MAHINDRA monthly range breakout PREMPTINGtech mahindra range breakout preempting
it index is strong and most negative news are priced in
on monthly basis its forming a marubozu candle
my sl is 940weekly closing basis
target 1277 1484
after falling forming range
on weekly basis range breakout has occur and this week i will be consider for confirmation if it closes above 1127 on weekly basis
KOTAK BANKA long setup can be played here in kotak bank. It has given a range breakout. Buy on dips in Kotak bank is suggested from here on with todays candle low as SL.
Entry- 424-428
Target- 438, 450.
SL- 427.
Disclaimer- This is just for educational purpose.
JAI SHREE RAM.

EMCURE - Fresh breakout ?It has broken out of a 3-month trading range and looking to hit fresh highs. On the Elliott Wave front, this seems to be a Wave 3 with potential targets above 2000.

EASY SHORT TO $1000Failed auction of the all time highs. local range support also lost.
$1000 or even $950 next.
Calculate Your Risk/Reward so you don't lose more than 1% of your account per trade.
Every day the charts provide new information. You have to adjust or get REKT.
Love it or hate it, hit that thumbs up and share your thoughts below!
This is not financial advice. This is for educational purposes only.

GBPAUDGBPAUD – 15m Range Breakout with Divergence Setup
Price was consolidating in a tight 15m range.
A clean breakout candle has closed outside the range, confirming momentum.

BTCUSD — Pre-London Session 🧭 Context
Heavy dollar buying is underway and the crypto market appears ready to exit its range-bound phase.
We’ve tagged the daily volume low at 106 463.30, a key structural mark, and next clear target under the weekly range is around 100 996, representing engineered liquidity.
Price could rotate to that zone today or tomorrow given the alignment of flows.
📈 Technical POV
We’ve never yet shifted price decisively higher — the recent range bounce failed to ignite momentum.
My hope was for range-bound expansion, but the market is telling a different story: adapt.
If price holds above the 106 463.30 node, bullish leg remains plausible, but if it closes below, acceleration to the 100 996 liquidity target is on the table.
🌍 Macro View
Crypto is under pressure as global capital rotates toward the dollar.
A stronger US Dollar Index (DXY) tends to suppress Bitcoin, since investors pull risk assets when the dollar climbs. Meanwhile, institutional flows into Bitcoin are mixed — despite headline ETF inflows, the macro drag of dollar strength and leveraged crypto exposure is creating headwinds.
tradingnews.com
🎯 Plan
Look for bull-back opportunities into the 106 463.30 node if price retests and holds.
But note the risk-to-reward is skewed: a break below invites faster movement toward 100 996.
Stay ready for a 1-hour structure shift to identify bias.
🧠 CORE5 Note
The market doesn’t wait for your opinion — it demands alignment.
Stay responsive. Stay disciplined.
— CORE5DAN
Institutional Logic. Modern Technology. Real Freedom.

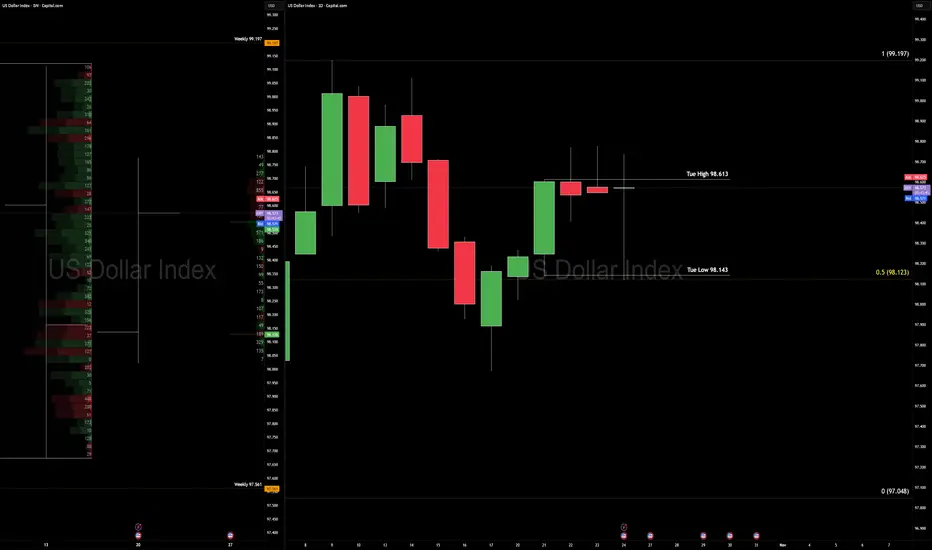
DXY — Triple Compression: CPI Meets a 3rd Weekly & 4th Daily Ins
The U.S. Dollar Index is locking in tight — 3rd consecutive weekly inside bar, and a 4th possible daily inside bar — as U.S. inflation holds firm and Japan’s core inflation uptick adds fuel.
Context
We’re locked in structural compression: three weeks of internal price action, and today presents a 4th daily inside bar formation.
Weekly key range: low 97.561 and high 99.197. Price is stuck in the mid-zone, patiently waiting.
For bias confirmation: Break of Tuesday’s 21 Oct daily candle low at 98.143 or high at 98.613 will signal directional bias.
Macro queue: Big data hits next week (inflation prints, central-bank focus). Volatility is coiled.
Technical
Weekly frame: Still inside the bearish range (97.561 – 99.197).
Daily frame: Bias leans bullish until the range breaks — think “bullish inside bar pending expansion”.
In symmetrical measures: Risk of overbought cognition; if today’s low holds and Monday fails to trade through it, we may see a higher low setup. Execution: Wait for clean breakout of the inside bar structure; use volume confirmation; avoid getting sucked into a false squeeze.
Fundamentals
U.S. inflation: The Consumer Price Index for September is published today (24 Oct) after delay due to shutdown.
Bureau of Labor Statistics +2
The Financial Express +2
Japan inflation: September core inflation rose to 2.9% YoY, moving above the Bank of Japan target and adding pressure to the JPY‐rate story.
Trading Economics
+2
Bloomberg
+2
Impact mechanism: Sticky inflation → reduces odds of immediate rate cuts → supports USD strength; yet structural squeeze in DXY means the market is holding its breath for breakout.
Plan & Mindset
Plan: Hold off trading until Monday’s price action gives clarity through breakout of the inside-bar structure. Then map cross-assets (EURUSD, GBPUSD) accordingly.
Mindset
Structure rules story. Don’t fight a tight coil. Today you “wait with purpose.” If price breaks, act decisively; if it breaks wrong, adapt quickly.
- Like waiting for the popcorn — you don’t eat the kernels while still heating.
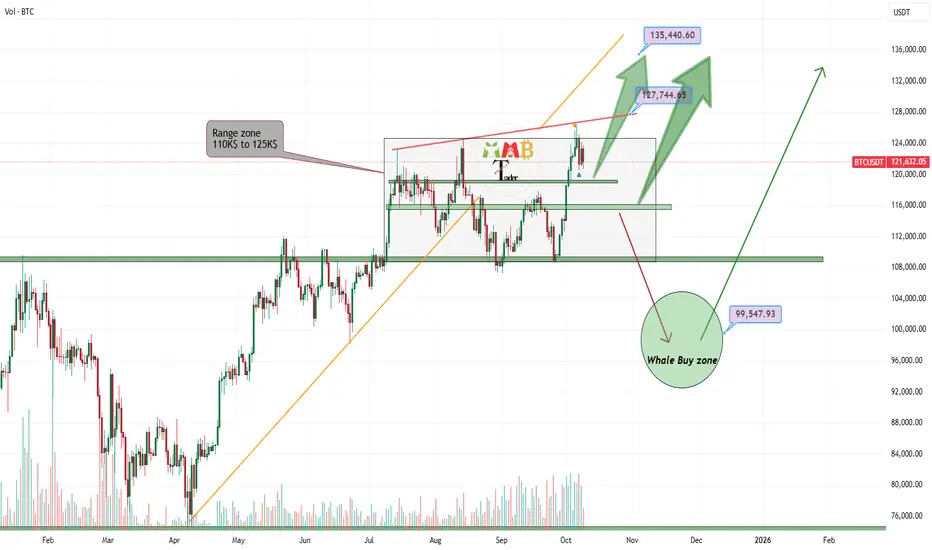
BTC still in range zone wait for breakout firstAs we can see price is still bounded with major support 110K$ and major resistance 125K$.
we need a valid breakout here on this range zone with high volume candle and at least +-3% breakout then the path pump to 135K$ or dump to 90K$ will continue.
also possibility of rise and pump now is a little more and it is 65% bullish one in my mind.
DISCLAIMER: ((trade based on your own decision))
<<press like👍 if you enjoy💚
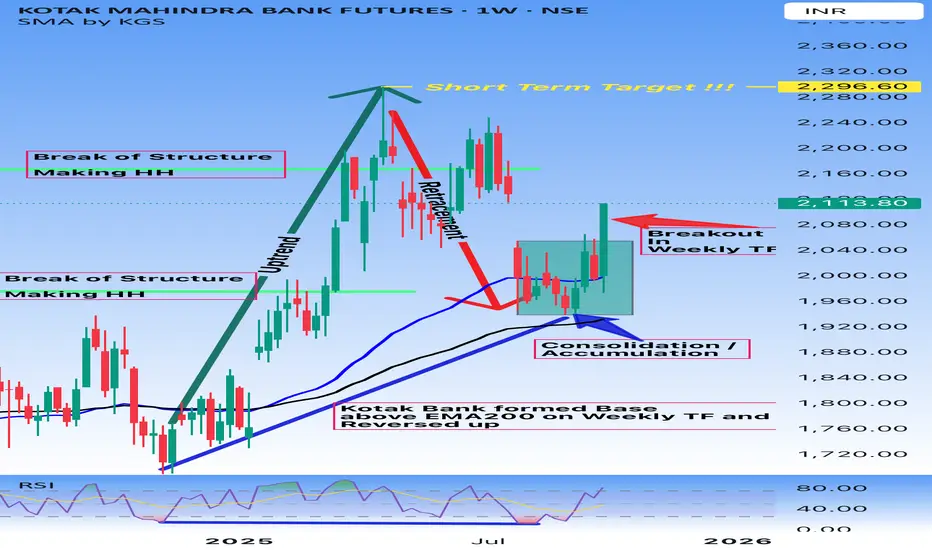
Buy KotakBank - Multiple confirmation - Technical Anaysis
Kotak Mahindra Bank Futures (Weekly Timeframe Analysis)
Current Price: 2,113.80
Technical Analysis:
1. Trend Structure
• Previous strong uptrend with Higher Highs (HH) formation.
• Experienced a retracement phase after topping out.
• Recently consolidated in a range, forming an accumulation zone above the 200 EMA (Weekly TF) and around 100 EMA.
2. Range Breakout Confirmation
• Range Breakout observed on the weekly timeframe after consolidation.
• Price sustained above EMA 200, showing strength.
3. Key Levels
• Support Zone: ₹1,880 – ₹1,940 (consolidation base).
• Resistance Zone / Short-Term Target: ₹2,296.60.
4. Indicators
• Hidden Divergence formed on weekly timeframe, the same area where accumulation happened & RSI bounced from oversold levels and crossed above 50, indicating renewed momentum.
• 100 EMA above 200 EMA shows the trend in favor of bulls.
🎯 Trading Plan:
• Bullish Bias: As long as the price sustains above ₹1,940–1,960 zone.
• Targets:
• Short-Term: ₹2,296.60
• Medium-Term: Higher levels possible if momentum sustains.
• Risk Management:
• Stop-loss below ₹1,880 (recent accumulation low).
Summary:
Kotak Mahindra Bank Futures has broken out from weekly consolidation after forming a strong base above EMA 200. The structure suggests the potential to move towards ₹2,296.60 in the short term, with RSI and price action both supporting bullish momentum.
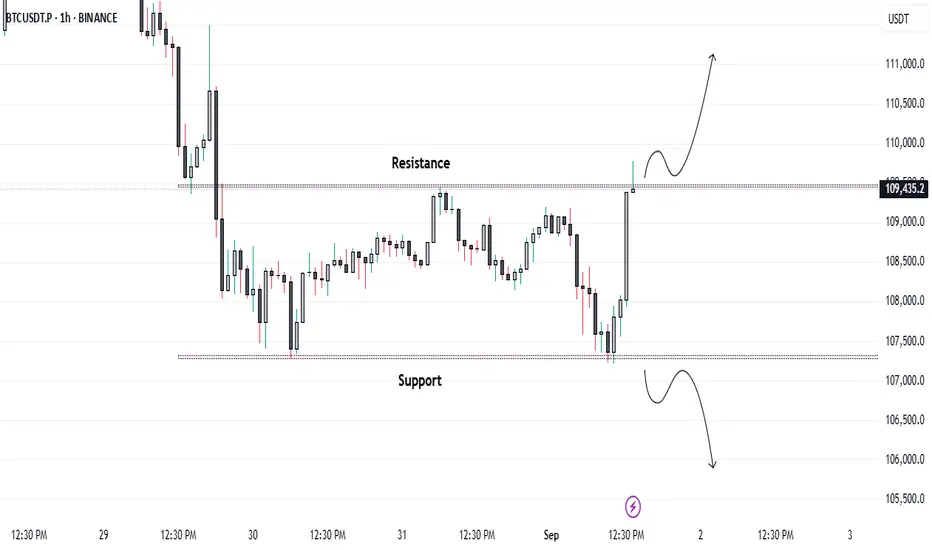
Bitcoin Breakout Watch: Key Levels Ahead...Bitcoin is consolidating in a tight range on the 1-hour timeframe and is showing strong momentum as it tests the $109,500 resistance zone. A decisive breakout and sustained close above this level could trigger a move toward the $112,000 mark, signaling bullish momentum building in the market.
Keep a close watch on volume confirmation for a stronger breakout signal. 📈
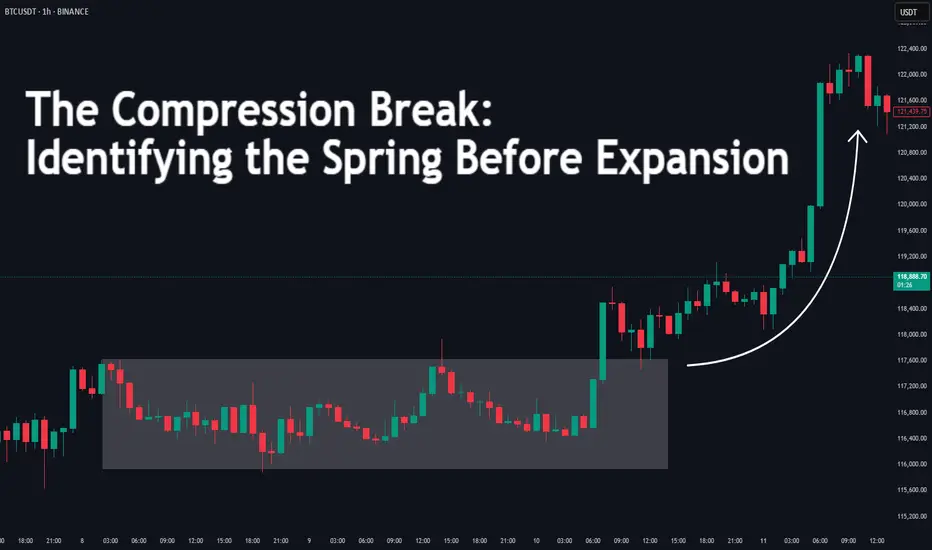
The Compression Break: Identifying the Spring Before ExpansionDifficulty: 🐳🐳🐳🐋 (Intermediate)
This article is for traders who want to recognize and trade explosive moves that form after periods of tight price compression. Perfect for those familiar with structure, volume, and volatility concepts.
🔵 INTRODUCTION
Price doesn’t move in a straight line — it breathes. It expands when there’s imbalance, and it compresses when the market is building energy. The most powerful moves often start with a compression phase — a tight, controlled price range — before a sudden breakout.
Learning to spot these “springs” before they snap can give you trades with excellent risk/reward ratios and clear invalidation points.
🔵 WHAT IS COMPRESSION?
Compression occurs when price volatility shrinks, and each swing becomes smaller than the last. It looks like price is being “squeezed” between converging support and resistance levels.
Common causes of compression:
Liquidity build-up before a major session open
Market waiting for a news release or key event
Institutional positioning before a drive
The tighter the range, the bigger the potential release.
🔵 WHY IT MATTERS
Compression is important because:
It reveals where the market is balanced and undecided
It creates a high-energy environment — a small push can trigger big moves
It offers tight stop-loss placement and clear breakout targets
Think of it like a coiled spring: the more it’s compressed, the more explosive the release.
🔵 HOW TO IDENTIFY COMPRESSION
1️⃣ Price Action Clues
Consecutive smaller candles with overlapping ranges
Lower highs + higher lows (triangle formation)
Reduced wick size in the final stages before breakout
2️⃣ Volume Clues
Declining volume during the squeeze
Sudden volume spike as breakout begins
3️⃣ Volatility Clues
ATR (Average True Range) dropping to local lows
Bollinger Bands narrowing (optional)
🔵 TRADING THE COMPRESSION BREAK
Step 1: Define the Box
Mark the high and low of the compression range. This will be your breakout reference.
Step 2: Wait for Volume Confirmation
Avoid jumping in on the first tick outside the box. Wait for a volume surge or strong close beyond the boundary.
Step 3: Trade in the Breakout Direction
Entry: After confirmed breakout close
Stop Loss: Inside the compression range
Target: Equal to the height of the compression box or previous swing high/low
🔵 EXAMPLE SCENARIO
Price compresses for more then 10 bars into a tight range
Volume steadily declines → ATR hits a local low
A big body bullish candle breaks above range high with 2× average volume
Entry at breakout close, stop inside range, target = box height projected upward or 1:2 RR
🔵 ADVANCED TIPS
Align with higher timeframe trend for higher probability
Watch for false breakouts (liquidity sweeps) before real move
Combine with order blocks or VWAP to refine entries
Use session timing — many compression breaks happen at market opens
🔵 CONCLUSION
Compression is the market’s way of loading a trade with potential energy. When you spot it, you’re seeing the buildup before the burst. Trade it with patience, volume confirmation, and proper structure, and it can become one of your highest-probability setups.
Have you traded compression breaks before? Share your best example in the comments!
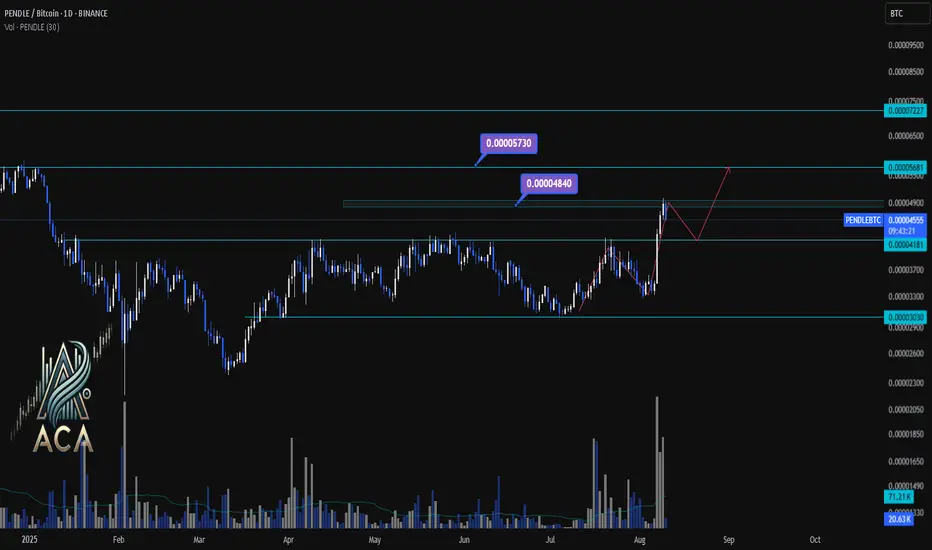
PENDLE/BTC Daily Chart Analysis | Momentum Building for the NextPENDLE/BTC Daily Chart Analysis | Momentum Building for the Next Move
🔍 Let’s dive into PENDLE/BTC and highlight the current technical landscape with key areas to watch for traders.
⏳ Daily Chart Overview
PENDLE/BTC recently broke above a multi-month resistance near 0.00004500, confirming strong bullish momentum on the daily timeframe. Volume surges are supporting this upward move, indicating increased market participation and renewed interest from buyers.
🔺 Bullish Scenario:
If the uptrend continues, look for a push toward the first target:
- 0.00004840 (major supply/target zone)
- On further strength, 0.00005730 is in sight as the next resistance.
Expect short-term consolidation or minor pullbacks before any strong breakout.
🔻 Bearish/Consolidation Scenario:
If sellers step in or the rally loses steam, support is found at:
- 0.00004181 (immediate level)
- If this breaks, look for deeper retracement toward 0.00003300 (structural support).
📊 Key Highlights:
- Daily breakout from a consolidation range signals bullish continuation potential.
- Volume spikes confirm genuine buyer interest at current levels.
- Major upside targets: 0.00004840 and 0.00005730.
- Critical downside supports: 0.00004181 and 0.00003300.
- Price action may oscillate (range/consolidate) between the support and resistance before a major move.
🚨 Conclusion:
Momentum favors bulls as long as price holds above 0.00004181. Watch for a confirmed breakout above 0.00004840 for additional upside. Stay nimble—volatility will likely provide both breakout and pullback opportunities.
Keep an eye on PENDLE/BTC and PENDLE/USDT📈📊
AAPL Set for a Breakout? | Technical Checklist & Projections
▍Observation & Context
▪ AAPL has been moving sideways within a clearly defined range for the past three months .
▪ On July 07 , price tested the range resistance decisively, showing some interest in the upside.
→ Let's first explore the bullish breakout scenario.
▍What Makes a Good Breakout ?
Before we talk about targets, let’s define what a good breakout looks like:
▪ A strong bullish candle breaking through the resistance in one clean move .
▪ Followed by a retest of the broken resistance (now acting as support).
▪ After that, price should ideally:
1. Form a higher low , and
2. Reach the next resistance or target zone before pulling back.
▍Target Price – Method 1: Extension of the Range
🔹 Near-Term Target: 1.5–1.618x Fibonacci Extension
- A common zone where momentum often pauses.
- Aligns with the previous high from the last downtrend.
- Technically, to reverse a trend, price needs to take out the previous high. Even though the range has “cooled off” the pressure, we still respect that level.
🔹 Ultimate Target: 2x Range Extension
- Represents a 100% projection of the previous range.
- Commonly used in range breakout targets.
🔹 Dream Target: 2.618x Fibonacci Extension
- Aligns with the start of the last downtrend , adding significance to the level.
- Often marks the exhaustion point of strong trends.
▍Target Price – Method 2: Projection from Higher Low
Note: The new higher low is not yet confirmed at the time of writing. The levels below assume an upward breakout without dropping below 207.22 . However, the same logic can be applied once the higher low forms.
🔹 Near-Term Target: Same as Method 1
🔹 Ultimate Target: 100% Projection of Prior Swing
- Projecting the prior swing (from previous low to recent high) from the new higher low .
- This level also aligns with the 1.5–1.618x Fibonacci extension of that swing, increasing its significance.
🔹 Dream Target: Another 100% projection
- Rare, but happens when momentum is very strong .
- In such cases, price might skip any retracement and launch directly into a second leg , equal to the previous swing.
- Here, the level aligns perfectly with the start of the last downtrend , just like the 2.618x extension in Method 1.
▋Mental Notes
▪ No one knows for sure if the breakout will be real or fake. But when it happens, knowing what to look for and where price might go next gives us a clear plan of action .
▪ The market will always find ways to surprise. Stay open and follow the flow.
▋Not Financial Advice
The information contained in this article is not intended as, and should not be understood as financial advice. You should take independent financial advice from a professional who is aware of the facts and circumstances of your individual situation.

BAAP OF BANKSSBI fut breaking out of weekly range as well strong resistance zone of 800-802 with three indicators turned positive.
Shortcovering seen in call options with highest OI on 800.
Risk:Reward = 1:1.5
Could b bought with mentioned stoploss & target.

SYSTEM FAAD DENGEYes, IndusindBank Fut system faad dega.
Indusind Bank Fut is trading inside 18th june's candle & its about to break out of it on daily/hourly charts wih good OI & positive cross overs in 3 other indicators.
Could b bought above 854.50 with stoploss of 813 & target of 950
Risk:Reward = 1:2
Buy n hold in july series, sysem faad dega.

Range breakout | Impulse of bull starthi Traders,
1. The swing formation is solid
2. BEL has taken the ascending trend line support.
3. The the range bound is weekly has broke upward, leading to impulse wave of bull trend.
4. Projected Target 1 and Target 2 with 20% and 40% returns from the CMP with 1:81 and 1:4.01 risk reward ratio respectively.

Intel - This might be the bottom!Intel - NASDAQ:INTC - might create a bottom:
(click chart above to see the in depth analysis👆🏻)
For almost an entire year, Intel has been consolidating at a major horizontal support. Considering the previous significant bloodbath, Intel might soon find its bottom, which is inevitably followed by a major bullish reversal. After all, market structure is slowly shifting bullish.
Levels to watch: $20.0, $25.0
Keep your long term vision!
Philip (BasicTrading)

Crude oil futures Trade the range In this video I look at the current range that we are in and I have laid out a plan in the scenario that we break that range to the upside and what we could possibly expect .
I have given some reaction zones where I anticipate price to react when we reach there .
I have used Fibonacci, volume profile, and vwap in this video .
Thankyou for your support

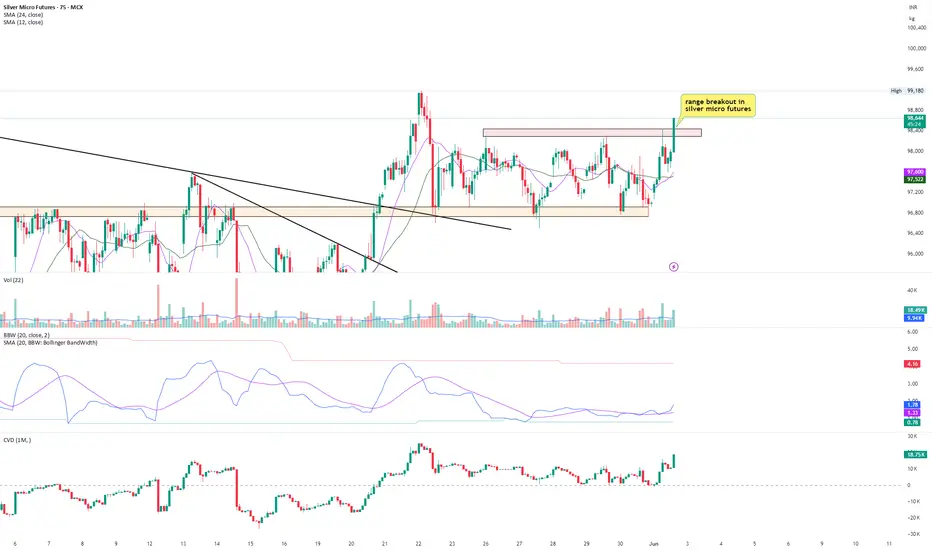
Silver micro: range breakoutSilver micro futures are trading in range for approx 13 days now. Currently trying to break the range with high relative volume. If it sustains above 98450, breakout can continue and range expansion in prices may happen. The stoploss at current price is very small as compared to the probable reward. Very high probability trade with a smaller risk.
Silver micro is in uptrend. and this is continuation breakout trade.
Weekly Range bound | 4H swingFellow trader,
Eicher motors has broken the range bound market in weekly timeframe, and now the market is re-testing.
Aggressive entry : Whoever enter the market immediately after the breakout
Conservative entry : Whoever enter after the market re-test.
The weekly range bound breakout target is 5684 & the SL for the same is 4548
Now in the re-test, there is a clear formation of a swing in 4H/1D timeframe, after a inverted H&S pattern breakout in 1H timeframe consider to enter the trade based on this swing.
Considering the pattern of Weekly or 4H time frame trade can be taken, the SL and Targets are in the chart.
The Risk : Reward ratio for the swing is 1:4.47
Sensibull : sbull.co

BHARTIHEXA : Short Term Trade (1-3 months)#bhartihexa #chartpattern #flagbreakout #rangebreakout #breakoutstock
Bharti Hexacom : short term trade
Duration (1-3 months)
>> Flag structure in monthly
>> Range consolidation Breakout
>> Breakout + retest done
>> Good strength in stock
>> Potential upside upto 50%
U can consider entering at cmp and keep building positions in retracement or pullbacks.
Disc : Charts shared are for Study purpose only, not a Trade recommendations

Update to Dow Jones Industrials Time At Mode Back in 2015 I had published a chart with annual data for the Dow Jones Industrials. I will provide a link at the bottom.
The research for this patterning is something I did myself by hand using pencil and paper back in the 1980's. These patterns show up in all time frames.
There is plenty of room to enhance the research on this technique and a group of us gather in the chat rooms here at TradingView to discuss new trades that set up and point out when trades expire.
Notice how these two grey boxes (which are both 50% drops in price) that expand wider in time from the 1960's to the 1980's and the 2000-2010's had a multi-year trend, followed by a monster crash (1987 was 40% and 2000 was 37%) and then just two+ years later there was a secondary bear market of 20% in 1990 and 22% in 2022. Keep in mind this is just for the DJ:DJI and not the Nasdaq Composite or S&P500 which were greater corrections.
The 11-year time frame of the 1999-2011 pattern allows for an 11-year rally from 2012 (which was year 1 of the 11-year rally) shows that time expired. As you can see from the 1943-1962 trend, a smaller 5-year mode formed at the end of the 20 year trend and then the market peaked in 1972-1973 when time expired for the second, smaller mode.
I had to reconstruct this chart after the data for the previous chart changed symbol. See the link below to see the original.
I look forward to your additional research onto this pattern and its implications to the idea that we are in a similar period to 1993-1994 with rally years of 1996, 1997, 1998, 1999 and 2000 ahead of us.
All the best,
Tim
October 19, 2024 3:31PM EST
