What is Dollar Cost Averaging? Investing BasicsWhat is Dollar Cost Averaging? 📈
Dollar cost averaging is a smart strategy to build wealth over time by investing regularly, without stressing over the perfect moment to buy or sell.
By committing to consistent investments, you often outperform attempts to predict market highs and lows.
> "If you enjoy dedicating six to eight hours a week to investments, go for it. Otherwise, stick with dollar cost averaging into index funds."
> Warren Buffett 💡
Key Concepts
Dollar cost averaging spreads out your purchases to lower the impact of poor timing.
It's ideal for long-term plans.
Looking back, using dollar cost averaging on S&P 500 funds during the 2008 recession turned out to be a wise move.
What Does Dollar Cost Averaging Mean?
Dollar cost averaging, or DCA, involves putting a fixed amount into an investment at regular intervals, no matter the market conditions.
This approach lowers your average purchase price in downturns and shields you from wild swings. You'll buy shares at both low and high prices, evening out costs over time. 💹
Plus, it saves you from constantly monitoring the markets. With a set schedule, you ignore short-term fluctuations.
Common options include retirement accounts like 401(k)s or IRAs in the US, or ISAs in the UK.
Dollar Cost Averaging in Action
Imagine earning $2,500 monthly and setting aside $250 for your retirement. You could split it: $125 into an S&P 500 index fund and $125 into a bond fund.
Each month, that $250 gets invested automatically, regardless of prices. Over the year, you'll catch highs and lows, averaging your costs. 📅
Dollar Cost Averaging Versus Lump Sum Investing
When you have a chunk of cash ready, decide between gradual DCA or dumping it all in at once.
Consider:
Your comfort with risk
Your discipline to follow through
Your time frame for holding the investment
Lump sum means investing everything immediately, often after a windfall like an inheritance or asset sale, or when you spot a market dip.
You can diversify: spread it across stocks, funds, or indexes to reduce reliance on one asset.
Both methods work, so pick what fits you. If risk makes you nervous, DCA eases you in slowly. But if you're okay with ups and downs, especially early in your career, lump sum might boost returns faster. ⚖️
Benefits of Lump Sum Investing:
Research from Williams and Bacon found lump sum beats DCA in returns about two-thirds of the time.
It maximizes market exposure right away, capturing more potential growth (and drops).
Drawbacks of Lump Sum Investing:
Markets are unpredictable, heightening risk.
You might get too emotionally involved, leading to hasty choices.
It's not built for ongoing consistency.
Verdict: Dollar Cost Averaging Versus Lump Sum
For top performance, lump sum often wins with higher potential returns.
But if risk tolerance is low, DCA lets you ramp up gradually, starting small.
As you grow confident, mix in bigger investments at key moments.
The key? Craft a solid plan, set achievable goals, and match your risk level. 🛡️
Benefits of Dollar Cost Averaging
DCA is straightforward for beginners and experts alike. Here are top perks:
✅ Skip timing the market: Markets are hard to predict, so DCA avoids bad guesses.
✅ Less emotion: It keeps fear or greed from clouding judgments during dips.
✅ Long-term wins: Over years, markets trend up, turning crashes into buying chances.
✅ Set it and forget it: Automate for effortless investing.
✅ Builds good habits: Regular contributions grow wealth steadily with lower risk.
Pros of Dollar Cost Averaging:
➕ Spreads risk by dividing investments over time.
➕ No need to predict market moves.
➕ Curbs impulsive decisions.
Cons of Dollar Cost Averaging:
➖ Might miss big gains from low-price opportunities.
➖ Requires discipline to avoid tweaking the plan during tempting dips.
Dollar Cost Averaging Frequency
Choose what suits your lifestyle: daily, weekly, monthly, or less often.
1. Daily Dollar Cost Averaging
Invest every day to catch every price swing. You'll snag dips but also highs, averaging out long-term. It keeps you engaged with market news. 🌟
2. Weekly Dollar Cost Averaging
Great if paid weekly. Weigh costs: some platforms charge for card funding, but bank transfers are often free.
3. Monthly Dollar Cost Averaging
Popular choice, aligning with salaries or pensions. Set auto-deductions for hands-off ease. Drawback? You might skip intra-month bargains.
Pick a rhythm that sticks for the long haul.
Dollar Cost Averaging Formula
No complex math needed, but track your average like this:
Average Buying Price = Total Amount Invested / Total Shares Owned
Simple for monitoring progress! 📊
Dollar Cost Averaging with S&P 500 ETFs
The S&P 500 is perfect for DCA: diverse and easy. Invest fixed amounts monthly into an ETF, skipping stock-picking stress.
Even stock enthusiasts can DCA into indexes like S&P 500 or FTSE 100 for balance.
Stick with Dollar Cost Averaging in a Bear Market
Dips feel scary, but they're prime for DCA: buy more shares cheaply to drop your average cost before rebounds. 🐻
Focus on indexes over single stocks, as not all recover. Review holdings regularly to ensure they align with goals.
Recap
Dollar cost averaging is a reliable path to growth: simple, market-timing-free, and geared for lasting success. It reduces risk through steady buys but may lag behind full-market strategies like lump sum. Start today and watch your portfolio thrive! 🚀
Recovery

Gold Eyes Further Gains After 61.8% Retracement HoldGold is still trading higher since the start of the week. And when looking at the most recent drop toward the 4658 area, it appears to have been a three wave retracement, a corrective move right into the 61.8% level. The current rebound, although small, looks impulsive and is now trying to break out of the corrective channel. This suggests there is still a good chance that gold could retest the 5100 area. But keep in mind that the move up from the February lows can still be a countertrend corrective rally, and the broader correction from the all time highs is most likely not finished yet.

Explanation of a Risk of a Flash CrashA risk of a Flash Crash is not the start of a Bear Market. Flash Crashes are uncommon in indexes and more common in individual stocks during earnings season and when there is a major negative news item that is unsupported by actual hard data.
Retail news creates fear and uncertainty often with information that is not always accurate or that is stated in a way to create fear of a NON EVENT.
A non event is something that might happen.
Flash Crashes also occur on individual stocks when HFT AI misinterprets news.
Oftentimes, a company's earnings announcement may be minimally lower than estimates but the HFT AI gaps it down hugely.
In these situations, Dark Pool Buy Side will move in and support the stock by buying shares at bargain prices as the stock value is below the company fundamentals. This happens often.
When you can recognize these patterns of huge gap downs and then recovery a few days to weeks later, there is the opportunity to trade the stock for swing style or platform position style trades to net good profits from the Flash Crash recovery.
April 2025 had an Index Flash Crash that recovered quickly with Buy Side Institutions buying index components quickly and driving stock prices back up to the lows of the fundamental level. The indexes then resumed their uptrends with minor corrections.

Aussie Resumes Its RecoveryAussie came nicely to the downside in the last few months with clearly three waves down from the highs, so apparently this was a correction, a completed one, after a very nice rebound from the 0.6420 area, from where we can now see impulsive move that broke the trendline and even coming back above the previous triangle swing resistance. This certainly looks like a turning point, and ideally it will take us even higher after some new retracement, so watch out for more upside while the market trades above the November lows.
Even on the daily chart you can clearly see some very choppy and messy price action for the last few months, so sooner or later we think that bulls are ready to hit new highs,, and maybe we are now at the beginning of this thrid wave up; C or 3.

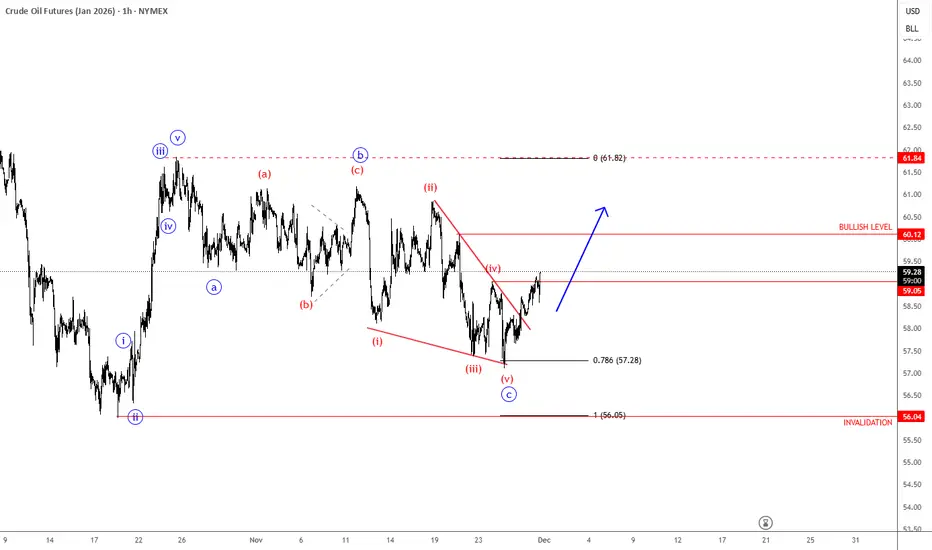
Crude Oil Has Finally Finished An Intraday Corrective SetbackCrude oil made a very strong rebound back in mid-October with an impulsive move of more than 11%, while the current retracement from 62 is very slow, which still suggests a counter-trend movement despite the weakness now retesting the 78.6% support levels. We can still see three waves down, and ideally subwave c is coming into a potential support zone, so a rebound can still happen while the market trades above 55.96 invalidation.
Looks like Crude oil is finally on the way back to October highs, as we see a sharp and impulsive rebound from the 78,6% Fibonacci retracement after a completed wedge pattern. So be aware of more intraday gians, especially if breaks back above 60 level, just watch out for pullbacks.
AFTER THE BREAKDOWN 105K IS THE KEY LEVEL FOR RECOVERYWe have seen an unexpected breakdown in BTC, even despite the positive news about the China deal. BTC continued to decline further, although the data has generally been pointing in the right direction.
At the moment of writing, BTC is still in a downtrend. However, the $105K level could be a key point that triggers a potential recovery, depending on how the upcoming data unfolds.
We will continue to monitor whether BTC can enter the $105K zone in the coming time frames.

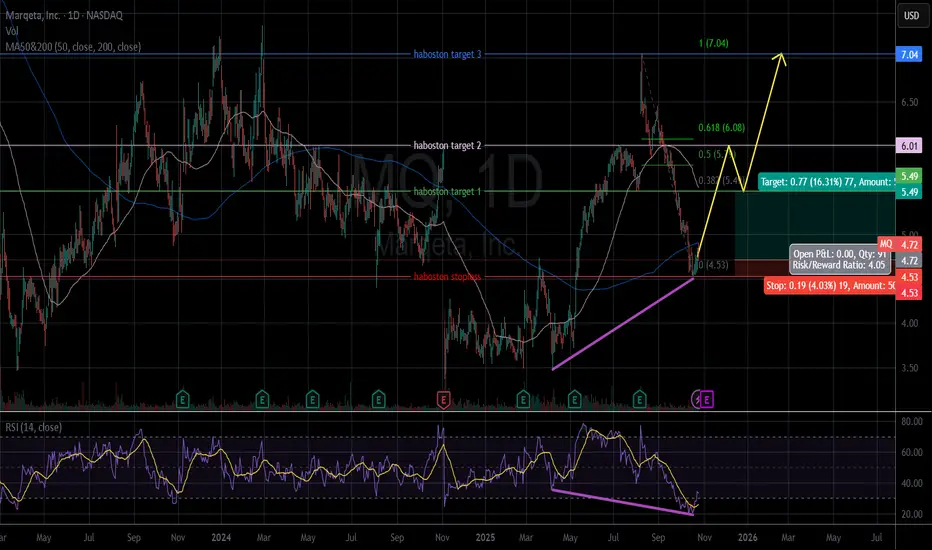
MQ - Bullish divergenceAfter MQ oversold, its price is recovering with very clear Bullish divergence sign.
The price closed 10.24.2025: $4.72.
Price target: $5.49/ $6.01/ $7.04
Stop loss: $4.53.
IMO, amateur trader.
Good luck!
EURGBP Is Looking For A Larger RecoveryEURGBP Is Looking For A Larger Recovery with a complex correction from a technical point of view and by Elliott wave theory.
EURGBP has turned around strongly this year and even broke above the downward channel connected from the 2023 highs. This suggests that wave C has ended at the lower side of a very big triangle, and the pair could still be recovering within subwave D. It may eventually reach the upper side of the pattern around 0.89 within W-X-Y formation, where wave Y can now be in play; ideally it will reach higher prices soon with break out from current triangle.

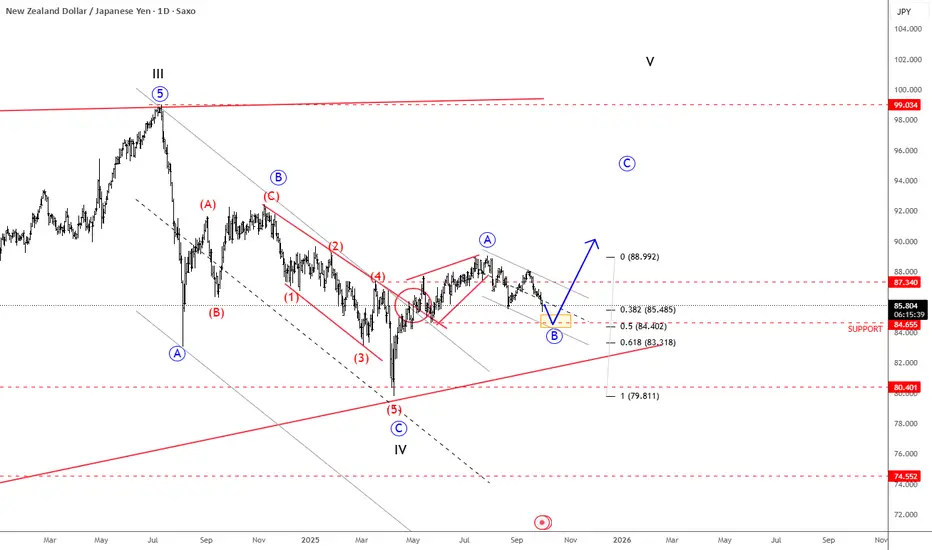
NZDJPY Is Forming A Bullish SetupNew Zealand dollar turned up against the Japanese Yen since April, when we saw a strong rebound from 80.40 support, a key level going back to March 2023. The recovery is quite strong, and it looks like a leading diagonal pattern into wave A; so it's a motive wave structure that already pushed above the 87.34 resistance, which is a strong bullish signal, suggesting more upside ahead. So if we are correct, then current retracement is a contra-trend move; possibly wave B that has a nice support at 85-84 area, which is not that far away, so we may get a new bounce in a few weeks; ideally an impulse, out of a current downward channel.
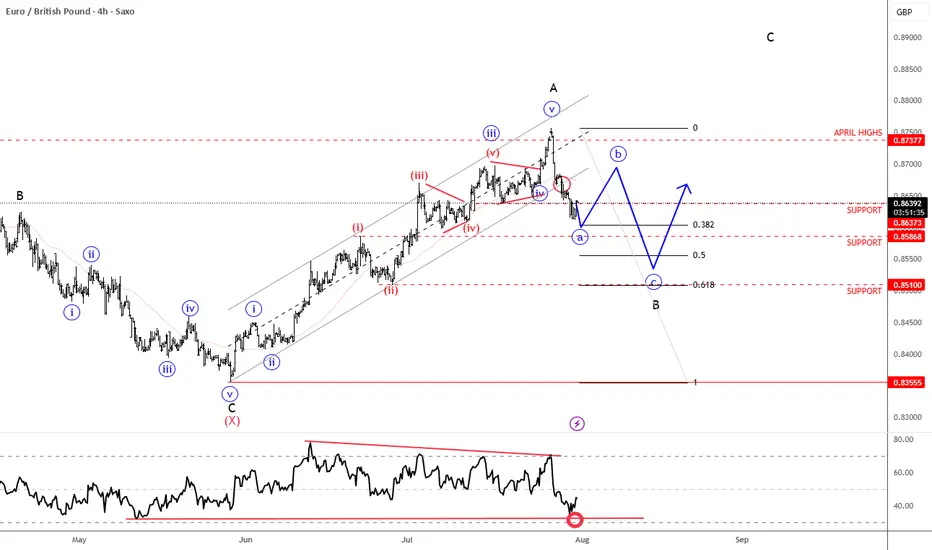
EURGBP Steps Into A Correction Within Ongoing RecoveryEURGBP is sharply down after reaching April highs for wave »v« of an impulse into wave A. As expected, the pair is now unfolding a three-wave abc corrective setback within higher-degree wave B. Currently, EURGBP is breaking below the channel support line in a sharp and impulsive projected wave »a«. A corrective recovery in wave »b« may follow, considering that RSI is already at the lower side of its range. Overall, we are still tracking this correction toward the 0.85x support area, which could act as a base before a potential bullish continuation higher into wave C.
AMP - Set for a comeback?After a troublesome decade, is AMP Limited set for a recovery?
Our Bullfinder-official Team has identified a potential opportunity within ASX:AMP
If price can hold above the $1.220 mark, there may be potential for a re-rating of momentum to 'bullish'.
We would like to note however that below ~$1.220 significant bearish continuation risk comes into play.
We're inspired to bring you the latest developments across worldwide markets, helping you look in the right place, at the right time.
Thank you for reading! Stay tuned for further updates, and we look forward to being of service along your trading & investing journey...
Disclaimer: Please note all information contained within this post and all other Bullfinder-official Tradingview content is strictly for informational purposes only and is not intended to be investment advice. Please DYOR & Consult your licensed financial advisors before acting on any information contained within this post, or any other Bullfinder-official TV content.

The Stock Market (SPX) Will Also RecoverGreat news my dear friends, reader and followers, truly great news.
The S&P 500 Index (SPX) is now reversing after challenging a strong support level. This level is the 0.618 Fib. retracement for the bullish wave that started after the October 2023 market low. A strong bounce is visible as soon as this level was hit.
The correction is a classic ABC and the C wave is very steep. When a move is really strong, great force, it can't last that long. So the drop happened all at once, fast, and this means a fast end as well as a strong reversal, but the reversal will not be the same.
We are more likely than not to experience a long drawn out recovery, higher highs and higher lows long-term. Higher prices next.
This is the main support level, 0.618 around 4885. If this level breaks, the next strong support sits at 4540. We are going up.
It is not only Bitcoin and the Altcoins, the stock market will also grow.
The correction is over.
Total drop amounts to a little more than 21%.
This is huge and more than enough.
The bears are satisfied. The bears are done. A bearish wave is followed by a bullish wave.
Short bearish action, long bullish action.
Thank you for reading.
Namaste.

Stoploss of 109500 intact!Immediate Support 114200 - 114300
If 109000 is broken, we may witness heavy selling
pressure dragging the Index towards 105000 - 106000.

CNXMET : Nifty Metal index shows the sign of recoveryWhile most sectors in Indian market are still in down trend, Nifty Metal index(CNXMET) shows signs of trend reversal. This is a positive sign in at least one of the Indian sectors.
Note: It is always a risk to go against the larger market trend, Nifty and Sensex are still in down trend. This analysis is for eduacational purposes only, do not trade based on this study.

AUDJPY Is Recovering After The Wedge PatternAUDJPY pair is sharply and impulsively recovering after we spotted the wedge pattern, so it’s now rising in minimum three waves A/1-B/2-C/3 that can retrace the price back to the starting point of the wedge pattern and back to 99-100 area, especially if we consider an unfilled GAP at 98.35 level. Currently we can see it making a five-wave impulse into wave A/1, so after corrective pullback in wave B/2, be aware of a bigger rally within wave C or maybe even wave 3 if goes decisively above 100 area.
The ending diagonal (wedge) pattern is a special type of wave that occurs in wave 5 of an impulse or wave C of a correction. An ending diagonal pattern is a type of pattern that can occur at the completion of a strong move. It reflects a “calming” of the market sentiment such that price still moves generally in the direction of the larger move, but not strongly enough to produce an impulsive wave. Ending diagonals consist of five waves, labeled 1-2-3-4-5, where each wave subdivides into three legs. Waves 1 and 4 overlap in price, while wave 3 can not be the shortest amongst waves 1, 3 and 5.
The reason why they are so interesting is because they are indicating a reversal, usually a strong one, which can retrace the price back to the starting point of the pattern.

USDollar Is In Higher Degree Recovery ModeDollar Index with ticker DXY has turned bearish after the corrective rally stopped at 105.70-106, an important resistance area at the end of June. Since then, the price even accelerated lower through summer so it appears that a bearish impulse, but with current sharp bounce out of an ending diagonal on 4h TF, we believe that correction is now in play. Notice thats a very sharp leg up, so its wave a, still first leg of a minimum three-wave a-b-c recovery that can take index back to 61.8% Fib, near 104 which can be very strong resistance for the next sell-off, especially if we consider that this can be wave 2 rally.

Awaited Dollar Rebound, Too Expensive FrancCHF
- Market Internals
- SNB doesn't like it high
USD
- Strong GDP data. Claims were released slightly below the cons.; ISM PMI positive expectations
- Oversold dollar due to exaggerated cut expectations
- Bullish CFTC
Technical & Other
Setup: TR(B)
Setup timeframe: 4h
Trigger: 1h
Medium-term: Down
Long-term: Down
Min target: Local mirror level, 3R
Risk: 0.22%; 1R
* 1st entry 0.5R near the down band of the local range (buy limit); 2nd 0.5R when 1h closed above DMA(10)

Fall Rally Patterns Setting Up: GMNYSE:GM was driven down way below its fundamentals by panicky retail. It is now back up into its fundamental level, well ahead of the Fall Rally. The fast recovery indicates that the selling was not aligned with fundamentals. Auto sales have an annual cycle with the highest number of sales in the final quarter of each year.

AVAXUSDT gives Bullish indicationsAVAXUSDT has finally broken out of the consolidation zone that has been developing since early August. On the weekly timeframe, the market formed an inside bar pattern, and the price has now surged above it, signalling a bullish outlook. Like many altcoins, AVAXUSDT has tested historical lows, revisiting levels from November 2023, where a significant price surge previously occurred. On the 4H timeframe, the price action has also broken through a triangle pattern, marking the end of an accumulation phase around 20.00 and indicating a potential bullish move. The market may retest the channel border and upward trendline. The target is the resistance zone around 27.50

USTech possible correctionUSTech may produce a temporary pullback before continuing the recovery to the up side. If the price drops down in the 18500 - 18700 range you can look for entry conditions to indicate a Buy entry but also be cautious at that time - if the price breaks below those supports, it can go lower to retest the 17250 - 17750 range

NZDUSD Is Looking For A Bigger RecoveryLooking at the 4-hour time frame of the Kiwi with ticker NZDUSD, we can see a strong rebound after a completed final subwave “v” of C of (C), as Zealand beat jobs data, so seems like a new three-wave A-B-C rally can be in play within higher degree wave (D) that can recover the price back to the upper triangle line. Wave A looks to be finished after RNBZ delivers surprise 25 BPS rate cut to 5.25% today, so seems like it’s now making a pullback in wave B that can retest 0.59x support area before a continuation higher for wave C towards 0.61 – 0.62 resistance zone.

German Bund Is On The Rise, So As EURUSD PairWe talked about a bullish turn on German Bund back on June 20th, where we mentioned and highlighted more gains within wave C of an A-B-C rally, which can also recover the EURUSD pair.
As you can see today on August 05, German Bund is extending strongly higher within a five-wave bullish cycle for wave C with space up to 140 area. At the same time EURUSD is also nicely recovering due to a positive correlation and with still bullish Bund, EURUSD can easily see more upside.

TOTAL - An Overview on the crypto marketcap#TOTAL #Analysis
Description
---------------------------------------------------------------
+ After a clear bounce from the support, another drop is occurring, which is normal.
+ We also have a strong support line that is providing significant support.
+ As long as the market cap remains above the horizontal and trendline support, there is hope for an upcoming bullish market.
+ A breakdown from this support zone could lead to further declines in the market.
---------------------------------------------------------------
Enhance, Trade, Grow
---------------------------------------------------------------
Feel free to share your thoughts and insights.
Don't forget to like and follow us for more trading ideas and discussions.
Best Regards,
VectorAlgo
