USDCHF Wave Analysis – 24 December 2025
- USDCHF broke support level 0.7885
- Likely to fall to support level 0.7800.
USDCHF currency pair recently broke the support level 0.7885, which is the lower border of the multi-month sideways price range inside which the price has been moving from June.
The breakout of the support level 0.7885 accelerated the active impulse waves iii and 3 – which are a part of the extended downward impulse sequence (C) from May.
Given the strong daily downtrend and the bearish US dollar sentiment seen today, USDCHF currency pair can be expected to fall to the next key support level 0.7800.
Rectangle

INTA NASDAQ:INTA
INTA has made a formation of RECTANGLE with RSI supporting ABOVE 60 along with MACD cross.
Once price closes above $47.55 we can expect price upto $59. We can trail stop loss at $41.3.
which is showing risk to reward is 1:2.
Analysis is made to best of my knowledge, if you are taking trade please make your own analysis . Thank you

Selena | XAUUSD Weekly Range Expansion | Market MoveFOREXCOM:XAUUSD
Price previously consolidated inside multiple range zones before delivering strong bullish momentum. The latest breakout above the prior range high confirms continuation strength. A shallow pullback or retest into the broken structure remains the preferred scenario before further upside expansion.
Key Scenarios
✅ Bullish Case 🚀
Acceptance above the previous range high keeps the trend intact, with continuation toward higher resistance levels.
🎯 Target 1: 4,475
🎯 Target 2: 4,500+
❌ Bearish Case 📉
Failure to hold above the breakout zone may lead to a corrective pullback toward channel support and prior demand.
🎯 Downside Target: 4,325 – 4,300
Current Levels to Watch
Resistance 🔴: 4,475 – 4,500
Support 🟢: 4,350 – 4,300
⚠️ Disclaimer: This analysis is for educational purposes only. It is not financial advice.

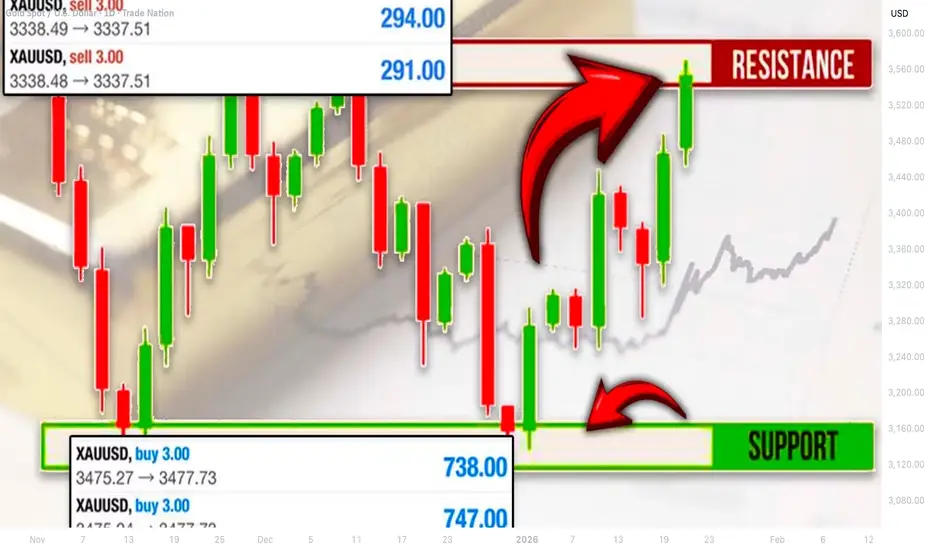
How to Trade Sideways Price Action on GOLD XAUUSD
Turn boring ranging market into your biggest advantage.
The truth is that consolidation trading can be even more profitable than trend following trading Gold XAUUSD.
In this article, I will teach you a simple consolidation strategy to day-trade sideways price action.
In order to trade a ranging market, first, you should learn to identify that correctly.
This simple rule will help you to identify that on Gold on any time frame. (for this strategy, we will look for a consolidation on a 4H time frame strictly )
Gold price should simply stop updating:
lower lows and lower highs (if the trend was previous bearish),
higher highs and higher lows (if the trend was previously bullish).
Examine a price action on Gold on a 4H time frame:
Trading in a bearish trend, we can easily identify 2 periods of consolidation.
The price temporarily started ranging, not managing to update lower lows in the first instance and lower lows and lower highs in the second one.
Such a market behavior is a clear indication of a sideways price action.
After you confirmed a consolidation on Gold, you will need to identify its boundaries .
Usually, the price will start respecting some horizontal support and resistance, forming a range.
I have underlined the boundaries of 2 ranges that we spotted.
Once you identified a sideways price action on Gold, with the absence of high impact fundamental news, such a price behavior will most likely continue .
The price will continue respecting the boundaries of the range, falling from its resistance and growing from its support.
You should patiently wait for a test of a support or resistance of the range first.
In our example, we see a test of a resistance.
We can expect that the price will drop from that.
But the problem is that the underlined resistance is quite wide and from such a perspective, we can not predict the exact level from where it will drop.
Multiple time frame analysis will help you to spot an accurate entry signal.
I suggest looking for a channel or a wedge on an hourly time frame.
The price formed a rising wedge on an hourly.
Your signal to sell will be a breakout and an hourly candle close below its support.
It will indicate a highly probable bearish movement to the support of the range.
After a confirmed violation of a trend line, open a sell position immediately or set a sell limit order on its retest.
Stop loss should be above the highs of the wedge/channel.
Take profit will be the upper boundary of a range's support.
76 pips of profit were made.
Using this strategy, we could easily predict a previous bullish movement from a support.
A bullish breakout of a resistance of the wedge provided a strong confirmation.
Entering on a retest of its broken resistance, be TP should have been based on the lower boundary of the range's resistance.
Stop loss should have lied below the lows of the wedge.
Consolidations may last for days, weeks and even months on Gold.
Not trading it, you will miss a lot of profitable opportunities.
This strategy will help you to trade a sideways ranging market easily.
❤️Please, support my work with like, thank you!❤️
I am part of Trade Nation's Influencer program and receive a monthly fee for using their TradingView charts in my analysis.
SYNGENE INTERNATIONALSyngene International Ltd., incorporated in the year 1993, is a Mid Cap company (having a market cap of Rs 26,553.71 Crore) operating in Pharmaceuticals sector.
Syngene International Ltd. key Products/Revenue Segments include Contract Research & Contract Manufacturing (CRAMS), Other Operating Revenue and Scrap for the year ending 31-Mar-2025.
For the quarter ended 30-09-2025, the company has reported a Consolidated Total Income of Rs 926.00 Crore, up 3.79 % from last quarter Total Income of Rs 892.20 Crore and up 2.04 % from last year same quarter Total Income of Rs 907.50 Crore. Company has reported net profit after tax of Rs 67.10 Crore in latest quarter.
The company’s top management includes Ms.Kiran Mazumdar Shaw, Mr.Peter Bains, Prof.Catherine Rosenberg, Dr.Kush Parmar, Mr.Manja Boerman, Mr.Nilanjan Roy, Ms.Sharmila Abhay Karve, Dr.Vijay Kuchroo, Ms.Vinita Bali, Mr.Deepak Jain, Mr.Priyadarshini Mahapatra. Company has B S R & Co. LLP as its auditors. As on 30-09-2025, the company has a total of 40.29 Crore shares outstanding.

Selena | BTCUSD -Trend Support Holding | Demand Building BITSTAMP:BTCUSD
BTC remains inside a bullish macro channel while repeatedly defending the 89.5k–90k demand zone. Price is compressing directly under the buy-side liquidity cluster at 92.9k–93.6k. This is accumulation, not distribution.
A bullish continuation ONLY activates with a clean break of short-term structure.
Bullish Continuation Setup
Requires:
Break above 92.5k
Hold above 92.0k after retest
Once confirmed:
🎯 Target 1 → 93.2k
🎯 Target 2 → 94.0k
🎯 Target 3 → 96.8k–97.5k (major liquidity draw)
Bearish Breakdown Setup
Failure of 89.5k demand = collapse.
Triggers if:
Candle closes below 89.2k
Targets:
📉 87.0k
📉 84.8k
📉 82.0k liquidity shelf
Bias:
Neutral until 92.5k breaks.
Bullish above 92.5k.
Bearish under 89.2k.
⚠️ For educational purposes only.

What to Expect From Gold on Monday?!
As Christmas Holidays are just around the corner, we see that
many instruments started to slow down and overall volatility dropped
significantly.
Gold remained relatively calm the last week too.
The price formed a narrow horizontal range on an hourly time frame,
respecting that from Tuesday.
I think that we will see a continuation of such a consolidation after the market opening.
Gold will likely stay calm at least till the release of the US Core PCE Price Index
after the NY Session opening.
Expect price movements within the range.
❤️Please, support my work with like, thank you!❤️
I am part of Trade Nation's Influencer program and receive a monthly fee for using their TradingView charts in my analysis.

CADJPY - NEW BREAKOUT!Hello traders,
the CADJPY has formed a rectangle pattern .
Currently, the resistance level (113.462 – 113.325) is broken !
Based on this breakout, I expect a bullish move .
🎯 TARGET: 115.045

Selena | USDJPY | 2H – Institutional Demand Reaction ZoneFX:USDJPY
After multiple rejections from the HTF supply zone, price declined in a controlled manner and reached institutional demand. The current consolidation near the demand zone suggests absorption of selling pressure rather than aggressive continuation. Structure is compressing, indicating a potential liquidity-driven expansion once price resolves from this range.
Key Scenarios
✅ Bullish Case 🚀
If price holds above the institutional demand and reclaims channel midline:
🎯 Target 1: 155.20
🎯 Target 2: 156.00
🎯 Target 3: 156.60 (channel resistance)
❌ Bearish Case 📉
If price breaks and closes below structural support:
🎯 Downside Target 1: 153.80
🎯 Downside Target 2: 153.20 (HTF demand sweep)
Current Levels to Watch
Resistance 🔴: 156.00 – 156.60
Support 🟢: 154.20 – 153.80
⚠️ Disclaimer: This analysis is for educational purposes only. Not financial advice.

GOLD (XAUUSD): Bullish Accumulation Ahead of Another Wave
Gold is stuck within a tiny horizontal range,
testing a resistance cluster based on a current All-Time High.
I think that a bullish accumulation is currently taking place.
A signal that I am looking for to buy Gold is a breakout
and a daily candle close above 4384 - ATH level.
It will be a strong signal that will push the prices higher.
❤️Please, support my work with like, thank you!❤️
I am part of Trade Nation's Influencer program and receive a monthly fee for using their TradingView charts in my analysis.

Hubco Daily Technical levels and Bearish DivergenceThere is a clear Bearish Divergence on Daily and Weekly Timeframe.
It may retrace to 217 or to 205.
There are two scenarios
1) The price action will be in range bound for some time until it breakout above 232.
2) it could drop to 205 range. which will be a good buy opportunity for investors.
For Trader: Wait for 232 to breakout.
Note: Always trade with proper risk management.

Selena | XAUUSD 1H - Trendline Support Retest + Liquidity Sweep FOREXCOM:XAUUSD
Gold remains inside a rising channel while forming repeated liquidity sweeps into the 4,200–4,210 demand region. The current consolidation shows compression toward the downside, indicating a likely sweep of the red zone before any bullish continuation.
A bullish continuation is valid only if price breaks and holds above 4,247–4,252, which unlocks upside targets at:
🎯 4,280
🎯 4,295
🎯 4,305 (major liquidity draw)
If the sweep fails and price closes below the trendline, bearish displacement may target the 4,160–4,175 liquidity block.
Bias remains bullish only above the channel midline.
⚠️ For educational purposes only. Not financial advice.

Selena | XAUUSD – 4H | Bullish Continuation Setup 4400$ WaitingFOREXCOM:XAUUSD
Gold continues to build bullish structure after forming accumulation in the previous range zone. The market broke out, retested demand, and maintained higher-lows inside the ascending channel. Current pullback into the Entry Zone (4122–4140) aligns with channel support + demand, suggesting potential continuation toward the upper boundary and major resistance around 4380–4410.
Key Scenarios
✅ Bullish Case 🚀
Hold above demand zone + channel support:
🎯 Target 1: 4320
🎯 Target 2: 4380
🎯 Target 3: 4410 (final top channel line)
Trigger: bullish rejection or bullish engulfing from 4122–4140.
❌ Bearish Case 📉 (Invalidation)
Break and 4H close below 4052 (Invalid zone):
🎯 Downside Target: 3990 → 3920 strong support
Current Levels to Watch
Resistance 🔴: 4320 / 4380 / 4410
Support 🟢: 4140 / 4122 (Entry Zone)
Invalidation: 4052
⚠️ Disclaimer: This analysis is for educational purposes only. Not financial advice.

EURJPY: Another Bullish Confirmation
EURJPY violated a resistance of a horizontal bullish flag
pattern on a 4H time frame.
It provides a strong intraday bullish confirmation.
I expect a rise at least to 183.1 level.

12th Dec |LIVE TRADE| Pullback Entry Advanced Price ActionThis is a live trade video from start to finish.
1:4/5 Risk to Reward.
Yesterday’s analysis played out and today I took an advanced pullback entry — without waiting for a candlestick confirmation.
The decision was based purely on price behaviour, structure and how the pullback was forming.
In this video I’ve shared:
How I read pullbacks without candle confirmation
Live price action psychology while the trade was running
Real confusion, hesitation, and emotional control during the trade
Why I decided to hold and where most traders panic
How the target eventually played out
The difference between knowing price action and trusting it in real time
This isn’t a perfect trade video.
It’s a real trader’s mindset inside a running position —> thoughts, doubts, patience, and execution.
No indicators.
No hindsight.
Just live price action, live emotions, and real decision-making.
Sharing this purely for learning and transparency.

EURJPYBullish momentum continues as accumulation is in progress for a possible continuation pattern flag setup towards the target of 184.423.

12th Dec Nifty Analysis Clean Price Action Breakdown Here’s my full market analysis for 12th December.
I’ve broken the chart down with trend lines, horizontal levels, and clean market structure, keeping everything in simple language.
No indicators just pure price action and a top-down view of what the market can do from here.
This video is meant to help you think clearly, avoid noise and understand why the market might move in a certain direction.
Nothing fancy, nothing complicated just logic and structure.
Let me know what you think.

EURJPY: Uptrend Continues 🇪🇺🇯🇵
EURJPY finally completed a bullish accumulation
and broke a resistance of a horizontal range yesterday.
The market will most likely continue rising.
Next resistance - 183.0
❤️Please, support my work with like, thank you!❤️
I am part of Trade Nation's Influencer program and receive a monthly fee for using their TradingView charts in my analysis.

Selena | BTC/USD – Trend Channel + Strong Demand ReactionBITSTAMP:BTCUSD
Bitcoin is trading inside a rising parallel channel, with price recently reacting cleanly from the strong demand zone at 90,200–90,700, aligning with channel support. Liquidity was taken below the lows, signalling possible continuation to the upside.
🔼 Bullish Scenario
If BTC holds above 90,200, we may see upside continuation:
🎯 Target 1 → 94,200 – BSL zone
🎯 Target 2 → 96,800 – 97,900 top resistance zone
🎯 Target 3 (Breakout case) → 98,500+
A sweep of intra-day liquidity followed by bullish BOS can provide confirmation.
🔽 Bearish Risk / Invalidation
Break & close below 89,900 could open deeper flow into liquidity below:
⚠️ Downside levels → 88,000 → 86,500 → 81,000 support base
⚠️ This chart is for educational purposes only — not financial advice.

XRP is Bullish Until Proven OtherwiseHolding the 2021 highs has been the saving grace for XRP. In my opinion this negates the negative price action we have seen as of late, especially with taking the positive macro environment.

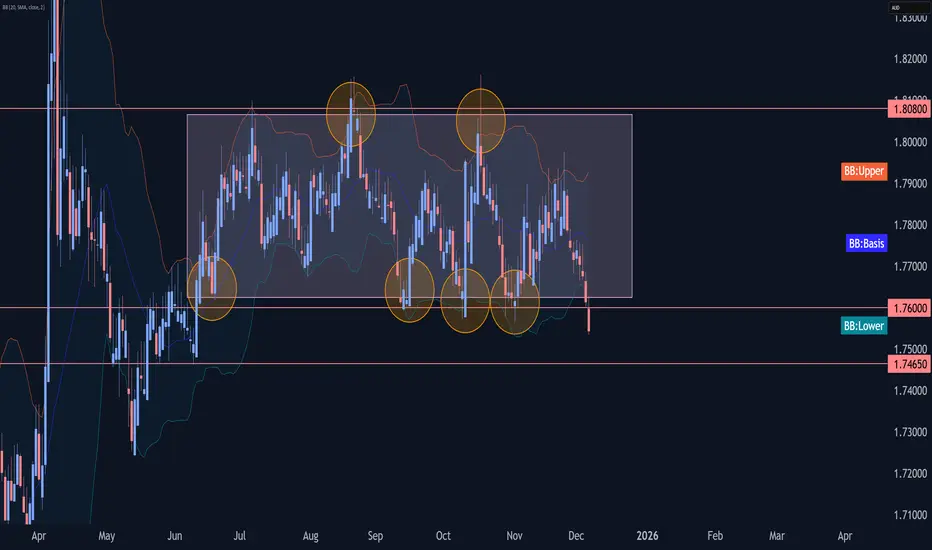
EURAUD Wave Analysis – 5 December 2025
- EURAUD broke the support level 1.7600
- Likely to fall to support level 1.7465
EURAUD currency pair recently broke the support level 1.7600 (which is the lower boundary of the sideways price range inside which the pair has been trading from June).
The breakout of the support level 1.7600 accelerated the active short-term correction ii from the end of November.
Given the strongly bullish Australian dollar sentiment seen today, EURAUD currency pair can be expected to fall to the next support level 1.7465 (former monthly low from June).
SILVER (XAGUSD): Consolidation & Trading Plan
Silver keep coiling within a narrow range on a daily.
Depending on the side of its breakout, I expect 2
potential scenarios.
If the market breaks and closes above 59.0 - the resistance
of the range, expect a bullish continuation to 60.0 level.
If the market breaks and closes below 56.2 - the support
of the range, expect a down movement to 54.5
Alternatively, keep trading the market within the range,
buying from the support and selling from the resistance.
❤️Please, support my work with like, thank you!❤️
I am part of Trade Nation's Influencer program and receive a monthly fee for using their TradingView charts in my analysis.

From Analysis to Execution — A Full Live Trade Breakdown.Yesterday I shared a full analysis and the exact plan for today’s trade.
Today, I executed that plan — live, with full transparency.
In this video:
- Live price action explanation (no hindsight, real-time logic)
- Entry exactly as planned in yesterday’s analysis
- Position tool ON — showing the actual live trade I am in
- Real-time trade management (what I’m thinking, why I’m holding, when I cut)
- Psychology breakdown — how emotions behave inside a running trade
- Structure, candles, liquidity, decision-making explained as they happen
No random drawings.
No after the fact stories.
This is real time execution and honest trade management exactly as the market unfolds.
If I book profits you’ll see it.
If I don’t you’ll see that too.
This video is all about transparency, discipline, and pure price action work.
Watch this trade unfold from plan → entry → management → outcome.
Let me know your thoughts, and if you want more live breakdowns like this.
