#ZECZEC has recently seen a spike while the market was dumping. You need at least three touches before a breakout on a resistance level. The question to be asked, how long it will consolidate at this level or will it revisit it previous support. Only time will tell stay tuned.
Rectangle

EURUSD – Triple Top Zone Formed | Correction Expected Before FX:EURUSD
📊 📉
Market Overview
EURUSD continues to respect its ascending structure but is currently struggling to break above the top resistance, forming equal highs — a liquidity trap area.
A clean rejection here could drive price toward the 1.1620–1.1610 demand base before the next bullish impulse.
Buyers are expected to re-enter at this region to continue the broader bullish leg.
Key Scenarios
✅ Bullish Case 🚀 → After correction to 1.1620–1.1610, expect move toward 🎯 1.1650 | 🎯 1.1680
❌ Bearish Case 📉 → Break below 1.1600 may shift structure toward 1.1560 zone
Current Levels to Watch
Resistance 🔴 1.1645 – 1.1650
Support 🟢 1.1620 – 1.1600
⚠️ Disclaimer: This analysis is for educational purposes only. Not financial advice

GOLD (XAUUSD) – Decision Zone Ahead | Bulls Holding DemandTVC:GOLD
Market Overview
Gold has shown repeated rejections from the demand base, confirming aggressive buyer interest.
Every retest of the yellow box created higher lows, showing accumulation before a potential expansion toward new highs.
If bulls hold above 4 200, continuation toward the 4 228–4 235 zone (previous all-time-high region) is expected.
Key Scenarios
✅ Bullish Case 🚀 → 🎯 Target 1 4 218 | 🎯 Target 2 4 230 | 🎯 Target 3 4 240
❌ Bearish Case 📉 → Rejection from decision zone → Retest of 4 185 then 4 165
Current Levels to Watch
Resistance 🔴 4 218 – 4 230
Support 🟢 4 185 – 4 165
⚠️ Disclaimer: This analysis is for educational purposes only. Not financial advice.

Ebay Wave Analysis – 14 October 2025
- Barclays reversed from key support level 87.00
- Likely to rise to resistance level 94.20
Ebay recently reversed from the support area between the key support level 87.00 (lower boundary of the sideways price range from August), lower daily Bollinger Band and the 50% Fibonacci correction of the upward impulse from June.
The upward reversal from this support area created daily Japanese candlesticks reversal pattern Hammer.
Given the clear daily uptrend, Ebay can be expected to rise to the next resistance level 94.20 (which stopped earlier waves a and B).

Nzd/Usd - Bounce or BreakSupport Zone (Blue Box):
This area shows multiple rejections of lower prices (marked with “S” and triple taps), forming a Triple Bottom or potential Inverse Head & Shoulders structure, hinting at bullish reversal potential.
Resistance Zone (Red Box, labeled "R"):
This is a supply zone where price previously consolidated before continuing lower. Now price is testing it again. A break above this zone could signal trend reversal and continuation to the upside.
Two Potential Scenarios:
Scenario 1: Bullish Breakout
Price breaks above Resistance (R).
Could trigger buy entries, targeting the next resistance (marked “TARGET” above).
Confirmation would be a strong candle close above the red box and EMA crossover.
Scenario 2: Bearish Rejection
Price rejects the Resistance zone.
Could trigger short entries if price breaks below the support (S).
Target is the lower support zone (marked “TARGET” below).
Key Levels
Resistance (R): ~0.56940 - 0.56960
Support (S): ~0.56830 - 0.56860
Trade Ideas (Not Financial Advice)
Bullish Setup
Entry: Break and retest above 0.56960
Stop-loss: Below 0.56890
Target: 0.57100+
Bearish Setup
Entry: Rejection at resistance, break below 0.56830
Stop-loss: Above 0.56960
Target: 0.56650

STRABAG SE – Breakout confirmed, early bullish phaseSTRABAG SE – Breakout confirmed, early bullish phase
After a period of consolidation, STRABAG SE has confirmed a breakout above the upper boundary of Zone C on October 7th.
The structure remains bullish, supported by increasing volume and a MACD golden cross.
Technical Outlook
• Timeframe: 1D
• Support: €79.7
• Entry zone: €85.2–86.7
• Resistance/Target: €92.9–93.5
Momentum continues to strengthen, with price holding above key EMAs (20/50/100).
Institutional participation appears to increase as volume expands on up-moves.
⚠️ Disclaimer: This idea is for educational purposes only and does not constitute financial advice.
Always conduct your own research before investing.
#STRABAG #TechnicalAnalysis #Breakout #GermanStocks #TradingView #Investing


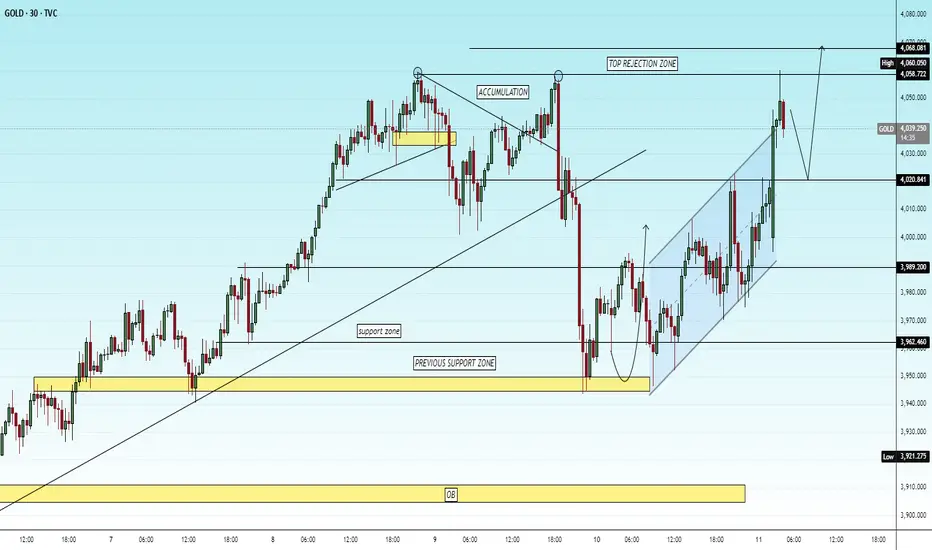
GOLD 30M – Fresh Bullish Structure FormingTVC:GOLD
🚀
Structure | Trend | Key Reaction Zones
Gold is respecting a rising channel after a strong reversal from the previous support zone.
Clear accumulation phase led to a clean bullish breakout above intraday structure.
Current price is holding near mid-channel with space for continuation toward the Top Rejection Zone.
Market Overview
After retesting the previous support base, Gold built strong bullish momentum, forming higher highs and higher lows inside a clean ascending channel. As long as 3989–4020 remains protected, buyers may aim for a clean continuation toward 4060–4068, the next liquidity zone. Short-term consolidation is possible before the next breakout leg toward the top rejection region.
Key Scenarios
✅ Bullish Case 🚀 → 🎯 Target 1: 4048 | 🎯 Target 2: 4060 | 🎯 Target 3: 4068
❌ Bearish Case 📉 → 🎯 Downside Target 1: 4020 | 🎯 Target 2: 3989
Current Levels to Watch
Resistance 🔴 : 4060 – 4068
Support 🟢 : 4020 – 3989
⚠️ Disclaimer: For educational purposes only. Not financial advice.
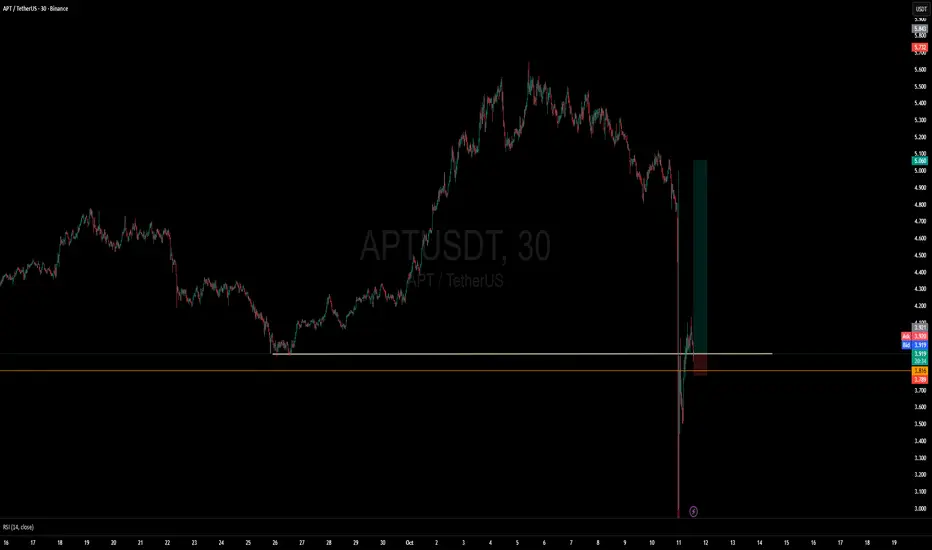
Potential Bullish Resumption on APTUSDAfter the pair tapped into a long time area of interest, it is showing bullish trend. Break of recent mini structure and retest and a draw on a 15 min liquidity can potential fuel the upside.
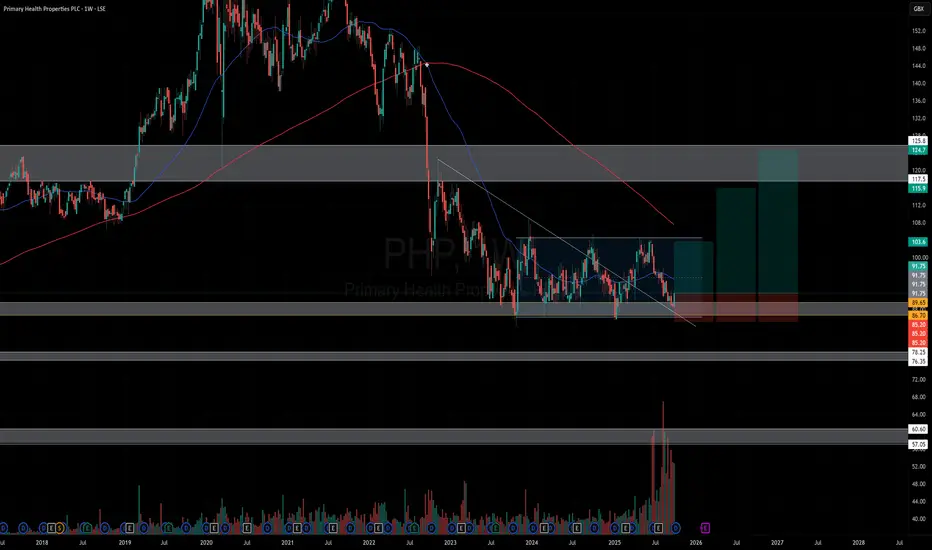
PHP Long - Buy now or DCA in until stop lossPHP Long
Volume has picked up since interest rates started to fall.
Nice big dividend.
Price is at bottom of range/rectangle at historic levels with bullish engulfing candle.
3 TPs, top of range and old price highs.
Plug - Hear me outProposing a trade on a shit-co like plug may earn some laughs but hear me out for a second.
In the right light and with enough alcohol, she could pass for a strong six. I'd do her.
Jokes, aside, due to the frantic rush to solve AI datacenter energy problem, power companies have been getting a lot of play lately, some have real growth potential, while others may be the speculative dream of degenerates like myself.
A 25 year old company, about to hit the figurative wall (DiCapiro joke...slaps knee), has suddenly seen an influx of buying activity and what looks to be increasing volume following a look below and fail of a weekly box.
According to box rules, I can't ignore this trade. Plug has been in an area of consolidation for years. It's completed atleast two look above and look below and fails of the larger boxed range.
I'm not saying that this stock is going to the moon, but if It can reclaim the top of the mini weekly box and hold the midpoint of the larger box then $8 seems like a realistic target to me.
Now, this stock would easily revert back to the volume point of control (VPOC) around $2 or lbaf again or simply fail miserably below the boxes...then all you degens will be living in boxes.
If we do see 2.50 - $2 again, I'd love to take an entry there (a lbaf of vpoc would be nice too). Otherwise, I'll be monitor this name for the mentioned trades.
My posts are for shits and giggles. I'm just a guy with an interest and a celcius addiction.
~The Villain

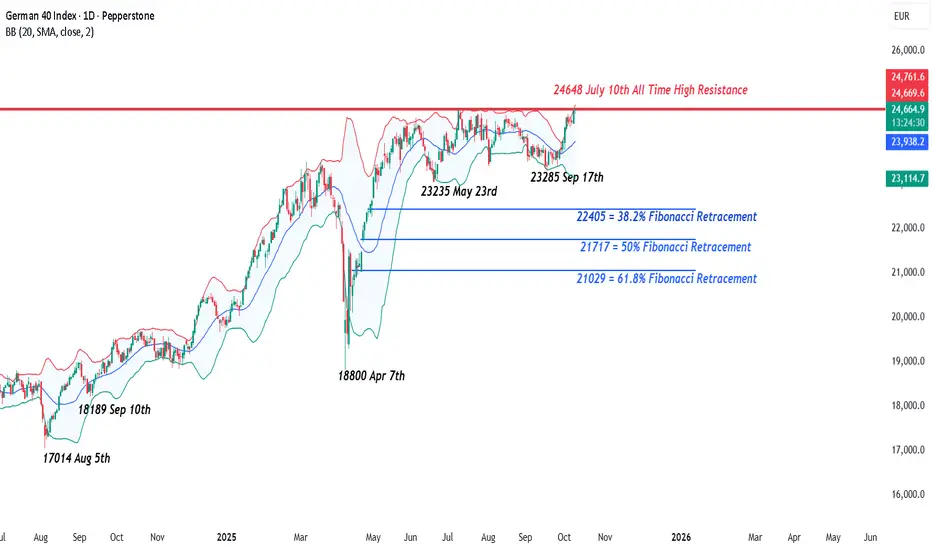
Germany 40 Index – Focus on the All-Time HighDespite weaker than expected factory orders (4th monthly fall) and industrial production (3 year low) data from Germany earlier this week, which both unexpectedly fell, highlighting weaker growth prospects and structural issues that urgently need to be addressed to support the country’s key industrial corporates to deal with the impact of US tariffs and competition from China, the Germany 40 index has steadily moved back towards its all-time high of 24648.
In fact, since the end of a disappointing range bound September, the Germany 40 has risen around 800 points or 3.4% as investors look to rotate back into European markets in a search of lower valuations compared to US companies, especially in the technology sector.
Now, in what has been a week light event week, with Q3 earnings about to start, the focus for traders could be whether the technical trends indicate there is enough momentum to push towards new record highs, or whether the recent gains may lead to some profit taking ahead of the Friday close.
Technical Update: Focus on the All Time High
Recent activity in the Germany 40 index has been contained between 23235, the May 23rd session low, and 24648 the July 10th all-time high. The price action within this range has reflected a more balanced tone, with a clear tug-of-war between buyers and sellers.
A decisive closing breakout through either boundary may be needed to suggest the next directional move.
As the chart above shows, the most recent price activity since the 23285 September 17th low has seen prices recover, a move that is now testing the important resistance level marked by the July 10th all-time high at 24648.
Traders could well be watching closely to see if this new strength leads to a clear closing upside breakout, or if the range between 23235 and 24648 is to remain intact.
Potential Resistance Levels:
One could argue that having previously attracted sellers and held firm as a ceiling since July 10th, 24648 remains the first key resistance to watch. A closing break above this level might signal renewed bullish momentum and open the door for further upside in price.
While a close above 24648 doesn’t guarantee continued strength, it could encourage further upside attempts.
When in new all-time high territory, pinpointing resistance becomes more difficult, but Fibonacci extension levels can offer useful reference points. These projections can be used to help frame potential resistance levels.
While a successful close above 24648 has yet to materialise, such a break could prompt traders to shift their focus towards 25162, the 38.2% extension or even 25482, which is the 61.8% level.
Possible Support Levels:
Of course, the July 10th high of 24648 currently remains intact on a closing basis and continues to serve as the first possible resistance level, marking the upper boundary of the current sideways range. As such, it may once again prove effective in capping price strength. If this resistance holds, it could see renewed selling pressure, raising the risk of fresh price declines.
As shown in the chart above, the 24273 low from October 6th, represents the last correction low in the current rally and may now act as an initial support. If this level breaks it could signal potential for downside moves towards 24133, which is the 38.2% Fibonacci retracement, and possibly further to the rising Bollinger mid-average, which currently stands at 24000.
The material provided here has not been prepared accordance with legal requirements designed to promote the independence of investment research and as such is considered to be a marketing communication. Whilst it is not subject to any prohibition on dealing ahead of the dissemination of investment research, we will not seek to take any advantage before providing it to our clients.
Pepperstone doesn’t represent that the material provided here is accurate, current or complete, and therefore shouldn’t be relied upon as such. The information, whether from a third party or not, isn’t to be considered as a recommendation; or an offer to buy or sell; or the solicitation of an offer to buy or sell any security, financial product or instrument; or to participate in any particular trading strategy. It does not take into account readers’ financial situation or investment objectives. We advise any readers of this content to seek their own advice. Without the approval of Pepperstone, reproduction or redistribution of this information isn’t permitted.
SILVER (XAGUSD) – 15M | Strong Support Holding, Bullish ContinuTVC:SILVER
Market Overview
Silver took a quick rejection from the 48.70 resistance zone and corrected downward into the major support.
Price is now consolidating around 47.50, a key level that previously sparked bullish impulses.
If this level holds, momentum may shift again toward the upper range — signaling a potential bullish continuation phase.
Key Scenarios
✅ Bullish Case 🚀 →
🎯 Target 1: 47.80
🎯 Target 2: 48.23
🎯 Target 3: 48.70 (resistance retest)
❌ Bearish Case 📉 →
Invalidation if price closes below 47.30 (support breakdown).
Current Levels to Watch
Resistance 🔴: 48.23 / 48.70
Support 🟢: 47.40 / 47.50
⚠️ Disclaimer: This analysis is for educational purposes only. Not financial advice.

EURUSD – 1H | Rejection from Support Zone, Bullish Correction FX:EURUSD
Market Overview
EURUSD is currently reacting strongly from a well-defined demand/support base, following an extended downside leg.
The lower trendline and psychological support are holding firm, indicating potential for a corrective bullish leg towards the mid-range resistance zone if price sustains above 1.1650.
Key Scenarios
✅ Bullish Case 🚀 →
🎯 Target 1: 1.1683
🎯 Target 2: 1.1713
🎯 Target 3: 1.1778 (major rejection zone retest)
❌ Bearish Case 📉 →
Invalidation below 1.1640 (clean break under support).
Current Levels to Watch
Resistance 🔴: 1.1713 / 1.1778
Support 🟢: 1.1645 / 1.1660
⚠️ Disclaimer: This analysis is for educational purposes only. Not financial advice.

BTCUSD – 30M | Bullish Continuation Expected BITSTAMP:BTCUSD
Structure | Trend | Key Reaction Zones
Market recently tapped into strong demand zone (120,400–120,800) after a clean supply rejection.
Clear liquidity grab above highs followed by a deep correction to retest demand base — structure still bullish overall.
Market Overview
BTC has completed its corrective phase and is now reacting strongly from the demand box, suggesting potential continuation towards 123,000–125,000 if buyers sustain momentum. Price respecting the structure beautifully — accumulation signs visible again.
Key Scenarios
✅ Bullish Case 🚀 →
🎯 Target 1: 123,400
🎯 Target 2: 124,800
🎯 Target 3: 125,700 (supply zone retest)
❌ Bearish Case 📉 →
Invalidation below 120,000 (strong demand break).
Current Levels to Watch
Support 🟢: 120,400–120,800
Resistance 🔴: 123,400 / 125,700
⚠️ Disclaimer: This analysis is for educational purposes only. Not financial advice.

USDCAD Bullish Trade IdeaTrend: Bullish
Divergence: None
Continuation Pattern: Bullish Rectangle
Reversal Pattern: None
Bias:Bullish
Scenario:Buy at Rnage Breakout
Trade Plan
Stop Loss 1.392
Entry Level 1.4001
TP1 1.4070

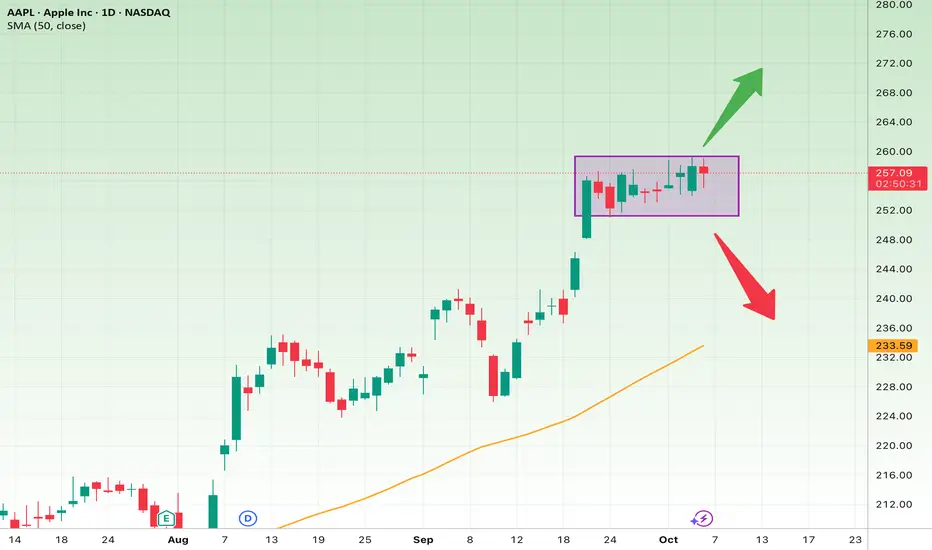
AAPL at the Tipping Point
🧩 Overall Technical Analysis
Timeframe: Daily (1D)
Current Situation: Price is consolidating in a narrow sideways range between $252 and $259, after a strong bullish rally — a typical bullish continuation pattern.
50-day SMA: Around $233.6, acting as a strong dynamic support.
Medium-term Trend: Uptrend (higher highs and higher lows since mid-September).
Pattern: Rectangular consolidation after a sharp move up — potential bullish flag formation.
⚡ Short-Term Outlook (1–2 Weeks)
The price is compressing between $252–$259, like a spring ready to break.
Bullish Scenario (Higher Probability)
Confirmation: Break and close above $260
Target 1: $268
Target 2: $275
Stop Loss: Daily close below $252
Bearish Scenario (Lower Probability)
Confirmation: Break and close below $252
Target 1: $243
Target 2: Around the 50-day SMA (~$233–$234)
Stop Loss: Daily close back above $258
📈 Short-term Summary:
As long as price stays above $252, the short-term bias remains bullish.
🏆 Long-Term Outlook (1–3 Months)
Primary Trend: Still bullish, supported by the 50-day SMA.
Market Structure: Higher highs and higher lows — classic uptrend continuation.
Potential next leg up if the price breaks convincingly above $260.
Long-Term Targets:
Target 1: $280 (psychological resistance & previous high zone)
Target 2: $295 (Fibonacci 1.272 extension from recent swing)
Long-Term Stop Loss:
Below $233 (loss of the 50-day SMA and break of bullish structure)
💡 Key Insights:
Watch for increasing volume and RSI momentum for confirmation of a breakout.
Keep an eye on upcoming earnings and product news — Apple’s sentiment can shift quickly.
A high-volume breakout above $260 would provide a stronger confirmation for continuation.
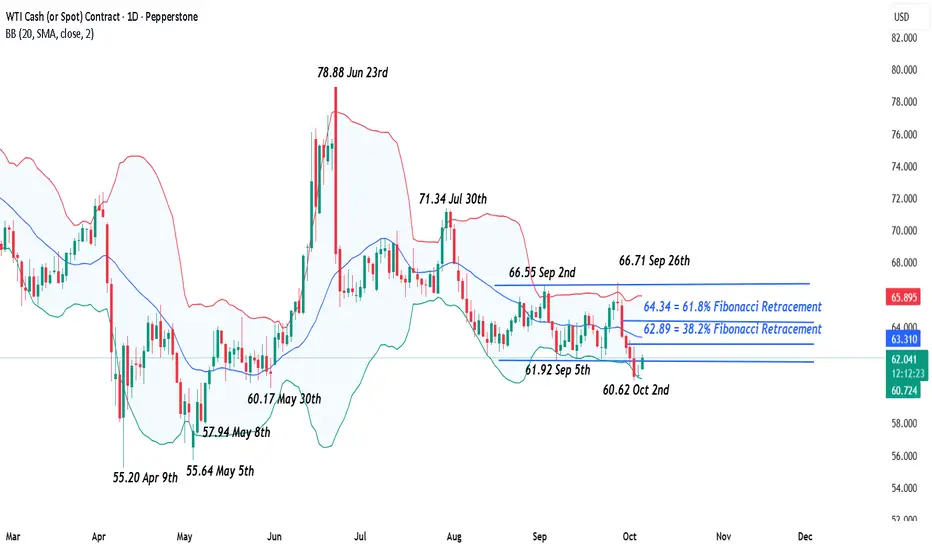
Oil (WTI) – Downside Pressure Appears to Be BuildingLast week, Oil (WTI) experienced one of its biggest declines of the year as traders shifted their focus from the potential short term supply constraints that could be caused by further sanctions on Russia and buyers of Russian energy, to concerns of over supply as the International Energy Agency (IEA) warned of a record Oil surplus in 2026, US crude inventories rose and traders headed into a crucial OPEC+ decision on Sunday surrounding the size of their November production increases. This saw Oil drop from its Monday (Sept 29th) open at 65.27 to a Friday (Oct 3rd) close of 60.92, a fall of 6.7% and its lowest weekly close since late May.
Moving forward to the start of this week, Oil (WTI) prices have jumped around 2% from opening levels back to 62.00 (0800 BST) as traders breathe a small sigh of relief on news that the agreed OPEC+ production increase scheduled for November is only going to be 137k barrels per day and not a much bigger number.
However, while the OPEC+ decision does bring some very short term clarity and has led to some early repositioning from Oil traders, the issues regarding over supply could still remain and may possibly dictate the size of any further rally. This could impact trader decision making as they assess the next series of weekly updates on US inventories and try and work out if a deeper squeeze to the topside is possible or whether this latest rally could run out of steam.
Assessing the technical update could be helpful in this situation.
Technical Update: Downside Pressure Appears to Be Building
Throughout August and September, Oil (WTI) traded in a broadly sideways range, reflecting a tug-of-war between buyers and sellers with no clear directional bias. As the chart below shows, this consolidation unfolded between support at 61.92 (September 5th low) and resistance at 66.55/66.71 (September 2nd and 26th highs). This balanced structure underscored recent trader indecision, with a breakout of either side needed to suggest the possibility for an increase in volatility.
Interestingly, last Thursday’s extension of recent price declines saw closes below the support at 61.92 and traders may well be asking whether this might lead to a further phase of price declines.
While closing breaks from a rectangular range doesn’t guarantee further price weakness, risks do appear to be developing for continued downside pressure this week. With this in mind, it may prove useful to establish some potential support and resistance levels to gauge where the directional risks might now be materialising.
Potential Resistance Levels:
Since posting last week’s low at 60.62, Oil (WTI) has seen a modest price recovery. However, given the recent closing break below support at 61.92, traders may view this rebound as a limited reactive move.
Although further attempts to push to higher price levels are still possible, 62.89. which is the 38.2% retracement of the September 26th to October 2nd decline, may now be seen as the first resistance. While a break above 62.89 wouldn’t necessarily suggest an extended phase of price strength, it could open the way for tests of 64.34, the higher 61.8% retracement.
Potential Support Levels:
Having now seen the latest closing breaks below the lower extremes of the sideways range at 61.92, the risks could be for limited price recoveries and a possible extension of price weakness. As the chart below shows, this could lead to tests of lower support levels.
If this is to be the case, the 60.17 May 30th session low might prove to be the next support level, although if this does give way, the focus could then shift to the May 8th session low at 57.94.
The material provided here has not been prepared accordance with legal requirements designed to promote the independence of investment research and as such is considered to be a marketing communication. Whilst it is not subject to any prohibition on dealing ahead of the dissemination of investment research, we will not seek to take any advantage before providing it to our clients.
Pepperstone doesn’t represent that the material provided here is accurate, current or complete, and therefore shouldn’t be relied upon as such. The information, whether from a third party or not, isn’t to be considered as a recommendation; or an offer to buy or sell; or the solicitation of an offer to buy or sell any security, financial product or instrument; or to participate in any particular trading strategy. It does not take into account readers’ financial situation or investment objectives. We advise any readers of this content to seek their own advice. Without the approval of Pepperstone, reproduction or redistribution of this information isn’t permitted.
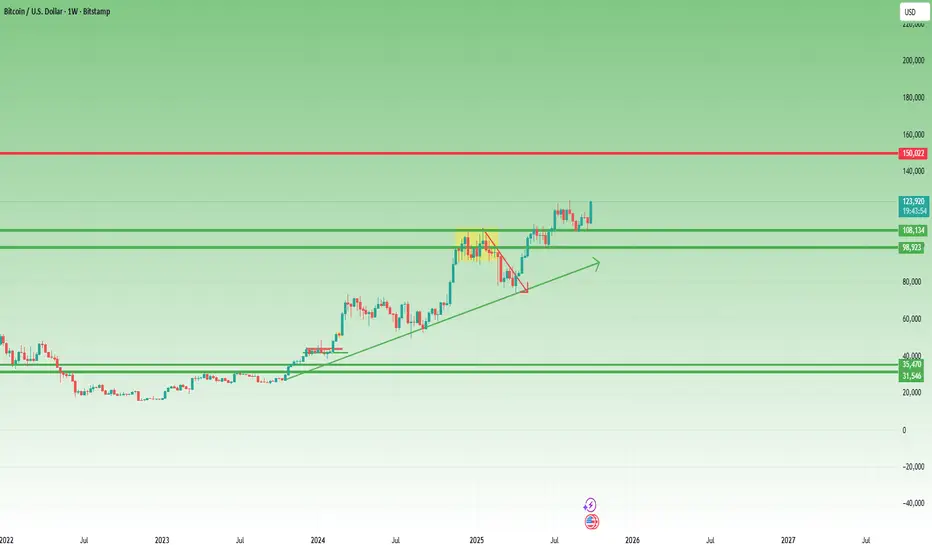
BTC Bulls in Control: 140K–150K Next?In my previous BTC analysis, I mentioned that 125K was the next target and that as long as 112K remains intact, bulls have nothing to worry about.
Since then, the price continued its ascent and is now flirting with the all-time high.
________________________________________
1️⃣ Is BTC Going to Make a New ATH?
From my point of view, it’s no longer a question of if , but how high it can go.
The trend is strong, momentum is building, and technically, we’re entering uncharted territory.
________________________________________
2️⃣ T echnical Context
After nearly three months of consolidation, clearly visible on the weekly chart, the breakout above the rectangle pattern gives us a measured target around 140K.
That’s the logical projection based on structure and continuation strength.
________________________________________
3️⃣ Can BTC Reach 150K?
Absolutely possible.
That’s only about a 20% move from current levels, and for Bitcoin, such moves are almost routine.
As long as 112K support holds, bulls remain fully in control.
________________________________________
Conclusion:
BTC seems ready to explore new highs.
Now the only question is — how far can this go? 🚀
NZDJPY: Another Confirmed Pullback?! 🇳🇿🇯🇵
AUDJPY dropped as I predicted.
Another Yen pair that looks bearish to me is NZDJPY.
The price has just violate a support line of a consolidation range
on an hourly time frame.
It indicates a highly probable pullback.
Goal - 85.72
❤️Please, support my work with like, thank you!❤️
I am part of Trade Nation's Influencer program and receive a monthly fee for using their TradingView charts in my analysis.

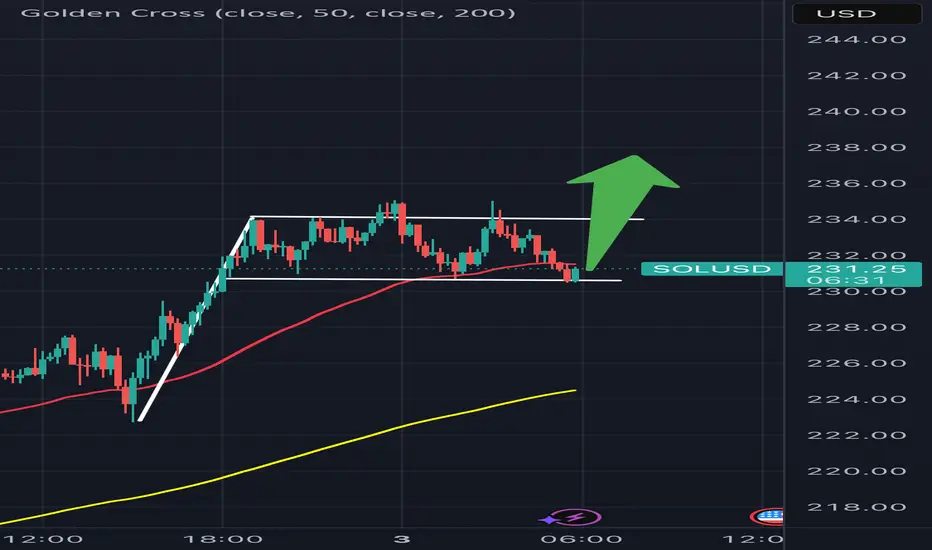
Bull flag / bullish rectangleWhen BTCUSD will come out of the (bullish) descending channel pattern (I think it wil) then SOLUSD will play it out this way too. Let’s go!
WTI Wave Analysis – 29 September 2025- WTI reversed from resistance level 65.25
- Likely to fall to support level 61.70
WTI crude oil recently reversed down from the the resistance area between the resistance level 65.25 (upper border of the active sideways price range from the start of August).
The resistance level 65.25 was strengthened by the upper daily Bollinger Band and by the 50% Fibonacci correction of the downward impulse from the end of July.
WTI crude oil can be expected to fall to the next support level 61.70 (lower border of the active sideways price range).

BILI (Bilibili Inc.) – Measured Move Trade Setup📈 BILI (Bilibili Inc.) – Measured Move Trade Setup
Idea:
Price action shows a clean measured move in play. After rallying from $22.21 → $28.20, BILI consolidated back toward the $25.72–26.00 support zone. This level aligns with Fib 0.5 and channel mid-support, now acting as the base for the next leg higher.
Measured Move Projection:
Initial impulse = ~6 points
Adding to breakout base ≈ Target $31.90–32.04
This aligns with Fib extension (1.618) and horizontal resistance.
Setup:
Entry Zone: $26.00–27.00 (preferably near Fib support on dips)
Target 1: $29.65 (Fib 1.236)
Target 2: $30.54 (Fib 1.382)
Target 3 (Measured Move): $31.90–32.04
Stop Loss: Close below $25.72 (Fib 0.5 / invalidation)
Bias: Bullish continuation within ascending channel.
Risk/Reward: Favorable if risk is kept below $25.72.
🔑 Summary: As long as BILI holds above $25.72, the measured move projects upside into the $32 zone.
