BTC 1H Analysis – Key Triggers Ahead | Day 22💀 Hey , how's it going ? Come over here — Satoshi got something for you !
⏰ We’re analyzing BTC on the 1-hour timeframe timeframe .
👀 On the 1-hour Bitcoin chart, after the last attempt to push toward resistance, it faced a strong rejection at $115,000 and moved toward the box's lower boundary. Currently in the alarm zone for a short position, but personally, I wouldn’t open a short here.
⚙️ Key RSI levels are 45 and 20. The 20 level is a support in the heart of oversold territory, where Bitcoin’s volatility spikes and often sees a reversal. The 45 level acts as resistance, with volatility triggering reversals upon hitting it.
🕯 Volume shows larger and more frequent red candles, with price heading toward its support levels.
💵 USDT.D broke and held above 4.27% but got rejected at 4.4%. A break and hold above 4.4% could increase selling pressure on Bitcoin.
🔔 Bitcoin’s alarm zones today aren’t very logical, so we can focus on altcoins instead. I’ll post a few altcoin picks on TradingView and the channel today.
❤️ Disclaimer : This analysis is purely based on my personal opinion and I only trade if the stated triggers are activated .
Rectangle

Ethereum's ATH: What's Next?Ethereum recently hit a new all-time high (ATH), but its upward momentum has met a significant resistance level. Based on this technical signal, there is a possibility that the price could pull back and correct to a support range of approximately $4,121 to $3,936.

BTC 4H Analysis – Key Triggers Ahead | Day 20💀 Hey , how's it going ? Come over here — Satoshi got something for you !
⏰ We’re analyzing BTC on the 4-hour timeframe timeframe .
👀 On the 4-hour timeframe, Bitcoin is moving inside a 4H range box. The top of this box is at the $122,300 level and the bottom is at the $112,000 level. The midline of the box is around $117,000, and after touching this level the price got rejected downwards .
⚙️ On the RSI, we have two key zones: 30 and 64. When the oscillator crosses these zones, long or short trading volatility increases and the probability of entering overbought or oversold conditions rises .
🕯 On the 4H chart, the size of the buying candles has become noticeably large. After yesterday’s news, the market faced holidays and volume decreased, but with the opening of the new weekly candle, we may see an increase in trading volume. This could bring more volume into long positions .
💵 USDT.D on the 4-hour timeframe has a support at 4.19% and a resistance at 4.35%. Breaking either of these levels could inject significant volume into Bitcoin. Tether selling volume has been relatively strong and faced selling pressure, which could push this drop further .https://www.tradingview.com/x/4bTsKokC
🔔 Our trading alarm zones are placed at $117,000 and $112,000. Price action around these levels, with the start of the new week, can be strong. Selling pressure on Tether and a potential interest rate cut may shift the market sentiment toward long positions .
❤️ Disclaimer : This analysis is purely based on my personal opinion and I only trade if the stated triggers are activated .

XAUUSD (Gold) – 30m Outlook | BEARISH OR BULLISH??Structure | Trend | Key Reaction Zones
Price retesting the Pending Area (≈ 3330) ⚔️ after breakdown.
Lower Highs (LH) confirm bearish pressure, but support zone remains active.
Market Overview
📉 Bearish Scenario → Rejection from 3330 zone may extend downside:
🎯 Target 1: 3315
🎯 Target 2: 3310
🚀 Bullish Scenario → If buyers reclaim above 3330, upside momentum could follow:
🎯 Target 1: 3342
🎯 Target 2: 3358
Current Levels to Watch
Resistance: 3330 – 3342 ❌
Support: 3315 – 3310 ✅
Disclaimer
This analysis is for educational and informational purposes only. It is not financial advice. Please conduct your own research before trading.

Baidu Wave Analysis – 21 August 2025- Baidu reversed from the support area
- Likely to rise to resistance level 93.20
Baidu recently reversed from the support area between the support level 84.40 (which is the lower border of the sideways price range inside which the price has been trading from April) and the lower daily Bollinger Band.
The upward reversal from the support level 84.40 stopped the earlier impulse waves iii and 3.
Baidu can be expected to rise to the next resistance level 93.20, which is the upper border of the active sideways price range.

Navneet Education Ltd - on the verge of multi month BONavneet Education Ltd is trading in a range for more than 2 years and since Jun 2017 it's not closed above 164, this time I think it will cross this level and make a new high with min 50% upside potential. Do your own study before taking this trade.

SILVER (XAGUSD): Bearish Move From Trend Line
I see a test of a strong trend line on Silver on an hourly time frame.
A rapid growth stopped once the price approached that
and a consolidation started.
A bearish breakout of its support is a strong confirmation to sell.
I think that the market will retrace to 37,54
❤️Please, support my work with like, thank you!❤️
I am part of Trade Nation's Influencer program and receive a monthly fee for using their TradingView charts in my analysis.

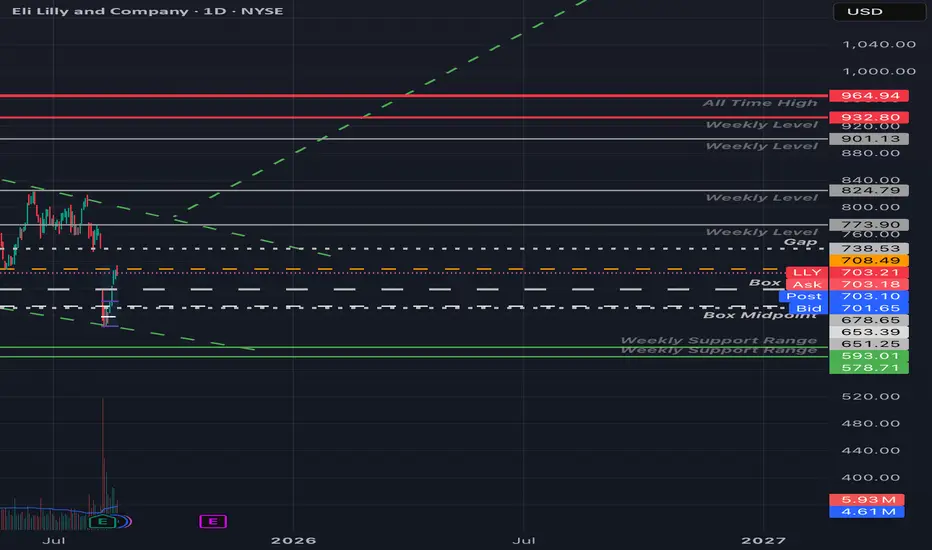
LLY - Clean Levels UpdatedEli Lilly's hit those 708.49 and 711 levels I mentioned in my previous LLY post.
I've added some weekly levels, and a couple relevant spots from my boxed LLY chart.
If LLY loses steam up here we could easily see a retest of that box top area in the $680 - $678 range. Otherwise if we see a market wide reversion from today's liquidation, and LLY clears today's high(~714) and firmly holds that high volume area, that gap($738) fill would be a no-brainer.
Personally leaning on the side of a short continuation(in the near time at least), didn't really trust the low volume float up over the last few trading days, and definitely don't like the decreasing volume into that $711 - $714 area (I'd consider it a Look above and fail).
Regardless of bias, we trade what we see.
~ The Villain.
A British Japanese Triangle (GBP/JPY)Setup
Price broke out of a triangle pattern but after a successful test of prior highs at 200 psychological resistance, dropped back to the broken upper trendline of the triangle only to rebound back to the big 200 level.
Signal
The price snapped below its rising trendline on the daily chart as well as a price pivot at 196 - and RSI fell below support from the 50-level before rebounding sharply to form a new multi-week high. A daily close over 200 should confirm the uptrend has resumed.

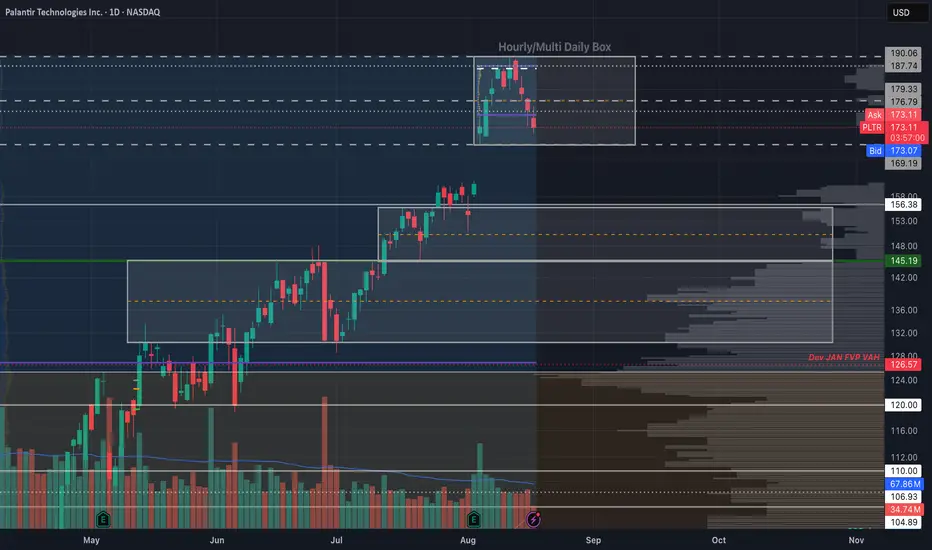
Palantir - The Box Calls The ShotsI recently posted a palatir chart with clean levels of where I'd look to DCA. While those dip-buy levels can easily be used to trade the name, I think it would also help to be mindful of the box ranges as we trade into them. As you'll see, Palantir loves to play with box as much as I do.
If you are familiar with how to trade box set-ups, you can take advantage immediately; otherwise, you may want to do some research on how to trade these.
~The Villain
PROVE : PROVE Find out.Hello friends🙌
✅We have come with an analysis of the PROVE currency, which has just been listed and is in a good range. If this pattern fails, you can enter a purchase transaction in steps and with risk and capital management. We have also specified the stop loss for you and the targets are also specified...
⚠Be careful not to involve more than 1 to 2% of your capital in buying these types of currencies and be sure to manage your capital.⚠
🔥Follow us for more signals🔥
*Trade safely with us*

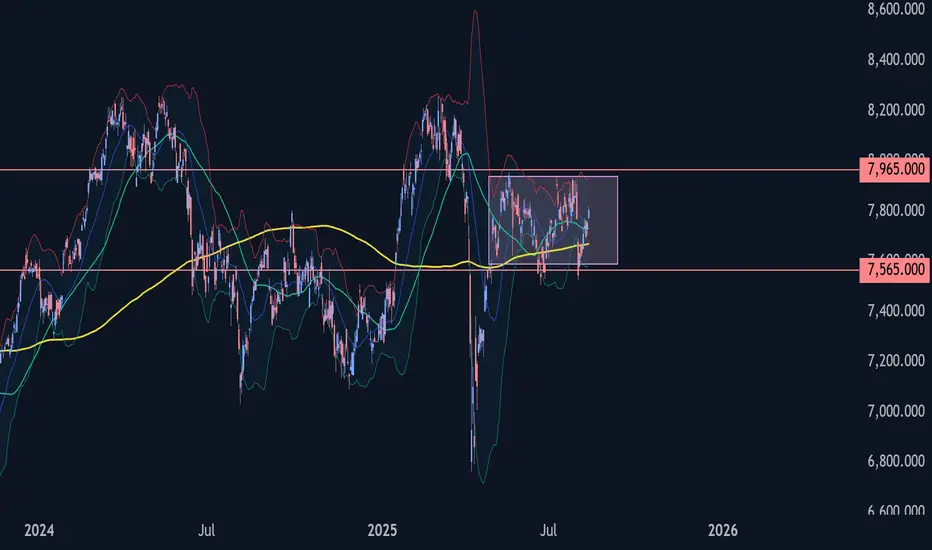
CAC40 Wave Analysis – 14 August 2025- CAC40 rising inside intermediate impulse wave (3)
- Likely to reach resistance level 7965.00
The CAC40 index continues to rise within the intermediate impulse wave (3), which began earlier from the support level of 7565.00 (the lower border of the sideways price range within which the index has been moving since May).
The active impulse wave (3) is a part of the longer-term upward impulse wave 3 from the end of June.
CAC40 index can be expected to rise to the next resistance level 7965.00, which is the upper border of the active price range.
Gold volatility Continues in the 3250-3450 RangeGold’s role as a safe haven in times of stress, whether geo-political or tariff related has kept prices riding a rollercoaster up and down between range highs at 3450 and range lows at 3250 since the start of June.
It’s popularity with central banks, led by China, as a diversification asset away from the US dollar has also helped to underpin prices on dips, with the PBOC reporting purchases of the popular metal for 9 straight months in a row.
This week that volatility has continued as prices slipped 2% from opening levels around 3400 on Monday to register a low of 3331 before rebounding back 1% higher again. The reason for the drop, confirmation from President Trump that Gold imports won’t be subject to tariffs, providing clarity to a situation that had caused chaos across global markets into the end of the previous week.
However, looking forward, with Gold currently trading around 3360 again, there are several drivers in play for traders to focus on. The first, is the on-going situation surrounding Federal Reserve (Fed) interest rate cuts. This can be an important consideration given that as a general rule Gold tends to benefit from a lower interest rate environment and vice versa. This is due to it not being an interest-bearing asset when owned.
After an in-line US CPI reading on Tuesday, traders have begun to consider the possibility of a potential jumbo 50bps (0.5%) rate cut when the Fed meet next on September 17th. More impetus has been given to this viewpoint after US Treasury Secretary Scott Bessant stated via Bloomberg TV on Wednesday that he believes US interest rates should be 150-175bps (1.5-1.75%) lower, even adding his weight to the possibility of a 50bps cut in September.
Secondly, President Trump and President Putin meet in Alaska on Friday for a face to face summit to discuss what it would take to achieve an extended ceasefire or even peace in Ukraine. This meeting takes place after a big week of diplomacy from European nations who wanted to make their own viewpoints known, including Ukraine’s unwillingness to give up territory to make a deal happen.
The potential headlines from this meeting, alongside the outcome of today’s US PPI (factory gate inflation) release at 1330 BST could have an influence on the direction of Gold prices into the weekend.
Technical Update: Range Parameters Clearly Set
A sideways range in price action typically forms when there is a balance between both buyers and sellers. Price strength is capped at a level where sellers are found to halt the advance and push prices lower. Price declines are then limited by buyers who provide support at lower levels, leading to a recovery in price. This back-and-forth activity creates a stable range until a breakout occurs.
This would appear to be the current backdrop for Gold
As the chart above shows, recent attempts at Gold price strength have been capped by 3451, which is equal to the June 16th recovery high. This level has limited upward price movement and triggered subsequent weakness. Based on this activity, 3451 possibly represents the upper boundary of Gold’s sideways trading range.
As also shown on the chart above, price weakness has followed the failure to break above the 3451 resistance level. However, buyers have also consistently re-emerged around 3246, which is equal to the May 29th and June 30th price lows, successfully holding declines and triggering a price recovery. This price action suggests 3246 currently marks the lower boundary of Gold’s sideways trading range.
It is impossible to predict when, or even if, a breakout from a sideways range will occur. In the case of Gold, confirmation of a breakout would require a close above the 3451 resistance level, or below the 3246 support. Until then, the range remains intact.
While it does not guarantee a sustained phase of price strength, a successful close above the 3451 resistance level may be viewed by traders as a positive signal for Gold, potentially opening the door for further price strength.
A successful close above the 3451 resistance level could signal a potential move toward 3500, the April 22nd all-time high. If this level is also breached, the next resistance may be 3648, which is equal to the 38.2% Fibonacci extension level.
To the downside, a closing break below the 3246 support, which marks lower limits of the current sideways range, would likely be needed to suggest a break lower from the range.
A successful close below the 3246 support level could lead traders to anticipate further downside risks. If confirmed, this could open the way for a test of 3120, which is equal to the May 15th low support, and potentially extend even further toward 2957, the April 7th low, should that level also be breached.
The material provided here has not been prepared accordance with legal requirements designed to promote the independence of investment research and as such is considered to be a marketing communication. Whilst it is not subject to any prohibition on dealing ahead of the dissemination of investment research, we will not seek to take any advantage before providing it to our clients.
Pepperstone doesn’t represent that the material provided here is accurate, current or complete, and therefore shouldn’t be relied upon as such. The information, whether from a third party or not, isn’t to be considered as a recommendation; or an offer to buy or sell; or the solicitation of an offer to buy or sell any security, financial product or instrument; or to participate in any particular trading strategy. It does not take into account readers’ financial situation or investment objectives. We advise any readers of this content to seek their own advice. Without the approval of Pepperstone, reproduction or redistribution of this information isn’t permitted.

EUR50 Wave Analysis – 13 August 2025- EUR50 rising inside sideways price
- Likely to reach resistance 5200.00
EUR50 index continues to rise inside the sideways price range set between price levels 5200.00 and 5500.00 – which have been reversing the price from May.
The earlier upward reversal from the support level 5200.00 started the active short-term corrective wave 2, which belongs to the impulse wave (3) from July.
EUR50 index can be expected to rise to the next resistance 5200.00, which is the upper border of the active sideways price range.

PLTR 1D — When the tea is brewed and the handle’s in placePalantir’s daily chart is shaping up a textbook cup with handle pattern — one of the most reliable continuation setups in technical analysis. The cup base was formed over several months and transitioned into a consolidation phase, building a rectangle structure where smart money likely accumulated positions before a breakout.
Now here’s the key: price has not only broken out — it’s settled above all major moving averages, including EMA 20/50/100/200 and MA 50/200. The breakout candle was supported by surging volume, signaling strong participation from institutional buyers. When all the averages start bending upwards, it's usually not by accident.
The breakout above the $121 resistance zone unlocked a pathway toward a target at $187 , derived by projecting the height of the cup upward from the breakout level. This kind of structure, once confirmed, often fuels aggressive continuation — and this one’s got the setup locked in.
From a fundamental perspective, Palantir is holding solid ground: strong earnings reports, expanding government and commercial contracts, and aggressive development in AI services. Institutional interest is rising steadily, and that momentum is visibly reflected in price action.
To sum it up: price has launched cleanly out of the consolidation zone, pierced all critical MAs and EMAs, and continues to gain momentum. While the market sips its tea, this cup is boiling hot. Just don’t forget your stop loss — this is a trading desk, not a tea party.
If you enjoy posts like this, drop a like, share it around, and let’s hear your thoughts below. It keeps ideas moving and the content flowing — free, sharp, and relevant.

Johnson & Johnson Wave Analysis – 11 August 2025- Johnson & Johnson broke the resistance level 168.15
- Likely to rise to level 175.95
Johnson & Johnson previously broke the resistance level 168.15 (upper border of the weekly sideways price range inside which the price has been trading from 2023).
The breakout of the resistance level 168.15 accelerated the active medium-term impulse wave (3) from July.
Johnson & Johnson can be expected to rise further to the next resistance level 175.95, a former multi-month high from 2023 and the target price for the completion of the active impulse wave (3).

Buy before its too lateWe are on ascending chanel
We have lower high
We have 2D,3D Smi & StochRSI Positive Cross
We are below the trend line and are in the fourth collision (70% chance of break)
Buy for the channel top (0.014)
Trump Coin Wave Analysis – 8 August 2025
- Trump Coin reversed from the support area
- Likely to rise to resistance level 10.75
Trump Coin recently reversed from the support area between the support level 8.440 (lower border of the sideways price range inside which the price has been moving from June) and the lower daily Bollinger Band.
The upward reversal from this support area stopped the previous short-term ABC correction ii from last month.
Given the strongly bullish sentiment seen across the cryptocurrency markets, Trump Coin can be expected to rise to the next resistance level 10.75 (upper border of the active sideways price range).

MarketBreakdown | USDJPY, NZDUSD, EURJPY, US100
Here are the updates & outlook for multiple instruments in my watch list.
1️⃣ #USDJPY daily time frame 🇺🇸🇯🇵
The market is trading in uptrend.
After the price updated a high, it retraced.
I see a consolidation now and a formation of a narrow
horizontal trading range.
A bullish breakout of a resistance of the range and a daily
candle close above that will provide a strong trend-following bullish signal.
An uptrend will most likely resume then.
2️⃣ #NZDUSD daily time frame 🇳🇿🇺🇸
A test of a historically significant major demand cluster triggered a strong
bullish reaction. The price violated a strong resistance and closed above that.
I think that the market will most likely continue growing.
3️⃣ #EURJPY daily time frame 🇪🇺🇯🇵
The pair is trading within a horizontal parallel channel.
With the absence of high impact fundamental news today,
I think that the market will most likely continue consolidating
and the price may retrace from the resistance.
4️⃣ #NASDAQ Index #US100 daily time frame 🇺🇸🇨🇭
Looks like the market is preparing to update the ATH.
A confirmed violation of a minor daily resistance and a valid
Change of Character on intraday time frames indicate clear
strength of the buyers.
I guess that 23700 level will be tested soon with its highly probable breakout.
Do you agree with my market breakdown?
❤️Please, support my work with like, thank you!❤️
I am part of Trade Nation's Influencer program and receive a monthly fee for using their TradingView charts in my analysis.

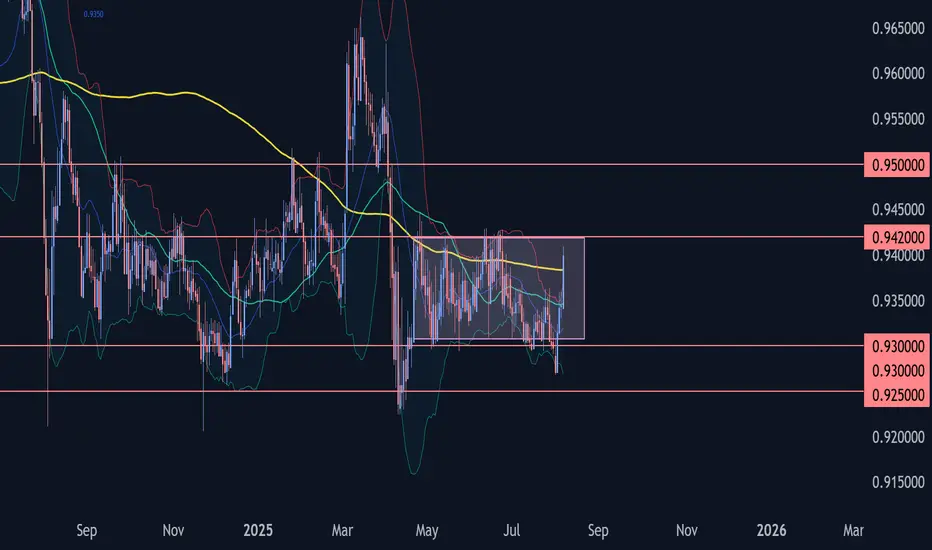
EURCHF Wave Analysis – 6 August 2025
- EURCHF rising inside sideways price range
- Likely to test resistance level 0.9420
EURCHF currency pair recently reversed from the support area between the strong support level of 0.9300 (lower border of the sideways price range from April) and the lower daily Bollinger Band.
The upward reversal from this support area created the clear daily Japanese candlesticks reversal pattern Bullish Engulfing – which started active impulse wave 3.
Given the strongly bearish Swiss franc sentiment seen today, EURCHF can be expected to rise to the next resistance level 0.9420 (upper border of the active sideways price range).
USDCAD: Strong Bearish Signal?!The 📈USDCAD pair appears to be bullish following more than a month of consolidation.
The bullish breakout from a sideways range support serves as a strong confirmation signal.
Indicating an expected upward movement towards at least the 1.3950 support level.

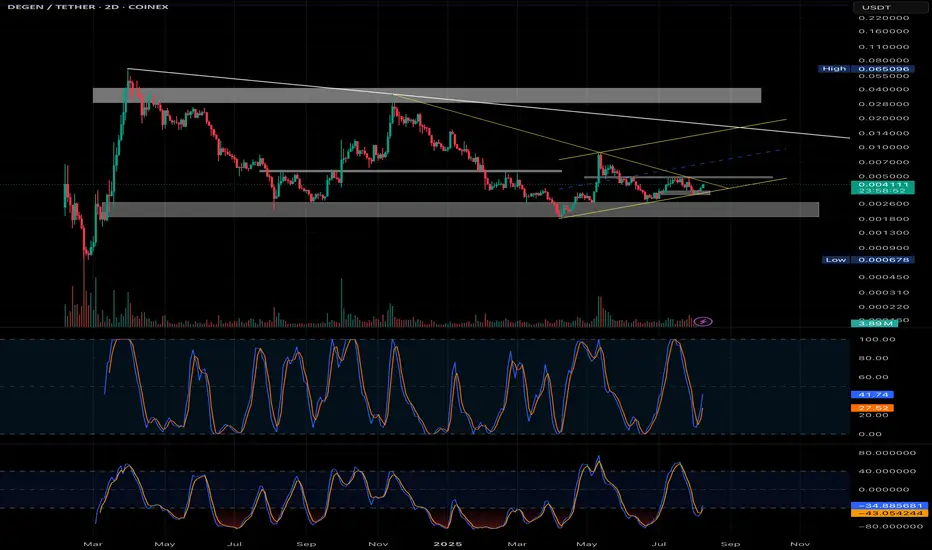
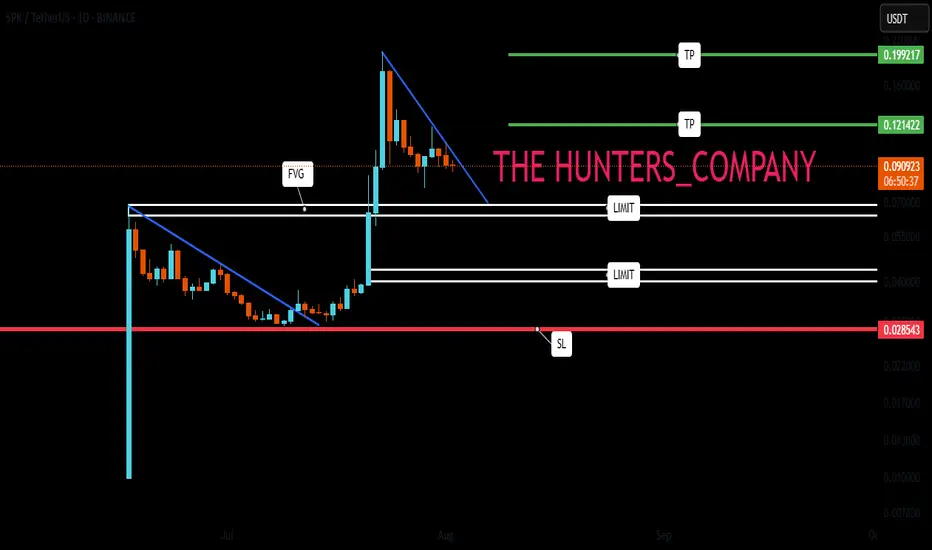
SPK : Does history repeat itself?Hello friends🙌
✅You see that once a pattern was formed and after the resistance was broken, we had a good growth.
✅Now the same pattern has formed again and the price is in the accumulation phase.
✅We have to see if history repeats itself and if the buyers support the price again or not.
✅We have obtained important support areas for you, so that if it falls, you can buy in steps and if the pattern breaks, you can buy in steps right here, of course with capital and risk management.
🔥Follow us for more signals🔥
*Trade safely with us*
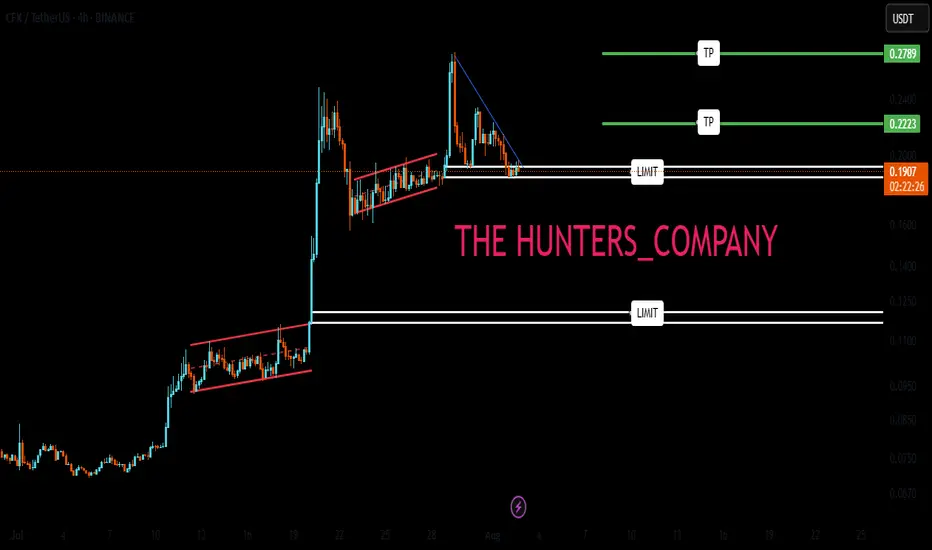
CFX : don't be afraidHello friends🙌
If you take risks, you will win. If you don't, you will regret it.
✅Given the good price growth, now that the price is in a correction phase, there is a good opportunity to buy with risk and capital management, of course, at the specified support levels and move with them to the set targets.
🔥Follow us for more signals🔥
*Trade safely with us*