USDCHF - Let the Market Come to YouUSDCHF remains overall bullish, and price is now doing exactly what we want to see in a healthy trend.
We’re currently retesting a key intersection:
– the lower blue trendline
– and the green structure support
As long as this intersection holds, my focus stays on trend-following long setups. I want to see buyers step in again from here and defend structure before considering any entries.
⚠️ Disclaimer: This is not financial advice. Always do your own research and manage risk properly.
📚 Stick to your trading plan regarding entries, risk, and management.
Good luck! 🍀
All Strategies Are Good; If Managed Properly!
~Richard Nasr
Rejection

ETHUSDT M30 HTF Range High Rejection and Bearish Pullback Setup📝 Description
BINANCE:ETHUSDT has reached the previous range high and is reacting from a clear BSL zone. Price is showing rejection near local resistance, suggesting weakness after the recent bullish leg and increasing probability of a corrective pullback.
________________________________________
📈 Signal / Analysis
Primary Bias: Bearish while price remains below the range high and BSL
Preferred Setup:
• Entry: 3,375
• Stop Loss: Above 3,395
• TP1: 3,347
• TP2: 3,321
• TP3: 3,286 (HTF FVG draw / lower liquidity)
________________________________________
🎯 ICT & SMC Notes
• Clear reaction from BSL and range high
• No bullish continuation structure confirmed
• Downside targets aligned with HTF FVG and liquidity pools
________________________________________
🧩 Summary
CRYPTOCAP:ETH is showing signs of exhaustion at the range high. As long as price stays below BSL, the expectation remains a controlled bearish pullback toward lower HTF liquidity zones.
________________________________________
🌍 Fundamental Notes / Sentiment
With ongoing USD strength, financial conditions remain tight, pressuring risk assets. In this environment, Ethereum is vulnerable to downside, and a bearish continuation is favored as long as the dollar stays supported.
________________________________________
⚠️ Risk Disclosure
Trading involves substantial risk and may result in capital loss. This analysis is for educational purposes only and does not constitute financial advice. Always apply proper risk management, predefined stop-loss levels, and disciplined position sizing aligned with your trading plan.

ETH M15 HTF FVG Rejection and Bearish Setup📝 Description
On the M15 timeframe, BBG:ETHEREUM is pushing back into a 30m Fair Value Gap (FVG) after a strong impulsive sell-off. The current move higher appears corrective, with price stalling inside prior imbalance rather than showing acceptance above it.
________________________________________
📈 Signal / Analysis
Primary Bias: Bearish while price remains below the 30m FVG / 3,100 zone
Preferred Setup:
• Entry: 3,100 (30m FVG tap & rejection)
• Stop Loss: Above 3,105
• TP1: 3,088
• TP2: 3,079
• TP3: 3,072
________________________________________
🎯 ICT & SMC Notes
• Clear displacement created a clean 30m FVG overhead
• Current rally lacks bullish BOS or CHOCH confirmation
• Downside targets align with prior sell-side liquidity and structural lows
________________________________________
🧩 Summary
CRYPTOCAP:ETH is reacting into a higher-timeframe imbalance zone after an impulsive drop. As long as price is capped below the 30m FVG, the structure favors continuation lower toward TP1–TP3, treating the current push as a corrective pullback.
________________________________________
🌍 Fundamental Notes / Sentiment
Broader crypto sentiment remains fragile, with risk appetite still selective. Without a strong risk-on catalyst, rallies into HTF inefficiencies are more likely to be sold, supporting continuation-type setups rather than reversals.
________________________________________
⚠️ Risk Disclosure
Trading involves substantial risk and may result in capital loss. This analysis is for educational purposes only and does not constitute financial advice. Always apply proper risk management, predefined stop-loss levels, and disciplined position sizing aligned with your trading plan.

EURAUD - Shorts Played, Now Watching the Other SidePreviously, this one was pretty straightforward.☀️
📉As EURAUD approached the upper bound of the falling channel, the bias was clear, we were looking for shorts, and price reacted perfectly from that area.
Fast forward to now, and context has changed.
Price has pushed all the way down into a strong confluence:
• The lower bound of the falling channel
• The previous weekly low (also demand zone)
At the moment, we’re seeing rejection from the lower channel, suggesting selling pressure may be slowing down.
⚔️As long as this area continues to hold, my focus shifts from selling rallies to looking for longs, targeting a rotation back toward higher levels inside the range.
This doesn’t mean blind buying... it means waiting for confirmation on lower timeframes and letting the market prove that bulls are stepping in.
⚠️ Disclaimer: This is not financial advice. Always do your own research and manage risk properly.
📚 Stick to your trading plan regarding entries, risk, and management.
Good luck! 🍀
All Strategies Are Good; If Managed Properly!
~Richard Nasr

AUDCAD - From Shorts to Potential Longs!!Earlier in this range, we sold 📉AUDCAD near the upper boundary, fading resistance as price showed clear exhaustion. That idea played out well, with price rotating back into the middle and now pressing toward the lower bound of the range.
This is where things shift.
⚔️As long as range support holds, the bias flips from selling rallies to looking for longs from support. In a well-defined range, edges matter more than direction, and the lower boundary is where buyers historically step in.
The plan from here is simple and disciplined.
No chasing. No guessing....
🏹If price holds above support and shows bullish reaction on lower timeframes, longs become valid back toward the range highs. A clean breakdown below support would invalidate this idea and put sellers back in control.
Range trading is not about prediction, it’s about location and reaction.
Will buyers defend the floor once again, or is this range finally ready to break? 🤔
⚠️ Disclaimer: This is not financial advice. Always do your own research and manage risk properly.
📚 Stick to your trading plan regarding entries, risk, and management.
Good luck! 🍀
All Strategies Are Good; If Managed Properly!
~Richard Nasr

Double top still activeThe price is testing the broken support level at 300 ish now resistance. Double top is still active in the weekly timeframe. I think the price is going to be rejected soon specially with bitcoin heading lower to 75K. SL triggers if a weekly candles break up the 300 resistance and closes above it.

Test and byePrice is testing the 30 resistance zone. Previously broken support. There is a lot of supply there, many sellers. I think the price is going to be rejected hardly and pull back to the next support level at 18. I opened a short position, my SL triggers if a weekly candle CLOSES above 30.

AUDCAD - Stuck in a Range… Bears Eye the Upper Boundary!📦AUDCAD has been moving inside a clear horizontal range , with price repeatedly rejecting the upper resistance zone highlighted in red. Each time price tapped this area, sellers regained control and pushed it downward.
⚔️Price is now approaching that same resistance once again. As long as this zone holds, we will be looking for sell setups, expecting AUDCAD to reverse back toward the lower bound of the range.
📉The bias remains bearish within this structure unless buyers manage to break and close above the resistance with strength.
Do you think AUDCAD will respect the range again? Share your thoughts below 👇
⚠️ Disclaimer: This is not financial advice. Always do your own research and manage risk properly.
📚 Stick to your trading plan regarding entries, risk, and management.
Good luck! 🍀
All Strategies Are Good; If Managed Properly!
~Richard Nasr

Why the Reaction Matters More Than the Level!!!Most traders spend their time hunting for the perfect level.✖️
Support. Resistance. Demand. Supply.
They draw the zone… and assume price must react.
But professionals know something crucial:
The level itself is not the edge.
The reaction is.
Here’s why.
1️⃣ Levels Are Common Knowledge
Everyone sees the same support.
Everyone sees the same resistance.
If levels alone were enough, everyone would be profitable.
A level is just a location.📍
It doesn’t tell you who is in control.
2️⃣The Reaction Reveals Intent
What matters is how price behaves at the level.
Ask yourself:
- Does price reject immediately or hesitate?
- Are candles impulsive or overlapping?
- Does price leave the level with strength or drift away slowly?
A strong reaction tells you:
➡️ One side stepped in aggressively.
A weak reaction tells you:
➡️ The level exists… but conviction doesn’t.
3️⃣ Clean Rejections Beat Perfect Levels
A slightly imperfect level with a violent reaction
is far more valuable than a textbook level with no follow-through.
Professionals wait for:
- sharp rejections
- momentum expansion
- structure confirmation
They don’t assume... they observe.
4️⃣ Failed Reactions Are Warnings
When price reaches a level and does nothing…
that silence is information.
Failed reactions often lead to:
- level breaks
- deeper moves
- trend continuation
The market is telling you:
➡️ “This level no longer matters.”
📚The Big Lesson
Levels tell you where to look.
Reactions tell you what to do.
If you shift your focus from drawing levels to reading behavior at levels,
your trading instantly becomes clearer and more objective.
⚠️ Disclaimer: This is not financial advice. Always do your own research and manage risk properly.
📚 Stick to your trading plan regarding entries, risk, and management.
Good luck! 🍀
All Strategies Are Good; If Managed Properly!
~Richard Nasr

BTC — Trendline Rejection or Breakout? BTC is approaching a key structural decision point, and the next move will determine whether we see continuation upward or a corrective sweep to lower liquidity levels. This idea outlines both scenarios with clear targets and educational structure analysis.
Key Structural Areas
1️⃣ Rising Trendline Support
BTC continues to respect a clean ascending trendline. This line has been a major pivot for the past several days.
Price is currently hovering just above it, and the yellow circle marks the confluence of:
Rising trendline support
A local demand block
Prior liquidity sweep zone
This is the most important area to watch for reaction.
2️⃣ Short-Term Rejection Scenario (White Path)
Before breaking upward, BTC may show short-term downside rejection, targeting:
➡️ Short-Term Target:
$88,180
This level aligns with:
Demand block retest
Trendline kiss
Local inefficiencies needing fill
A rejection into 88,180 would be normal and healthy before a potential bullish continuation.
3️⃣ Bullish Reclaim Scenario
If price taps the rejection zone and reclaims the trendline, upside targets remain:
$95,800 – $96,500 → Half-filled FVG + structural supply
$99,500 – $100,200 → Major FVG + macro resistance zone
These zones are where we expect strong reaction and profit-taking.
4️⃣ Breakdown Scenario
If BTC fails the trendline with a full candle close below, expect:
Breakdown of structure
Full sweep of demand
Deeper correction into mid-range levels
Not my primary bias, but it's critical to acknowledge the possibility.
Summary
BTC is sitting on an important trendline.
A quick rejection into 88,180 could be the liquidity grab needed before upside continuation.
Reclaiming the trendline = bullish continuation toward FVGs.
Breaking below = deeper corrective move.
📘 Disclaimer
This analysis is for educational purposes only. It represents personal opinion and not financial advice. Always do your own research and manage your own risk.

Gold 4H – Bearish Harmonic Rejection SetupGold is currently testing a major descending trendline drawn from the previous swing high (Point A). Price has tapped into a strong supply zone / rejection block around 4150–4170, which also aligns with the 0.618 and 0.70 Fibonacci retracement levels taken from the C–D leg projection.
The structure shows a potential harmonic completion, where the market has printed an A–B–C pattern and is now forming the final leg toward D. The repeated rejections from the shaded supply zone indicate weakening bullish momentum.
As long as price remains below this supply region and fails to break the descending trendline, the setup favors a downside continuation, targeting the lower trendline support near 3800–3850, completing the projected D-leg.
Key Highlights:
Price reacting to multi-touch descending trendline
Strong supply zone (4150–4170) aligned with 0.618/0.70 fib
Bearish harmonic structure aiming for D-leg completion
Potential downside target: 3800–3850
Bias remains bearish unless price breaks and holds above the supply zone

EURUSD - The Bears Are Waiting at the Gate!EURUSD remains overall bearish, trading within a falling red channel and respecting the sequence of lower highs and lower lows.
📈Currently, the pair is approaching a massive structure zone highlighted in blue, an area that has acted as both support and resistance multiple times in the past. This zone also aligns perfectly with the upper trendline of the channel, adding even more confluence.
As long as this resistance holds, I’ll be looking for potential short setups, expecting a rejection that could drive price back toward the lower boundary of the channel.
The bears are watching this level closely, will they step in again? 👀
⚠️ Disclaimer: This is not financial advice. Always do your own research and manage risk properly.
📊All Strategies Are Good; If Managed Properly!
~Richard Nasr

Nifty sideways continues and Rejection from 26KHello friends,
Today Nifty Rejected twice the time from 26000 level what we can expect tomorrow can we expect the Bottom ?

Bearish Setup – Rejection from Supply ZonePrice recently swept the previous liquidity near the recent low, confirming that internal liquidity has been collected. Now, the market is showing a potential move back toward the rejection area / order block (OB) above.
Here’s the plan:
Waiting for price to retrace into the rejection area (OB) around 4,038–4,040.
Once we see bearish confirmation on the 1-minute timeframe, we’ll look to enter short.
This zone represents a strong supply area where price previously showed rejection.
After liquidity sweep and retracement, expecting a continuation to the downside targeting new lows.
Key Notes:
Liquidity below recent lows has already been taken.
The current push upward is likely a retracement before a deeper drop.
Watch for bearish price action (engulfing, BOS, or rejection wick) before entering.
Bias: Bearish
Confirmation: 1M timeframe rejection
Targets: New structure low

CADJPY - The Trio Retest Setup!📈CADJPY has been on a strong bullish run lately, but price is now approaching a critical confluence zone, the perfect Trio Retest Setup.
The red circle highlights the intersection of two upper trendlines (the rising channel and the short-term wedge) together with a major horizontal resistance at 111.00.
⚔️This trio intersection creates a powerful technical barrier, suggesting that the pair is overbought in the short term. From here, I’ll be looking for signs of exhaustion or reversal patterns to catch the next corrective leg down.
🔎A potential retracement could send CADJPY back toward the 106.00–105.00 support zone, which also aligns with the lower boundary of the main ascending channel.
Until the trio zone is broken decisively to the upside, the bears might step in to cool off the momentum.
⚠️ Disclaimer: This is not financial advice. Always do your own research and manage risk properly.
📊All Strategies Are Good; If Managed Properly!
~Richard Nasr

AUDUSD - Buy the dip at daily support!AUDUSD is still traveling inside a broader descending channel, but on the H1 we’ve carved a tight range/contracting structure.
Price is now approaching a daily support zone that aligns with the channel’s lower boundary and a local rising base—strong confluence for a bounce.
I’ll look for longs from the green support area after a clear H1 bullish reaction (wick rejections, bullish engulfing, or break–retest of the intraday lower-high line). If triggered, I’ll trail into the range highs first, then the upper orange boundary.
All Strategies Are Good; If Managed Properly!
~Richard Nasr.

EURCAD – Waiting for the Perfect ConfluenceEURCAD remains overall bullish while trading inside a rising channel.
At the moment, price is approaching the intersection of the channel’s lower trendline and the horizontal structure zone.
That’s where I’ll be watching closely for trend-following long setups, ideally a rejection or reversal confirmation around that confluence area.
As long as this structure holds, the bulls remain in control, and we could see a continuation toward the upper bound of the channel.
⚠️ Disclaimer: This is not financial advice. Always do your own research and manage risk properly.
📚 Stick to your trading plan regarding entries, risk, and management.
Good luck! 🍀
All Strategies Are Good; If Managed Properly!
~Richard Nasr

XAUUSD – 1H Correction From Rejection ZoneOANDA:XAUUSD
Market Trend | Structure | Reaction Zone
Gold remains bullish overall, but after testing the channel top near $3,985–$3,990, price shows clear rejection candles and slowing momentum. A short-term correction is now likely before the next impulse leg.
Market Scenario
📉 If bearish confirmation holds below the rejection zone, expect a corrective pullback toward demand.
This would allow price to retest structure supports before any continuation toward new highs.
Key Targets (Correction Move)
🎯 Target 1: $3,950–$3,945 → Demand retest zone (300–400 pips)
🎯 Target 2: $3,930–$3,925 → Trendline support zone (600–700 pips)
🎯 Target 3: $3,900–$3,895 → Mid-support area (900–1,100 pips)
Invalidation Zone
❌ Close above $3,995–$4,000 cancels correction setup — continuation to new highs likely.
⚠️ Disclaimer: Educational purpose only. Not financial advice.

NEAR – Post-Breakout Impulse in Play!NEAR has already broken out of its accumulation phase, confirming the end of its consolidation and the start of a fresh impulsive leg within the macro falling channel.
As long as price holds above the $2.80–$3.00 breakout zone, the bullish structure remains intact, with the next targets at $4.20–$4.80 and potentially $6.00–$7.00 — the upper boundary of the channel and a key confluence zone.
If price slips back below $2.80, it would signal a failed breakout and a possible retest of the previous lows.
⚠️ Disclaimer: This is not financial advice. Always do your own research and manage risk properly.
📚 Stick to your trading plan regarding entries, risk, and management.
Good luck! 🍀
All Strategies Are Good; If Managed Properly!
~Richard Nasr

USDJPY - Range Floor + Trend Support = ConfluenceUSDJPY remains overall bullish within a rising channel, while price has been ranging between a lower demand band and the upper supply.
We’re now dipping into the 146.0–146.7 support area, which aligns with the channel’s lower boundary — a classic confluence zone to hunt for longs.
🔑 Key levels
Support: 146.0–146.7 (range floor + channel support)
Resistance: 149.8–151.0 (range top / supply)
📊 Scenarios
Bullish 📈 Look for a higher-low / bullish candle from 146s → path toward 149.8–151.0.
Bearish 📉 Daily close below 146.0 would invalidate the setup and open a deeper pullback before buyers try again.
Do you buy the retest into the 146s, or wait for momentum to kick in first? 🤔
⚠️ Disclaimer: This is not financial advice. Always do your own research and manage risk properly.
📚 Stick to your trading plan regarding entries, risk, and management.
Good luck! 🍀
All Strategies Are Good; If Managed Properly!
~Richard Nasr

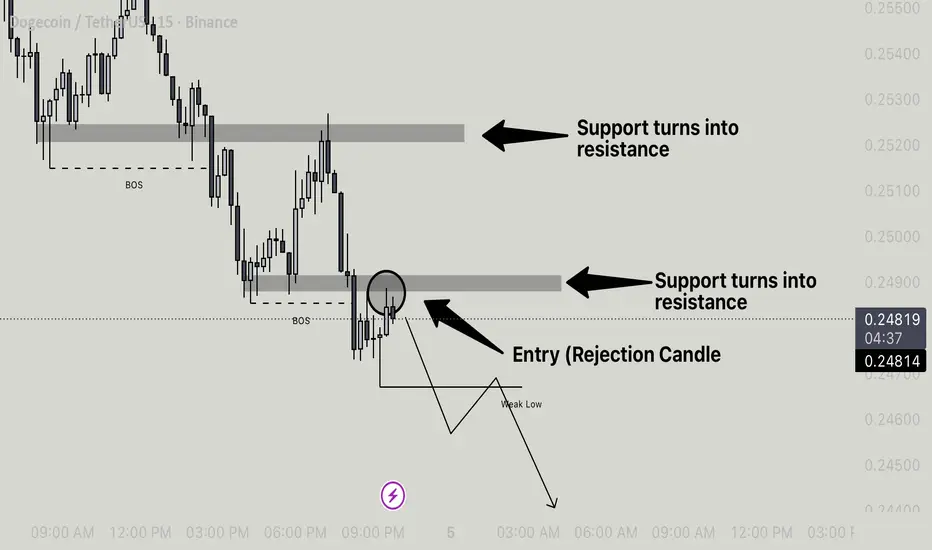
Doge/Usdt - Support Turned Resistance With BOS Bearish Setup 1. Support Turned Resistance (STR)
• The price initially had a support zone that later got broken.
• After the breakdown, that same zone is now acting as resistance (highlighted grey zones).
• This confirms a bearish shift in structure.
2. BOS (Break of Structure)
• The BOS mark shows that a previous low was broken, indicating bearish market intent.
• This is often used by traders to confirm continuation in the downward direction.
3. Rejection Candle (Entry Point)
• After the BOS, the price retraced back into the resistance zone (previous support).
• A rejection candle formed inside that zone, signaling sellers are defending it.
• This is the entry trigger for a short trade.
4. Weak Low & Target
• The chart suggests that the recent low is weak and likely to be taken out.
• The target is placed below that weak low, expecting continuation to the downside.
Trade Idea Summary
• Bias: Bearish
• Entry: On rejection candle at support-turned-resistance.
• Confirmation: BOS already occurred, validating bearish structure.
• Target: Below weak low (marked).
• Stop Loss: Should be placed slightly above the resistance zone (not shown but recommended).
This setup is a classic support-turned-resistance with BOS confirmation—a strong bearish continuation pattern.
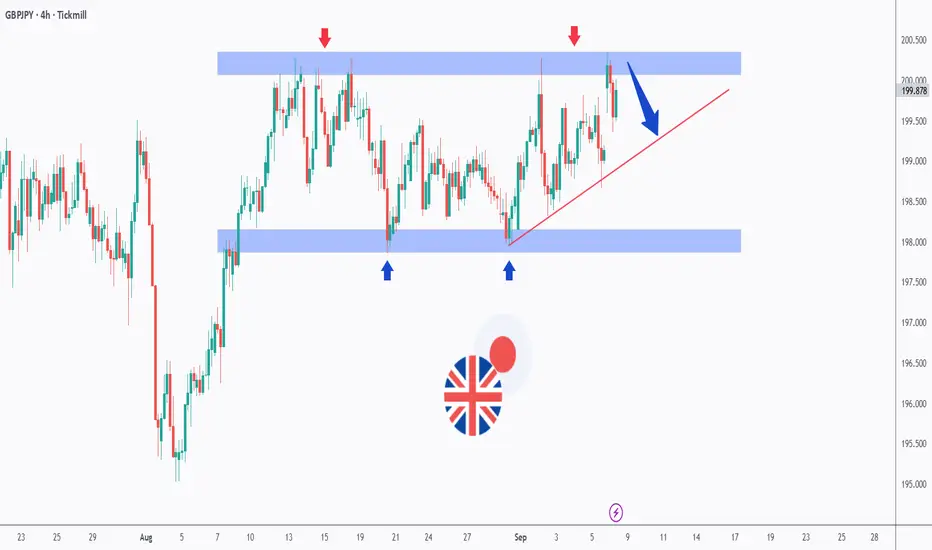
GBPJPY – Testing the Range Once AgainGBPJPY has been stuck in a wide range between 198.00 (support) and 200.50 (resistance) for several weeks now.
🔻 Sellers continue to defend the upper boundary (red arrows).
🔹 Buyers are stepping in around the 198.00 demand zone (blue arrows).
📈 Price is currently rejecting the resistance area once more while also sitting above the rising trendline (red).
If the resistance holds, we could see a rejection toward the lower bound of the range. On the other hand, a clean breakout above 200.50 would be needed for bulls to take full control. 🚀
This setup makes GBPJPY one of the key pairs to watch in the coming days.
Disclaimer:
This analysis is for educational purposes only and does not constitute financial advice. Always do your own research and follow your trading plan before making any investment decisions.
📚 Stick to your trading plan regarding entries, risk management, and trade execution.
Good luck!
All Strategies Are Good; If Managed Properly!
~Richard Nasr
POL – Demand in Action!Price has been rejecting the resistance zone around 0.2620 – 0.2677 and is now approaching a key demand/support area near 0.2320 – 0.2270.
✅ If buyers step in here, we could see another bullish impulse toward the resistance levels.
✅ The demand zone remains a crucial area to watch for trend-following setups.
⚠️ However, a clear break below the 0.2270 support would invalidate this bullish scenario and shift the bias.
For now, I’m watching how price reacts at the green demand zone for the next potential swing.
📚 Always follow your trading plan regarding entry, risk management, and trade management.
Good luck!
All Strategies Are Good; If Managed Properly!
~Richard Nasr
