BITCOIN UPDATEas expected, price rejected our round number 10.00 and resistance/supply zone in blue.
then price found support around our lower red trendline forming a new swing around it, so our red trendline is now valid and we are waiting for an objective break below it to sell Bitcoin long-term.
meanwhile, price is retesting our 10.00 level again so we will be looking for objective sell setups on lower timeframes.
unless price breaks aggressively above our 10.0 and 11.0 levels (zone) then we will be looking for objective buy setups on lower timeframes on its retest.
Rejection

CADCHF - Trading the rangeCADCHF is currently at the top of a sideways trend.
We already had a good reaction by sellers, with a big candlestick showing a strong upper shadow right on the level of resistance.
As usual, in ranging markets I prefer using oscillators instead of trending indicators. In this case, I use the MACD, that is a momentum indicator that here clearly shows how buyers are losing momentum. You can learn more about the MACD here: www.youtube.com
Risk to reward ratio is almost 1:3, so good luck :)


USDCAD UPDATEas expected, price rejected our upper green trendline and traded lower.
and since price didn't break above our orange resistance, we are still overall bearish.
price is retesting our green trendline again so we will be looking for objective sell setups on lower timeframes.
Unless price breaks our orange trendline objectively, then we will be looking for objective buy setups on its retest

BTC Short As it rejects the Elliott Correlation wave, we expect to touch the support before going up.
Open Short = 9750-9850
Stop Loss = 9978
Targets = 9680, 9570, 9630, 9420, 9280
Leverage cross maximum of 2% investment.

$ES_F inverse h&s into top trendline than dump $SPY $AAPL $SPX
hello, so as depicted in the chart, i think that $ES_F inverse head and shoulders will breakout to around the hourly fib 88.6% which just so happens to be exactly in line with the top yellow trendline. I think it will dump from there.


Future Predictions on GUContinuation for the short positions, until price reaches the weekly rejections. We should see alot of bullish momentum in the near future. OR we can potential see a weekend market gap and straight bullish momentum.


GBPJPY potential buy setup formingOn Daily: price is currently sitting around support 130.0 so we will be looking for objective buy setups on lower timeframes.
Unless price breaks our support downward aggressively, then a movement till 125.0 would be expected and we will be looking for objective sell setups on 130.0 retest.
On M30: price is currently trading inside our red channel (not objective yet). we are waiting for a third swing to form around our upper red trendline for it to be valid and then enter on its break upward.
our entry would be above the last swing that forms around the red for extra confirmation (not the trendline break)
we also have divergence forming on MACD adding more confluence to our buy setup.

USDCAD Entry On 15MDo your own analysis ...
Dont Forget Moving StopLoss At Breakeven
Disclaimer!
This post does not provide financial advice. It is for educational purposes only! You can use the information from the post to make your own trading plan for the market. You must do your own research and use it as the priority. Trading is risky, and it is not suitable for everyone. Only you can be responsible for your trading.

EURUSD - Breakout of the up-channel?EUR/USD offers a great opportunity to trade a beautiful candle showing a rejection in the upper part of the up-channel.
Short-term trend is up and it is well represented by the chart pattern that we are studying, but long term trend is not so clear, in my opinion.
Fundamentals are against EUR, recently. The setup of the moving average also slighlty prefers short positions.
With this risk to reward ratio, it is definitely worth a try.
Also, you can consider to have a first take profit at the bottom of the channel, while a second take profit as shown in the analysis, trading the breakout.

GBPCAD potential bullish movementGBPCAD potential bullish movement.
we are waiting for a momentum candle close above 1.731 (in purple) to buy this one
Reason:
1- Objective Ascending Triangle (in blue)
2- Divergence on MACD (in red)
3- Support zone from Daily
Three confluences are enough to consider Buying GBPCAD, after a break below 1.731 (in purple)
*meanwhile, this pair is overall bearish, and if price breaks below our lower blue trendline, then a long-term bearish movement would be expected

GBPAUD ShortWe have a nice Daily formation and at 4h chart we can see also some rejection at this resistance.
Its possible the price to spike down with the coming news.
Pending orders is better here

CADJPY with an outstanding risk to reward ratio!Bearish engulfing pattern on a downtrend line for CADJPY.
Last week, JPY has been one of the weakest currencies, while CAD has been one of the strongest. In terms of market action, I normally would wait for a confirmation, since buyers have been very strong.
The opportunity offered by the risk to reward ratio (up to 1:10!) that we can get, leads me to take this trade on the bearish engulfing pattern on the key-level, without waiting for a second confirmation.
I'm planning to take part of the profits on each potential level of support highlighted by the pink rectangles.
Good luck!
EURJPY - Swing Trading sell ideaEURJPY had a very strong short-term up-movement, especially due to a very weak Japanese Yen in the past 2 days.
In the long term, I still believe that the market is bearish:
We have the chance to trade the rejection on a very good level of resistance.
Although the first reaction is promising, we have a bearish engulfing pattern, the market is coming from a very strong up-movement, so I want to wait for a second confirmation.
There's a candlestick (the one where the red horizontal line starts) that shows a first attempt by sellers to push the price down, but buyers proved to be strong enough and we had a so-called pin bar.
This is a second attempt and we want to see sellers closing the session below the low formed by last attempt, so I place a stop entry order below it, below the red horizontal line.
Stop loss above the resistance and take profit slightly above last important long-term swing low, where I will evaluate if it is better to take the profits or keep the trade for a breakout and a new lower low.

AUDNZD 1D | Market Outlook- In the bigger picture, there is no clear sign of trend reversal yet. The larger down trend from (2011 high) is still in favor to extend.
- AUDNZD is currently rejecting a key resistance level and offering a short opportunity.
Regards, GoldfXcc Team

AUDJPY Will price make it back to the pivot? This is a full breakdown of my perception of price action on higher time frames! I take my entries using smaller time frame confirmation and you should, too. If you have any questions about this trade or my strategies feel free to ask them in the comment section below!
Let’s make some money together!

GBPAUD BREAK RETEST SCENARIO-Downtrend.
-Break of level, now waiting for retest.
-Would like to see 2-3 or more wicks at 1.92750.
I will not enter the trade without rejection. Will update.

USDCAD Entry on 15MINDo your own analysis ...
Dont Forget Moving StopLoss At Breakeven
Disclaimer!
This post does not provide financial advice. It is for educational purposes only! You can use the information from the post to make your own trading plan for the market. You must do your own research and use it as the priority. Trading is risky, and it is not suitable for everyone. Only you can be responsible for your trading.

Price action & Psychology - Triple bottom, rejectionHello !
Key points:
Triple bottom
Rejection at support
Spike in volume
That price rejection actually tells us that people were afraid and panic sold at open, driving the price down until it encountered some buying pressure and price went back up.
When gauging this candlestick pattern, it is important that :
It is at a support level
Occurs after a selling wave
Shadow/wick goes below previous swing point low
A volume increase
An obvious wider price range
Look at the previous candlestick, it clearly tells us that there was some buying pressure but not enough momentum to carry the price up. Furthermore, it pulled back, I'd guess, halfway at previous "resistance" from the second bottom.
Thanks for reading and if you have suggestions or wanna discuss the idea, just leave a comment, I'll be happy to answer.
***Disclaimer : This is not an advice to buy the stock. Please, be aware that trading is a matter of probabilities and that it takes only ONE trader to deny your trade.***


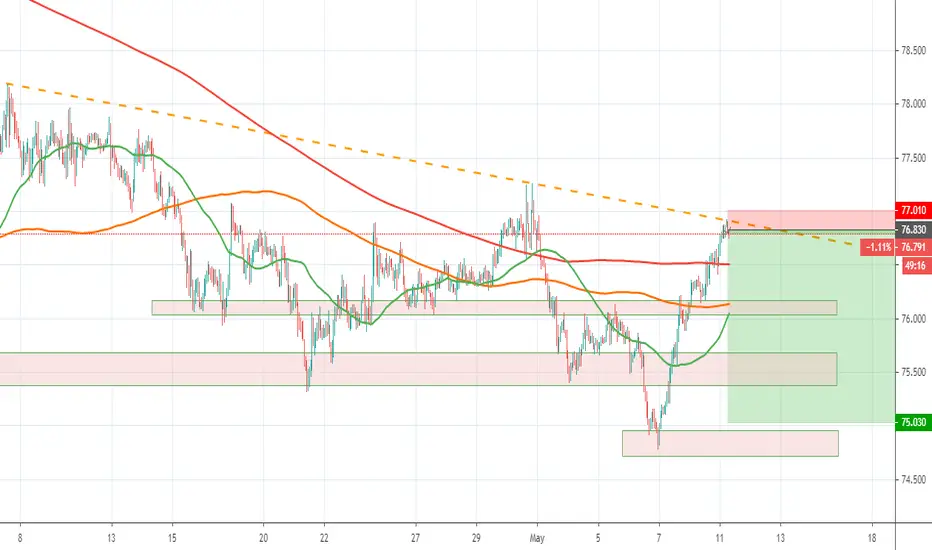
USDCAD two possible ScenariosUSDCAD H4 - TWO POSSIBLE SCENARIOS
this pair is trading inside this green channel, so we are overall bearish here.
price is now sitting around the upper green trendline and orange resistance, so we may expect a downward movement from here
unless price breaks above the orange level 1.4200 upward aggressively, then an upward movement till around 1.4650 would be expected
as mentioned, for now, this pair is overall bearish (going downward), in this case, the first main rejection area is the lower green trendline and blue level 1.380
if price breaks below the blue level 1.3800, then a downward movement till around 1.3500 would be expected
