My first study using RENKO charts WOW! So revealing.....My first study using #RENKO charts WOW! So revealing....(or not). You decide. NOT ADVICE. DYOR.
NOT ADVICE DYOR
Renko

ENJ is an exceptionEverything goes down, ENJ goes up... The charts are (BTC, BNB, ENJ, MATIC to show the contrast
The other notable coins opposing the dump:

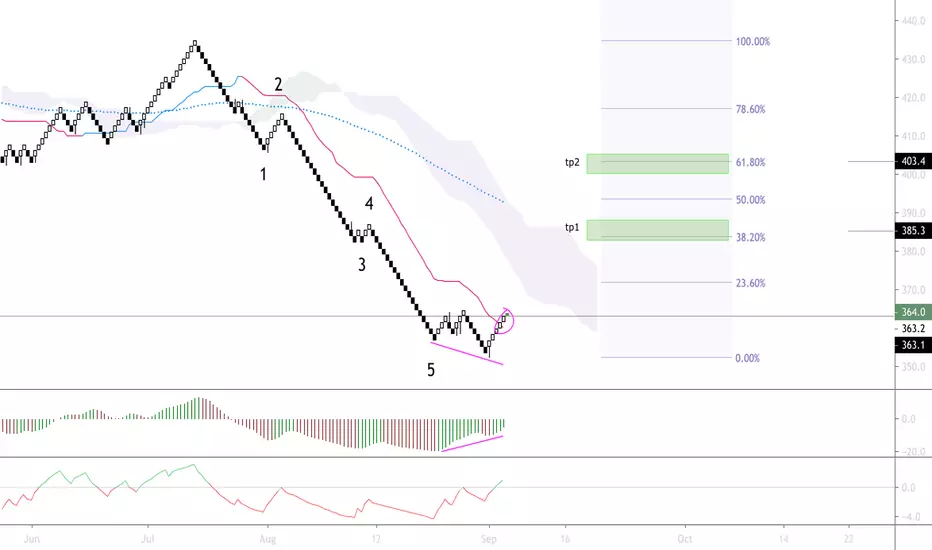
XRP Renko trendlinesUsed the renko daily chart. Trendlines show XRP hitting $1 between February and July 2020, then $2 in November’20, if price stays in the range of these channels.

Renko outlookRenko filters all the noise out.
Current daily, weekly and monthly renko bricks are ALL red.
Add to that, this year, EURUSD missed its yearly pivot (1.17386) and didnt even retest it (heavy bearish market, missed pivots mark the beginning of trends).
Long term, EURUSD is likely to drop to the next Renko weekly swing low, which corresponds to yearly MS2.

GBPUSD Bearish bounce - RenkoGBPUSD has had a bearish bounce on my set up.
Look how historically the currency has acted once it bounced.
Potential for a big move if it breaks into buy zone.

GBP/USD SHORTGood day,
The GBP/USD cross is offering a sell signal this evening.
Signal:
- Double top
- RSI breakdown
- MACD bearing divergence
Note:
- Protect pips if there is a flurry of activity around the Haiken Ashi (smoothed) line
Potential Drivers:
- Pound selling due to political activity
- Risk off flows bidding up the dollar / pushing down the Pound
All the best,
AL

EUR/USD SHORT
EUR/USD is sending a rather firm sell signal this evening.
Signal:
- Price trading off of elevated ATR channel
- Second run/test of Haiken Ashi (smoothed)
- Triple top
- RSI breakdown
Potential Triggers:
- Risk off flows bid up the dollar/ push down the euro
- Potential dollar bid if US data attracts fresh capital
All the best,
AL

Breach 9,550 and it's all over for Bitcoin BearsHope you're long Bitcoin...if not, appears to be about $150 of this dip left to buy. Momentum is once again with the bulls. Watch for $9,200 to hold on the next dip for "confirmation" but this is as good a spot as any to get long.

Lufthansa ready to fly to higher altitudesOof, I will just be honest here, chances like this you won't find often. Longing this like there is no tomorrow.
- Kumo break with some cooldown
- Clear bull div on the renko chart (pretty big brick size)
- 3 bricks printed = my confirmation to go in this case.
- OBV seems to have bottomed out nicely.
Target: 20% longerterm.

Renko Dynamic Index and Zones - Video 3Continuing on trade ideas from video 2 for Renko Dynamic Index and Renko Dynamic Index Zones using a few simple rules.
Other indicators powered by the Renko Engine :
Renko RSI
Renko Trend Momentum
Renko Weis/Ord Wave Volume
Renko MACD and Renko MACD Overlay
Strategies:
RSI-RENKO DIVINE™ Strategy

Renko Dynamic Index and Zones - Video 2I start getting into how I trade the Renko Dynamic Index and Renko Dynamic Index Zones using a few simple rules. I introduce some new coloring schemes and trade direction discovery algorithms.
Other indicators powered by the Renko Engine :
Renko RSI
Renko Trend Momentum
Renko Weis/Ord Wave Volume
Renko MACD and Renko MACD Overlay
Strategies:
RSI-RENKO DIVINE™ Strategy

Bitcoin Renko Chart 6 hourLow time frame
Renko chart for Bitcoin
with moon cycles, trend lines , cloud, RSI , and indicators..
Enjoy

Three Buddhas on a Kagi chartAs you can see, TVC:GOLD formed a very rare yet really strong pattern called ‘Three Buddhas’. This pattern is similar but identical to the western ‘Head and Shoulders’. Notice how the third Buddha’s leg is breaking two resistance (waists in Kagi terminology). Considering the high price of the precious metal now, it could be a reversal point since the chart has already turned red. Renko chart is also showing the first red brick in the series, so better short now.

Litecoin ready to break its bear cycleJust like all the other big caps and blue chips, Litecoin is showing a shift in momentum.
- Big divergence on higher timeframes.
- Super tight daily OBV channel.
- 6H kumo breakout + some healthy retracement.
- Conservative target on the chart.
Litecoin looks ready for a pump.
Also take a look at one of my older charts on the Bitcoin dominance
The idea is playing out, supports are broken. Altcoins is where you need to focus on now.
Good luck!

Aviva ready for a GOOD move upI'm not from the future, but i can guarantee you this will move up to at least TP1.
Of course I'm joking, but I am definitely long here.
- Divergence playing out after 5 wave down move
- Close above kijun on the 4H renko > super saiyan signal
Long SBM OffshoreLong SBM Offshore
- New uptrend started
- Close above 150EMA > rejected, but managed to close above again + break the swing high.
Keeping it Simple Renko with ATR TrailingNewbie trying to keep the chart simple by using Renko and an ATR based trailing stop.
Renko MACD and Renko MACD Trend IntroductionI introduce the Renko MACD and Renko MACD Trend indicators.
Other indicators powered by the Renko Engine:
Renko RSI
Renko Trend Momentum
Renko Weis/Ord Wave Volume
Strategies:
RSI-RENKO DIVINE Strategy

RSI-RENKO Divine Strategy - Merge Feature IntroductionI introduce the RENKO - RSI Merge feature. I am very happy about this as it solves draw down problems as well as sub-optimal entries after oversold or overbought conditions in a long/short trend.

A Renko Strategy for Trading - Part 9This is intended more as educational material on a strategy for using renko charts. To begin with, I'll be using USOil in the examples but will include other markets as I continue through the series. The material is not intended to prescribe or recommend actual trades as the decision to place trades is the responsibility of each individual who trades as they assume all risks for their own positions and accounts.
Chart setup :
(Part 1)
Double Exponential Moving Average (DEMA) 12 black line
Double Exponential Moving Average (DEMA) 20 red line
Parabolic SAR (PSAR) 0.09/0.09/.23 blue circles
Simple Moving Average (SA) 20 blue line
(Part 2)
Stochastics 5, 3, 3 with boundaries 80/20 dark blue/light blue
Stochastics 50, 3, 3 with boundaries 55/45 red
Overlay these two on one indicator. Refer to 'Part 2' as to how to do this
(Part 3)
True Strength Indicator (TSI) 14/4/4 dark blue/ red
Directional Movement Indicator DMI 14/14 ADX-dark green, +DI-dark blue, -DI-red
Renko Chart Settings
Crude Oil (TVC:USOil): renko/traditional/blksize .05/.10/.25
Natural Gas (ngas): renko/traditional/blksize .005/.010/.025
Soybeans/Wheat/Corn (soybnusd/wheatusd/cornusd): can use the ngas setup
S&P 500 (spx500usd): renko/traditional/blksize 2.5/5.0/12.5
Euros (EURUSD): renko/traditional/blksize .0005/.0010/.0025


Part 1: explains the Alnami Quantum blocks v.4 systemThis video is in Arabic and explains strategies 1 & 2 of the quantum blocks system v.4

Renko Percentage Move Based SystemThe (Al Nami Quantum Blocks v.4) script is based on Renko chart that is based on % move of the selected symbol. This is different from the traditional or ATR based Renko charts..
box size = user selected percentage x current price
Alnami Quantum Blocks Channel is composed of 5 levels that are calculated based on the box size:
1- Base
2- Green Box High (GBH) = Base + box size
3- Next Green Box trigger (GBN) = base + (box size x 2)
4- Red Box Low (RBL) = Base - box size
5- Next Red Box trigger (RBN) = base - (box size x 2)
Those levels will appear in the chart with the following order:
------GBN-------
------GBH-------
------BASE------
------RBL-------
------RBN-------
Usually when prices are trending up, the price will stay above the base for most of the time,, when it trending downwards, price stays below base most of the time..
Now how to time your entries based on the channel? This system is equipped with 4 strategies:
1) New Green Box:
When the channel draw a new green box, place a buy order
When the channel draw a new red box after a green box, place a sell order
2) Retracement:
The user have to select one of the above 5 levels to serve as a retracement level, namely, GBN-GBH-Base-RBL-RBN
When the current box is green and low price crosses below the selected level, place a limit buy order at the selected level
When the channel draw a new red box after a green box, place a sell order
3) Auto-Trailing System:
This strategy draws two levels based on a proprietary quantitative algorithm.
When the background color change to green, prices are moving in an upward trend
When the background color change to red, prices are moving in an downward trend
When the background color change to black, prices are moving in range
If the price is above both lines, place a buy order
If the price is below the lower line, place a sell order
Happy trading,
Abdullah Al-Nami
