Two scenarios for BitcoinBitcoin reached the target we previously predicted (see idea below)
But what are the scenarios facing Bitcoin at this stage?
There are two scenarios for Bitcoin at this stage.
1-The first scenario is the respect of Bitcoin to the previous support area in the Point and Figure and RENKO charts.
Bitcoin may have respect for this support range. The reasons for this can be seen in the candlestick chart.
The dynamic RSI oscillator has entered the oversold area and the wave trend indicator is located on the middle support of the channel.
2-The second scenario is determined by the volume profile and momentum oscillators in the monthly time frame.
Bitcoin's volume profile has a small trading volume in this area (40500) and will not be able to create the accumulation area needed to reverse the trend.
In fact, the next POC area looks like $ 34,700, and Bitcoin is likely to create its next Lateral movement area around this price. (29700 - 40500)
But the next important issue is that with the breaking down of support at 40,500 in the monthly time frame, the trend wave oscillator will leave the overbought area, which can be an important signal for the continuation of the downward trend in the future.
Renko

Matic Head and shoulders formationMatic 4h is developing Potential head and shoulders formation on Renko 4h. If breaks targets would be around 1.3$ around fib levels 0.618

Bytom descending wedge patternBytom has a descending wedge pattern. On the other hand in the Renko chart, we can see a range area which can be an accumulation area.
We can detect positive divergence on the RSI

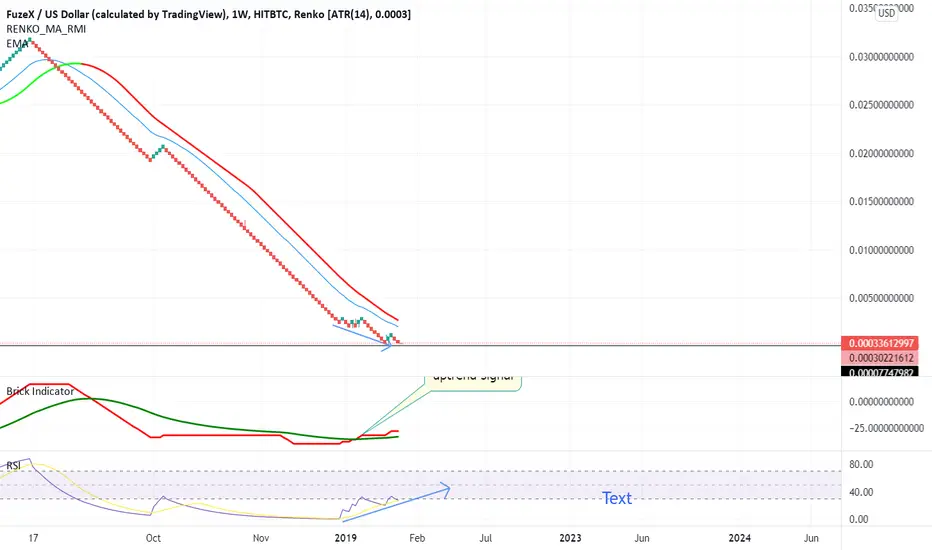
FXT is preparing for uptrendHi
It seems FXT is preparing for uptrend.
Brick indicator shows an uptrend signal.
Also we can see positive divergence on RSI
Renko BTCUSDRenko BTCUSD Down
Things are very difficult, it may come down more with more caution and then caution
This is just a simple and humble analysis

NEARUSDT Will go to the moon in few days. Hello guys
Are you ready to jump in NEAR ??
Full instructions for 3 days of Days Trading... Don't forget to follow

AYA breaks up range areaHi dear traders
This post is a continuation and confirmation of the following post. We have already talked about the upward potential
AYA breaks up the range area. This is a very good sign for upward movement. Confirmation of this signal depends on whether it does not re-enter the range area. this is one of the signals of a possible uptrend in the future

BTC is Ready for breakdown the Range area supportHi
it seems BTC is ready for breakdown of the range area support line. Momentum indicators indicate a potential downtrend. To confirm breakdown, wait for Bitcoin to leave the range area with at least 2 bricks.

AIM HIGH - Just my thoughts and analysis. All charts say bullish market. All charts must agree to make money. Remember to manage your money wisely.
S1/UP

Will BTC breaks down the range area?Hi
Bitcoin is declining towards its support in the range area. If it breaks down the support at 45899, the next target will be $ 35,000

Crypto Index Analysis Hi
I want to analyze the Crypto Index chart. First, let look at the weekly candle chart.CIX is now above the POC support line. It seems the Valid support line is about around 273,000.
Renko Chart:
CIX is in a range area. If the CIA breaks down the range area, the first target will be 264,000. If the CIA breaks up the area, it could be an early sign of an uptrend.

Add DGB to your watchlistDGB is in a range area. It has lost more than 80% of its ATH price. 50% buy can be done at this price. There is a possibility of price reduction up to 0.023. If the price is reduced to that range, another 50% can be purchased.

Ichimolu analysis of Renko chartConfirm two of the three conditions of the Ichimoku strategy
1- The cloud has turned red
2- We see red bricks of Renko chart under the cloud
3- For the final confirmation, we have to wait for the lag line to go down under the cloud


BNB Renko chart Analysis BNB breakdown the range area. All Renko brick indicators confirm the downtrend.


BTC is forming a bearish triangleBTC is forming a bearish triangle. bearish triangle usually breakout to the downside

Doge coin Renko chartDogeCoin has returned to the Range area after its breakup. This is not a good sign for Dodge coin and could be the first sign that the downtrend is continuing. If this trend continues, the first target will be $ 0.13

GBPUSD set for further decline Starting this year, a declining channel has been set up as seen by the maroon coloured lines.
In Dec, we broke below this channel displaying a more bearish sentiment.
A very strong support lies around 1.31836, this is a multi-year support/resistance from 2017,2018, 2019 & 2020
Firstly a retest and rejection of the channel will be a great first indication of further bearish movement.
Secondly, a clear break through a multi-year support will confirm the downside.
First TP ( 2:1 ratio) will be around 1.29388 as there is a strong weekly support, to be catious close half of your position around if candle shows long wicks (weakdness)
Second TP (4:1) will be around 1.27137. There is a very strongly weekly support around this region.
Set stop loss just slightly above the channel as show, after first TP move your stop loss to slightly above 1.29388.
All charts, daily, weekly and even renko charts display a bearish sentiment.
Trade easy and simple with good risk to reward ratios. I do not sell any signals, just a retail trader that enjoys trading.

It's not bad to review "Renko" charts .XRP is interesting .I'm relaxing and look at XRP's reaction to red zone .And BTC's act at 47k-48k.

Multiple Chart TypesConsider using multiple chart types when performing technical analysis for a clearer picture of what the market may be telling you. Here is a tri-screen view of Traditional Japanese Candles on top, Renko Candles in the middle, and Heiken-Ashi Candles on the bottom. Each setup has something to share.

$SHIB to delete 1 zero soon and might flip $SOL?Using the renko chart, $SHIB currently in an uptrend after a healthy correction.
If the trend continues, it might delete 1 zero targeting around $0.00010943. Using the Coinmarketcap (CMC) as of this time that would equate to $SHIB marketcap of $60,087,521,630.67 ( 549,095,509,738,353 SHIB Circulating supply x $0.00010943).
Currently, $SOL marketcap stands at $59,371,213,848 while $ADA at $66,413,012,594. Making $SHIB possibly flip $SOL at top 6 based on today's marketcap.
Strong support is seen at 0.00005716. Trade cautiously.
Disclaimer: Trading and investing have risk. Always DYOR. Trade cautiously.

