Need to reclaim 45kMy initial thought here is that we need to push through previous reversal bricks to eliminate retesting Aug lows before the parabolic run.
I have mostly stayed out of leveraged positions during this chop and I am patiently waiting for more conviction. I will continue to long dark blue reversals and short the dark reds with divergence confirmation.
If there is enough interest in this post I will happily explain the strategy I deploy and post more intraday trades.
Have a great Q4 :)
Renko


XAUUSD August 17th Analysis Renko chart is used for better price action entry. To the right is 30 min chart showing bearish divergence. Once price closes below 1784.483 expecting price to reach 1766 area.

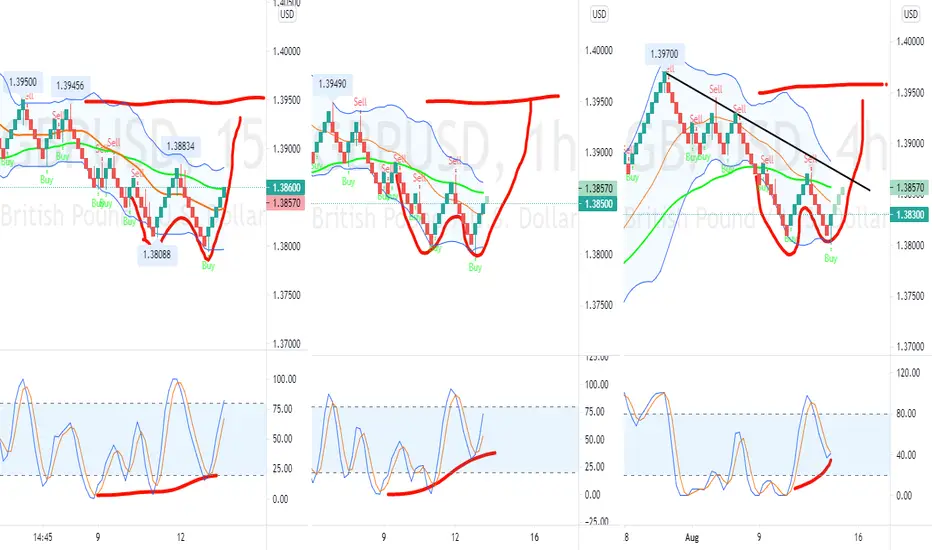
GBPUSD/GOLD Renko Aug 13th Analysis/TutorialGBPUSD chart is setup with traditional renko and each box is 10 pips (0.001) in settings. Added the renko reversal alert to be notified when reversal happens. If you are not familiar with traditional renko each box won't close until the right pip amount is moved and the time frame closes with that pip amount.
So for 15 min. If price moves 10 pips up and 15 min hasn't closed yet you will notice there will be a light shade of the box. Once 15 min closes the box will be set in stone on the chart. 15 min renko on 10 pips matches 1H candlesticks in a sense as far as movement.
At the bottom you will see I also have the Stochastic RSI indicator which can help identify divergence. Stoch RSI setting is default. Bollinger band setting default and i have the 50 ema added on as well.
Traditional Renko can help identify trend easier and help with SL/TP at your discretion. Also used on GOLD (XAUUSD) with same settings and box set at 20 pips (2). Following a 10 pip/20 pip a day trading plan can be beneficial with these settings if you enter correctly. Less eye traffic with renko compared to candlesticks. Personally like to use 15 min.
Analysis- You can see divergence and double bottom formed on multiple time frames. Expecting price to break down trend and reach 1.39500.
Renko Chart Bullish Renko chart meaning Brick in Japanese which is use for long term trend. It had flipped Green and market seems ready for a powerful uptrend.

FSLY Fastly Head and Shoulders Price TargetThe head and shoulders pattern is one of the most reliable trend reversal patterns.
The distance from the neckline to the head is the same for the retracement from the neckline to the bottom.
In this case, using Renko candles to understand better the H&S chart pattern, the price target is 31usd.

Bitcoin in Renko ModelThis is just an analysis and probability.
in the Bitcoin Renko model. Each time A Shape appears like a Reverse hammer at the bottom of the chart. The bitcoin trend has been upward.
Each time a Shooting Star appears on the floor of the chart. Bitcoin trend has been declining.
Sometimes a Hammer appears at the bottom of the chart after the Reverse hammer And bitcoin has gone up

USDJPY Long midterm (RENCO analisys)USDJPY is giving a positive signal for long position for the next 24-36 trading hours and I am expecting it to hit the resistance level of 110.70 within this period of time. As per my Renko strategy the green bar is above 10 MA and the OBV pointed up. RSI and Stochastic also rising from the oversold position upwards, which is a great confirmation for Buy. Stay tuned guys!

AAPL renko plot guessesThis is long term, so don't pay attention to the future part of the chart. Just a general price action guess based on just the chart.
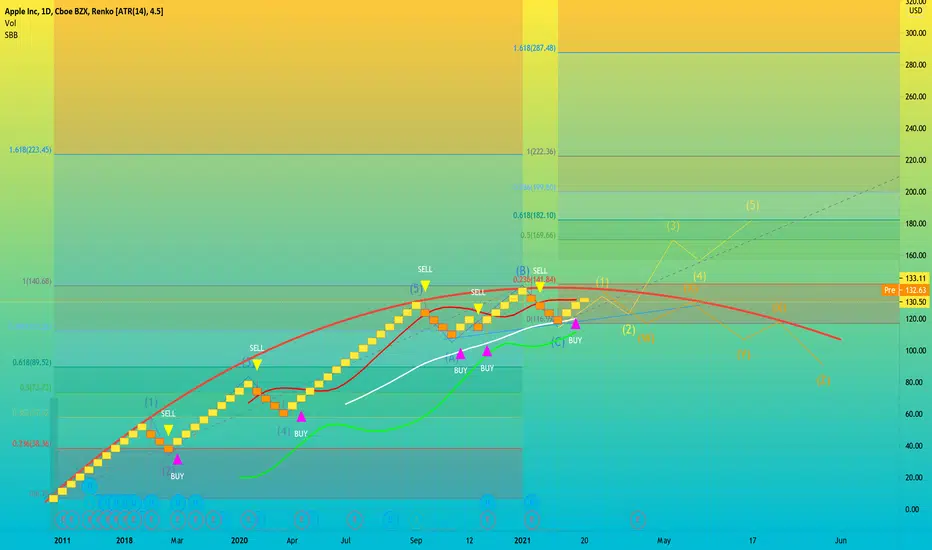

AAPL RENKO Despite being a firm supporter of technical analysis with the bar chart or candlesticks, the management of the position, entry and especially exit, I have been doing with brick renko for a few years, with CLEARLY superior results.
This is because price is the thing that matters most in trading.
Renko bricks have the great advantage of eliminating background noise.
Lazy Bull

doge renkos daily What could go wrong? Doge Is going to get pumped up again In time. Let's face It the people want It. With yesterdays pumping and dumping and Elon Musks Intervention with BTC, I know things worked out nicely for me. Now I hear doge Is offering defi as a service. Which Is only relevant because dogecoin has some purpose for the first time other than a store of value. Will this trend continue? I've road two highs now with Elon Musk Intervening both times. Plus the market making opportunities when It trades at high volatility don't hurt Will we see continuous market manipulation, and explosive behavior again In time In regards to dogecoin. I think the trend will continue.

Multi-chart layoutConsider using different styles of charts simultaneously for a clearer view of what the market is presenting.
Top: Traditional candles with fractal breakout levels.
Middle: Point and Figure candles for cleaner price action.
Bottom: Renko candles with a simple reversal strategy.

ICXUSD renko chart is a buyFundamentals are great and crypto market is bullish. This could be a start of multi-month up trend for ICX.

Seeing Machines chart update - renkoRenko chart is extremely clear on the 4h eliminating all the messy ranging moves. It was a clear buy since 26 Oct again on SEE when renko started to tick up already, today move is just the proof. Targets are still the same as originally described in my previous post. Current ABC move ends around end of 2021, by then this share will be in multiples of current SP. The only surprise can be that instead of ABC it will be a Five move up with even bigger impulse. Easy 10 bagger in a year.
Without even talking about its fundamentals.

Time to prepare shortsGetting ready to cross the SMA10 on the Renko chart, having OBV trending down. Once SMA10 is crossed and OBV continues down, there will be great short opportunities.
About Renko Charts
A Renko chart is a type of chart, developed by the Japanese, that is built using price movement rather than both price and standardized time intervals like most charts are. It is thought to be named after the Japanese word for bricks, "renga," since the chart looks like a series of bricks. A new brick is created when the price moves a specified price amount, and each block is positioned at a 45-degree angle (up or down) to the prior brick. An up brick is green, while a down brick is red.

Waiting for uptrend confirmationExceptional OBV uptrend can rocket RSLV cross the SMA10, towards CAD 2.35. Looking forward to your feedback.
About Renko Charts
A Renko chart is a type of chart, developed by the Japanese, that is built using price movement rather than both price and standardized time intervals like most charts are. It is thought to be named after the Japanese word for bricks, "renga," since the chart looks like a series of bricks. A new brick is created when the price moves a specified price amount, and each block is positioned at a 45-degree angle (up or down) to the prior brick. An up brick is green, while a down brick is red.

Galane Gold (GG) confirming reversalSlowly crossing up the SMA10 and OBV showing a light uptrend. If volume picks up, the uptrend can be confirmed. All starting to look good with potential at CAD 0.57 level. Don't ask me when, Renko doesn't give such answers :-). Looking forward to your feedback.
About Renko Charts
A Renko chart is a type of chart, developed by the Japanese, that is built using price movement rather than both price and standardized time intervals like most charts are. It is thought to be named after the Japanese word for bricks, "renga," since the chart looks like a series of bricks. A new brick is created when the price moves a specified price amount, and each block is positioned at a 45-degree angle (up or down) to the prior brick. An up brick is green, while a down brick is red.

Waiting for uptrend confirmationCurrently waiting uptrend confirmation. As soon as SMA10 is crossed and OBV keeps its vector upwards long postions can be taken. Expect confirmation in the 28-29 range. Looking forward to your feedback.
About Renko Charts
A Renko chart is a type of chart, developed by the Japanese, that is built using price movement rather than both price and standardized time intervals like most charts are. It is thought to be named after the Japanese word for bricks, "renga," since the chart looks like a series of bricks. A new brick is created when the price moves a specified price amount, and each block is positioned at a 45-degree angle (up or down) to the prior brick. An up brick is green, while a down brick is red.

Barrick Gold to bottom out at $21.95Barrick Gold has room to cross its resistance at $22.90 and continue its down trend to $21.95. OBV continues to go down as well, indicating no reversal at this stage. An uptrend is confirmed as soon as the Renko block crosses SMA10 and OBV indicates an uptrend. Looking forward to your comments.
About Renko Charts
A Renko chart is a type of chart, developed by the Japanese, that is built using price movement rather than both price and standardized time intervals like most charts are. It is thought to be named after the Japanese word for bricks, "renga," since the chart looks like a series of bricks. A new brick is created when the price moves a specified price amount, and each block is positioned at a 45-degree angle (up or down) to the prior brick. An up brick is green, while a down brick is red.

ZIl to retest ATH soon? ZIL just recently released their Ecosystem Growth Report 2020, which you can read in their website.
So amazing, unstoppable ZIL is approaching $0.10 resistance area.
But for 2020, I'm looking at 0.618 fib or around $0.15 as possibly closing price. Breakout to this could possibly retest ATH.
And more exciting things coming for 2021 that could create new ATH.
Support is seen at $0.05.
Trade Cautiously.

ZIL to retest $0.10?Wow ZIL hodling strong. Next target is $0.10 and possibly road to $0.25. Strong support at $0.046. Trade Cautiously.

XAG seems like forming a bullish flag?XAG hold at longterm support area and start to bounce from there.
And now seems like forming a bullish flag with a possible target at around $45.
Support is still seen at $21.
Trade Cautiously.
