(RGCO)Fast Bounce Setup | Price:$ 20.80→ Target:$21.84(+ 5 %)📊🚀 RGCO – Demand Zone Bounce Setup 🚀📊
RGCO continues to look solid from a fundamental and technical perspective 👀💡.
💰📈 Fundamentals
The company has strong fundamentals, and revenue forecasts are growing, providing a positive outlook for the coming periods 🌱📊.
📉🔄 RSI Signal (Daily)
On the daily chart, RSI is showing a reversal from the oversold zone ⤴️📉. RSI divergence is also present, which often signals a potential pullback and bounce ⚡📊.
📐🧲 Price Action Insight
Historically, this stock tends to pull back and react strongly at these levels 🕰️✅. From a price action perspective, the current area is a clear demand zone, where buyers have previously stepped in 🧱📍.
🎯📍 Expectation
Price is currently around 20.8 💵. If this support level holds, a ~5% upside move 📈🎯 is possible in the short term.
⚠️📌 Reminder
This is a support-based pullback setup, not a breakdown scenario.
Repeatedpattern

(AAV)Fast Bounce Setup | Price:$ 11.11→ Target:$11.66(+ 5 %)⚡📊 AAV – Pullback at Trendline with Strong Fundamentals 📊⚡
AAV continues to look interesting both fundamentally and technically 👀📈.
📰💰 Fundamental Outlook
Revenue forecasts remain very positive for the coming years 🚀, and the company maintains solid fundamentals, providing a strong long-term backdrop 🧱✅.
📉📊 Momentum Check (RSI)
On the daily timeframe, RSI recently pulled back from the oversold area, moving from around 34 to 39 over the past week 🔄📈. This signals improving momentum after a cooldown phase.
📐📍 Price Action Perspective
From a price action angle, the $11 zone is acting as a key pullback area 🧲. Price has once again touched the ascending trendline, showing respect for structure 📈✍️.
✅📉 Technical Confirmation
This pullback is supported by RSI confirmation on the daily chart, increasing the probability of a potential bounce from this zone ⚡🎯.
⚠️📌 Note
This looks like a technical pullback within structure, not a breakdown.

(AAPL)Fast Bounce Setup | Price:$ 260.92→ Target:$274(+ 5 %)AAPL is showing signs of a short-term pullback after a strong upside move 🚀. Price is currently testing the EMA 100, which is acting as a major resistance level on the daily timeframe 🧱⚠️.
🕯️🕯️🕯️ Candle Confirmation
Three or more candles have already confirmed rejection near this EMA zone ❌📉, strengthening the pullback scenario.
📊⚙️ Momentum Check (RSI)
On the daily chart, RSI previously dropped to around 26 😮💨 and has now bounced back to 31 🔄. This behavior usually confirms a healthy pullback, not a trend reversal ✅.
📰✨ Fundamentals in the Background
Positive news remains supportive:
📦⬆️ ~10% increase in iPhone 17 shipment demand
🤖🤝 Reported AI partnership with Google for iPhone 18
Despite the good news 🌞, price is still respecting technical resistance — suggesting much of this optimism may already be priced in 📌.
🎯📍 Short-Term Expectation
After this pullback completes ⏳, a short-term move toward the 274 area 🎯📈 is possible.
⚠️🔍 Reminder
This is a pullback within the trend, not a bearish trend change 🐂➡️🐂.

(QLYS)Fast Bounce Setup | Price:$133.36 → Target:$140 (+ 5 %) 🚀📊 QLYS — Short-Term Trade Setup (Daily) 📊🚀
💰 Entry: 133.36 (Current Price)
🎯 Target: 140.03 (+5%)
📈 Bias: Bullish continuation
💼 Fundamentals
✅ Strong & consistent EPS growth
📊 EPS trend: 3.72 → 6.13 → higher forward estimates
🔁 High-margin recurring SaaS revenue
🏦 Strong institutional-quality business
📌 Fundamentals continue to support higher prices
🧠 Behavioral Pattern
🔄 QLYS often pulls back → bases → pushes higher
📉 RSI reset after prior advance
🧲 Buyers historically step in near demand zones
📌 Current behavior matches previous continuation structures
📉➡️📈 Technical Structure
📍 Price sitting near key demand / value area
📊 RSI ~38–40 → historical bounce zone
📐 Rising structure still intact
📉 Selling pressure fading, not expanding
🚧 Key Resistance Zone — VERY IMPORTANT
🔴 $136 = Major resistance level
⚠️ Heavy supply previously appeared in this zone
🧱 Expect strong reaction / battle near this level
✨ Bullish scenario:
➡️ Clean break above $136 could open the path toward $140+
➡️ Demolishing this level likely triggers momentum continuation
⚡ Day Trading / Zone (Lower Timeframes)
🎯 $136 area = ideal scalp zone
⏱️ Best suited for 1–5 minute timeframe
📉📈 Potential sub-0.5% moves on rejection or breakout attempts
🧠 Excellent for quick reaction-based trading

(AFN) Long-Term Setup | Price: $ 23→ Target: Around $ 40📈🔭 Long-Term Forecast – AFN
⏳ This is a long-term outlook for AFN, which is currently trading near its lowest price levels since 2010 🕰️.
🔻 Price History & Pullback
📉 The stock declined from approximately $60 ➝ $20, representing around -66 % drop 🔻.
⚠️ This decline coincided with two consecutive years of revenue stagnation (2024–2025), showing .
💼 Fundamental Growth (Long-Term View)
🚀 Revenue expanded from $137M in 2007➝ $1.4B,in 2024 representing a +922% total increase over the long run 📊.
⛔ However, in 2024–2025 🕰️, revenue fell ~8–10% 🔻, leading to a bearish market reaction 📉.
🔮 Forward forecasts point to a return to +10–12% growth 📈, offsetting prior losses and supporting a bullish long-term outlook 🐂📊.
🧱 Major Long-Term Support Zone
📅 On the monthly timeframe, the $15 – $20 range represents a strong historical support zone 🛡️.
⏱️ This zone has held for 15+ years (0% breakdown rate), reinforcing its structural importance.
📊 Volume Profile Confirmation
🔵 The highest historical traded volume (100% peak volume node) is concentrated in this price range.
✅ This suggests maximum historical participation, confirming the area as a high-probability pullback zone.
📉➡️📈 Momentum & RSI Shift
📍 Monthly RSI reached ~30 (oversold) and has now started turning upward ⤴️.
⚡ This transition often precedes a positive momentum shift (%) after extended consolidation.
🔄 Cyclical Behavior & Seasonality
🔁 AFN historically forms major peaks every 1–4 years.
📆 Seasonality shows January–March frequently deliver 3 consecutive positive months, often producing double-digit % gains 📈📈📈.
🎯 Price Targets (2026)
🎯 Base target: $35 – $45 → +75% to +125% upside from $20
🚀 Extended target: $60 (previous high) → +200% upside, possible by late 2026, assuming forecasted growth resumes.
✅🧠 Conclusion
⭐ This setup represents a high-quality long-term opportunity, supported by:
✔️ –66.7% historical correction already priced in
✔️ 0% growth period fully absorbed by the market
✔️ Around 1000 % long-term revenue expansion
✔️ Oversold momentum + heavy volume accumulation
⏱️ At current levels, the risk-to-reward strongly favors long-term positioning (%) 💎📈

Fast Bounce Setup | Price: 536.00 → Target: 562.08 (+5%)Fundamentals 💼
MSCI maintains strong recurring revenue and solid margins. Earnings forecasts show steady growth, supporting a short-term bounce.
Repeated Behaviour 🔍
MSCI often rebounds 5–20% after clean corrections or oversold conditions.
Today’s setup mirrors previous quick-recovery cycles ⚡📈.
Volume & Price Action 📉➡️📈
Selling pressure is fading while accumulation volume is rising.
Price is sitting exactly on a historical rebound zone, where MSCI has shown multiple fast pops.
Entry: 536.00
Target: 562.08
Profit: +5% expected 💰🚀
Disclaimer:
Not financial advice. For educational purposes only.

Fast Bounce Setup | Price: 63.33 → Target: 66.49 (+5%)Fundamentals 📊
HALO continues to show strong revenue and profit forecasts, with steady growth expectations.
The fundamental outlook remains supportive for short-term upside.
Repeated Behavior 🔍
This stock has a repeated pattern of delivering at least a 5% bounce from similar oversold or congested zones.
The current structure matches previous cycles.
Price Action 📉➡️📈
Price action at this level is reacting to a resistance zone, which historically leads to a quick 5% reaction move before continuation or pullback.

Fast Bounce Setup | Price: 53.98 $ → Target: 56.67 $ (+5%)📈 Stock: MDLZ – Mondelez International 🍫🏭
🟢 Entry: 53.98 ⚡
🎯 Exit / Target: +5% → ~56.67 💰📈
🧱 Technical Support Strength
Price is holding a strong demand zone 🧱🟢
Repeated buyer reactions = solid support ✅✅
High-confidence base 🔒📉
📊 Weekly RSI Reset
RSI is deeply oversold, signaling potential rebound.
🔽⚡📈Momentum reset = fuel reload ⛽🔥
Often leads to next bullish push 🚀📈
📍 Pivot + Structure Confluence
Both Weekly & Dayly pivot support + prior structure 🎯
Confluence = higher bounce probability 📈💥
Bullish reaction favored 🟢❌
📉➡️📈 Short-Term Outlook
🚀 Expected move: ~5% upside
🔄 Mean reversion in progress
⚖️ Risk / reward favors longs 👍
📆 Mid / Long-Term Outlook
✔️ Higher-timeframe trend intact 📈
✔️ Healthy pullback, not a breakdown 🔄
✔️ Swing & position friendly 🟢📊
💼📊 Fundamental Strength
📈 Consistent revenue & earnings growth
💰 Strong cash flow & defensive business model 🛡️
🌍 Global brand power + pricing strength 🍫🏆
🔮 High expected future growth based on analyst forecasts 🚀
Fundamentals + technicals = high-conviction setup 💎
✅ Final Summary
🧱 Strong support
📊 RSI reset
🎯 Pivot confluence
💼 Solid fundamentals
🔮 Growth outlook strong
➡️ Entry: 54.03 ⚡
➡️ Target: 56.67$ 💰🚀
➡️ Bias: Bullish continuation 📈🔥

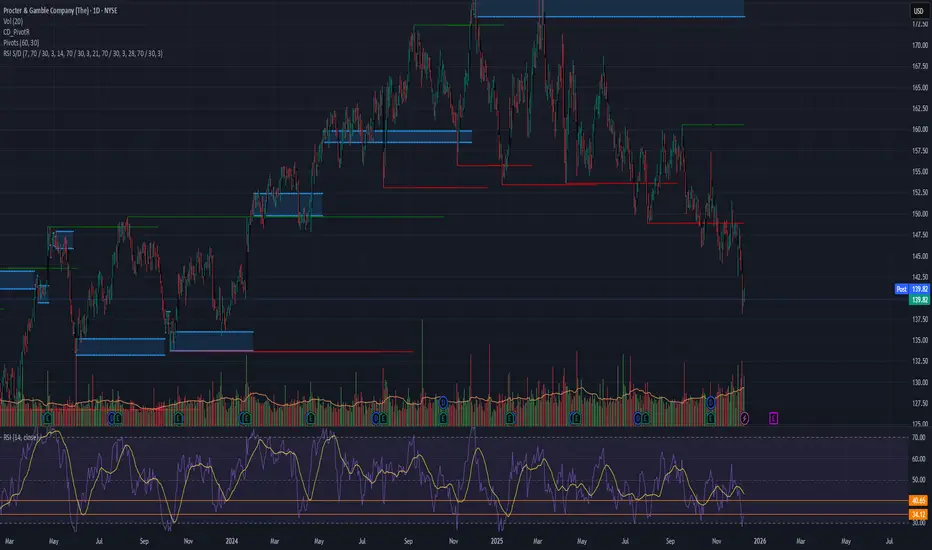
Fast Bounce Setup | Price: 139.78. → Target: 146.76 (+5%) 🌱 New Setup Forming on PG
⚡ Oversold Signal Triggered — Bounce Just Starting
📉 Strong fundamentals + behavioral dip pattern
📈 Watching for the first 3–5% move
#BehaviorBasedTrading 🔥 #LavinSignals 🚀
Fast Reversal Setup | Price: 62.68 → Target: 65.81 (+5%)
After the recent lawsuit-related news, LRN dropped sharply from $155 → $62 and is now deep in the oversold area 📉🔥
Volume Signal 📊
This week’s traded volume is higher than anything since its IPO, which often marks a reversal zone.
Repeated Patterns 🔍
Across the daily, weekly, and monthly intervals, the stock is showing its typical reversal pattern, matching previous bounce cycles.
Entry: 62.68
Target: 65.81
Profit: +5% 💰⚡
Fast Bounce Setup | Price: 3.61 → Target: 3.79 (+5%)Fundamentals 📊
STKL shows improving revenue and margin forecasts, indicating gradual recovery.
Even though long-term movement has been unstable, the short-term fundamental outlook supports a bounce.
Repeated Behaviour 🔍
Historically, STKL has shown a clear behavioural pattern:
after deep pullbacks or oversold conditions, it regularly produces 5%–1000% bounces before stabilizing.
Today’s setup matches those previous repeated cycles.
Volume & Price Action 🔥
Recent volume activity suggests seller exhaustion and early accumulation.
Price is sitting exactly in a zone where STKL has shown multiple fast rebounds in the past.
Entry: 3.61
Target: 3.79
Profit: +5% expected 💰⚡

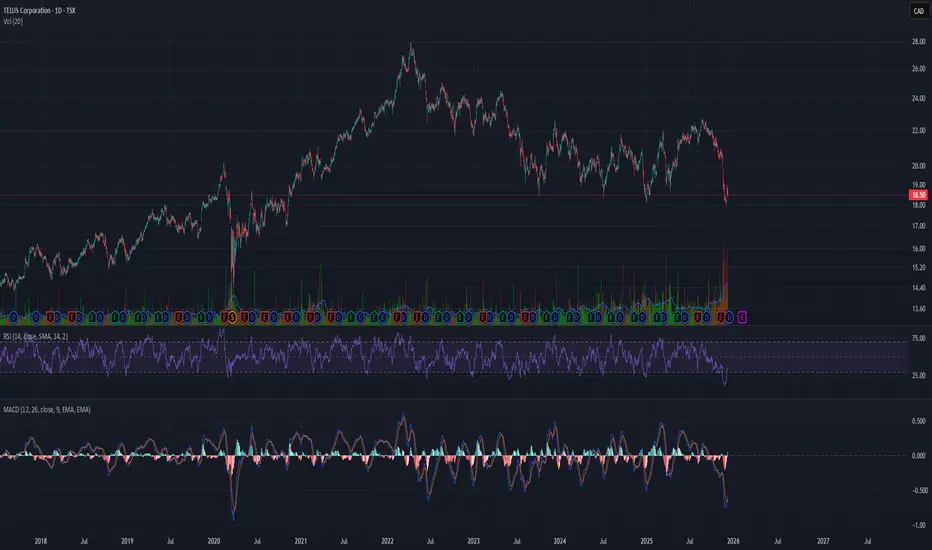
Fast Bounce Setup | Price: 18.53 → Target: 19.46 (+5%)
Fundamentals 📊💼
TELUS shows stable revenue forecasts and long-term growth in telecom and digital services.
Even during pullbacks, fundamentals remain supportive for short, quick moves.
Repeated Behavior 🔁📉➡️📈
Historically, T reacts with 5%–20% quick bounces after deep drops or oversold conditions.
Current pattern is similar to previous reversal cycles.
Volume & Price Action 🔥📊
Volume shows buyer interest, and price is sitting at a classic TELUS bounce zone.
Entry: 18.53 💵
Target: 19.46 🎯
Profit: +5% expected 💰⚡
Fast Bounce Setup | Price: 242.68 → Target: 254.81 (+5%)Fundamentals 📊💼
Strong revenue growth from rising demand in cloud security and zero-trust solutions.
Forecasts support short-term upside momentum.
Repeated Behavior 🔁📉➡️📈
ZS often makes 5%–30% quick bounces after oversold drops.
The current pattern strongly matches earlier reversal cycles.
Volume & Price Action 🔥📊
Volume shows buyer accumulation, and price is sitting at a familiar bounce zone where ZS reacts quickly.
Entry: 242.68 💵
Target: 254.81 🎯
Profit: +5% expected 💰⚡
Fast Bounce Setup | Price: 242 → Target: 254.10 (+5%)Fast Bounce Setup | Price: 242 → Target: 254.10 (+5%) 📈⚡
Fundamentals 📊
VEEV shows steady revenue and profit growth, supported by strong demand for its cloud solutions in the life sciences sector.
Repeated Behavior 🔍
Historically, VEEV produces 5%–25% quick bounces after oversold or sharp pullback zones.
Current price action matches those previous reversal patterns.
Volume & Price Action 🔥
Volume shows accumulation and the price is sitting on a familiar bounce level.
Entry: 242
Target: 254.10
Profit: +5% expected 💰⚡

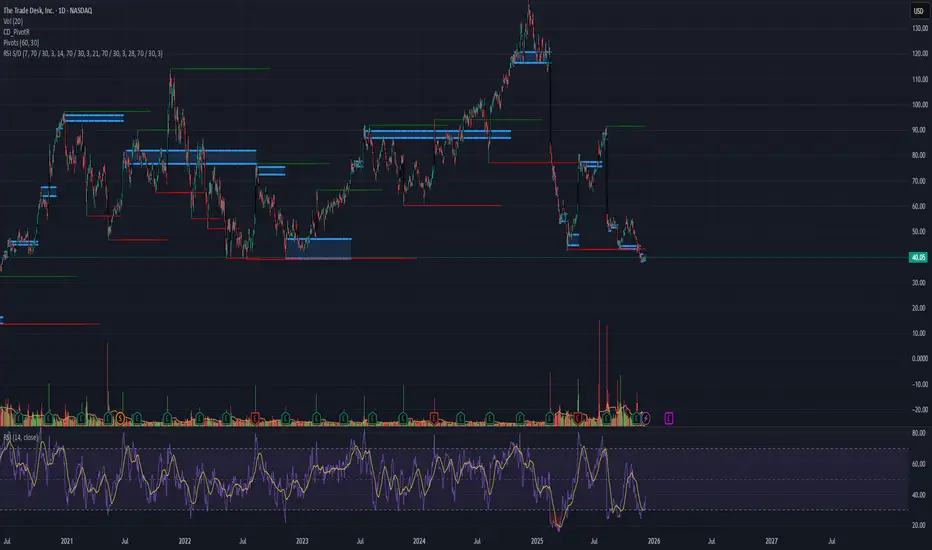
Fast Bounce Setup | Price: 40.05 → Target: 42.05 (+5%)Fast Bounce Setup | Price: 40.05 → Target: 42.05 (+5%) 📈⚡
Fundamentals 📊
TTD maintains strong long-term revenue growth, driven by rising digital ad spending and increasing adoption of programmatic advertising.
Profit forecasts also show healthy growth, strengthening the short-term upside potential.
Repeated Behavior 🔍
TTD has a well-defined behavioral pattern historically:
after sharp selloffs or oversold conditions, the stock often delivers 5%–100% quick bounces before consolidating.
Today’s setup fits the same repeated cycle seen in prior reversals.
Volume & Price Action 🔥
Recent volume indicates buyer accumulation after a wave of selling pressure.
Price is currently sitting at a familiar zone where TTD has shown fast short-term rebounds multiple times.
Entry: 40.05
Target: 42.05
Profit: +5% expected 💰⚡
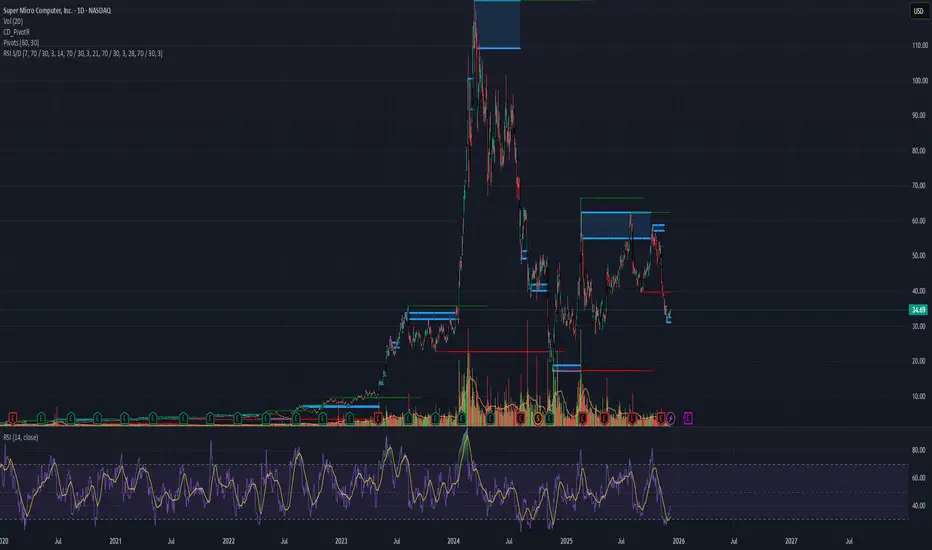
Fast Bounce Setup | Price: 34.69 → Target: 36.42 (+5%)Fundamentals 📊
SMCI continues to show strong revenue and profit forecasts, supported by growing demand in AI servers and high-performance computing hardware.
The long-term outlook is strong, which also supports short-term bounce setups.
Repeated Behavior 🔍
Historically, SMCI has shown a clear behavioral pattern: after sharp pullbacks or oversold phases, it typically produces 5%–50% bounces before stabilizing.
The current structure matches those previous behavior cycles.
Price Action 🔥
Recent volume spikes and the pullback zone align with previous SMCI reversal phases.
Price is reacting at a familiar technical level where the stock has shown fast rebounds.
Entry: 34.69
Target: 36.42
Profit: +5% 💰⚡
This setup is based entirely on the repeated behavioral pattern of SMCI itself.
Each stock has its own cycle — we do not use one fixed formula.
All signals come from pure behavior analysis.
#BehaviorBasedTrading 🔍📈
GBPUSDGBPUSD was trading in descending parallel channel. The price was reacting well the support and resistance of descending channel.
Currently the price has given the breakout of channel and now retesting the broken level where it is also forming a local support zone and seems like the price may go for another leg higher.
If the breakout sustain to upside the optimum target could be 1.2850.
What you guys think of this idea?

ATOMUSDTATOMUSDT is looking strong for bullish setup. ATOMUSDT is repeating the same pattern over and over again. Currently the price is getting support from 9.5 region. if this level holds , it will be nice buying option.
