Gold (GC1!) Forecast: The Squeeze & Release Path via DSRTL MatriCategory: Trend Analysis / Chart Patterns
Symbol: GC1! (Gold Futures)
In this analysis, we use the DSRTL-ML (Dynamic Support & Resistance) engine to map the current structural context for Gold. The indicator is tagging the state as “TESTING RES – Bias: Neutral”, highlighting a consolidation phase right underneath a major resistance band. Structurally, this is a spot where static friction meets dynamic momentum.
1. The Current Structure: Compression Phase
The Matrix currently sits at S2 | D3 (Testing Resistance).
- The Ceiling (Static R): Price is capped by a high-volume resistance node (orange zone: ~4.24K–4.31K), acting as a lid on price action.
- The Floor (Dynamic S): At the same time, the rising DSRTL trend line (dynamic support) is pushing the lows higher inside the channel.
Taken together, this can be viewed as an early ascending-triangle–style squeeze: price is consolidating between a flat static lid and a rising dynamic floor, while DSRTL keeps the official bias neutral and labels the state as a resistance test.
2. Path of Least Resistance
The dashboard shows a positive Net Delta of +8.36K, suggesting that buyers have been active right below the resistance band.
- Projected Path: In the absence of a clear break, price can continue to oscillate within this narrowing pocket between static resistance and the rising channel.
- Breakout Vector: The combination of constructive volume flow and an upward-sloping dynamic channel creates a supportive backdrop if an upside break occurs, even though DSRTL itself still prints a Neutral bias here.
3. Scenario & Structural Objectives
- Trigger: A confirmed close above the top of the Static R band (~4.31K) would move the Matrix out of its S2 “testing” state toward an S1-type breakout environment.
- Next Structural Area: Above that level, the next area of interest becomes the upper rail of the DSRTL dynamic channel (pink line), where the system could start migrating toward its higher “extension” states.
Invalidation:
If price breaks and closes below the rising pink dynamic support, the bullish squeeze thesis is invalidated. In that case, the Matrix would likely rotate toward Neutral/Bearish or Bearish-Pullback configurations, depending on how price interacts with the underlying static support band.
Disclaimer: This forecast is based on structural scenarios derived from the DSRTL-ML engine and is provided strictly for educational and illustrative purposes.
Resistancebreak

Volume-Based Market AnalysisUsing Indicators:
Smart Money Support/Resistance and ATAI Volume Analysis with Price Action V1.03
Analytical Configuration
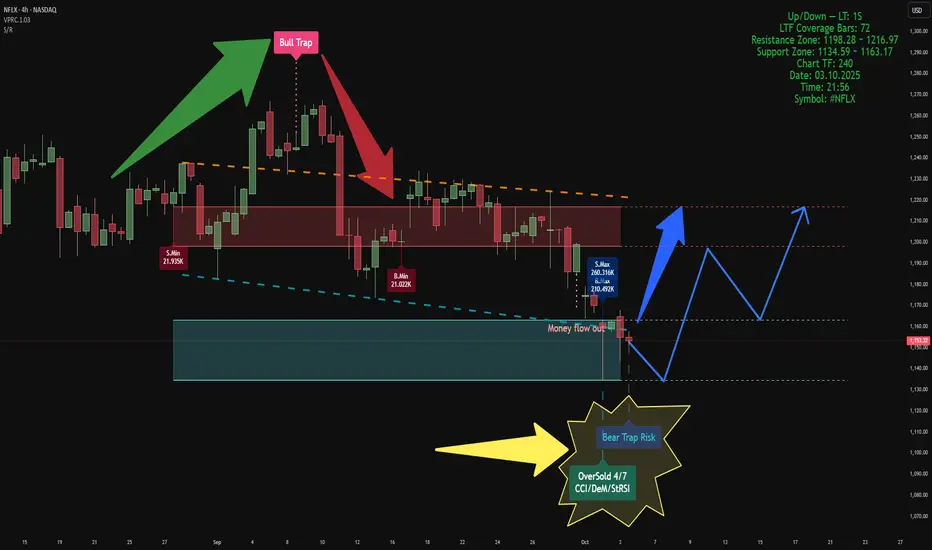
This analysis combines two advanced indicators. The calculation period for both has been set to 52 bars, based on a lower timeframe of 1 second (1S), which provides 72 valid LTF candles. This configuration ensures that volume-based calculations remain within the valid data window for maximum accuracy.
Current Market Context
On the latest candle, a Bear Trap Risk signal appeared right after detecting an OverSold condition. This combination usually suggests weakening selling pressure near the end of a bearish leg and indicates the potential for buyer reaction. At that candle, both buy and sell volumes reached their highest values within the 52-bar window, but sellers maintained a slight advantage — approximately 260K sell volume versus 210K buy volume. This dominance by sellers in the OverSold zone reinforces the concept of volume exhaustion
Key Zones
• Support Zone: 1134 – 1163 USD
• Resistance Zone: 1198 – 1217 USD
Price is currently oscillating between these two zones. Based on the data, a short-term move toward the lower edge of the support zone is possible. If strong support holds, a rebound toward the upper boundary of resistance can be expected to retest or potentially break above it.
Structural Observation
In previous data, ATAI identified a Bull Trap at the resistance zone, which initiated the current bearish leg. Now, the emergence of a Bear Trap Risk near the support boundary is an intriguing reversal signal. If this trap functions similarly to the previous Bull Trap but in the opposite direction, we could expect a movement from the support base toward the resistance ceiling in the upcoming phase.
Summary
According to both indicators’ volume-based calculations, this is the most probable short-term scenario. However, this analysis is purely technical and volume-driven, and does not constitute any form of financial or investment advice.
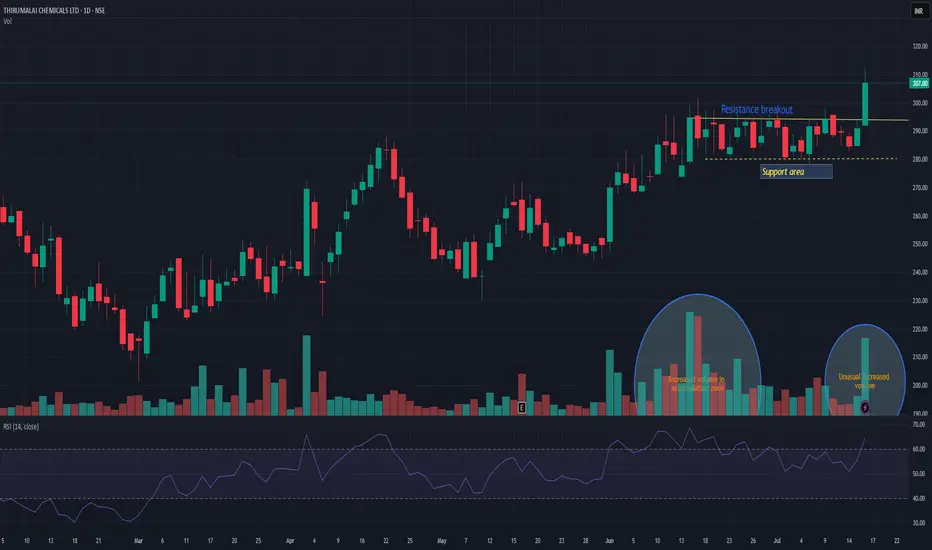
TIRUMALCHMTIRUMALCHM has given resistance breakout with decent volume. Another good thing is unusual volume increased in accumulation zone. Support can be seen near 280 levels. There is high probability that this time it may push the stock in to trend change and may take momentum to the next level. Keep it on radar.
Nvidia - 100% new all time highs!Nvidia - NASDAQ:NVDA - is just too bullish now:
(click chart above to see the in depth analysis👆🏻)
Honestly it was not unexpected that Nvidia is now the most valuable company in the world. The chart is just so strong and perfectly following structure; it seems to be just a matter of days until Nvidia will create a new all time high. If this happens, a breakout rally will follow.
Levels to watch: $150
Keep your long term vision!
Philip (BasicTrading)

PYPL: Strong Resistance Zone in Play – Watch 73.34 for EntryNASDAQ:PYPL is showing a potential triple top formation near the 73 level. If price breaks above the 73.34 resistance , there's room to move toward 74.15 – a medium-term swing high.
💡 Trade idea: Enter 1 tick above 73.34, set your target and SL based on the 5-minute chart.

OptionsMastery: Sitting at resistance on BAC!🔉Sound on!🔉
📣Make sure to watch fullscreen!📣
Thank you as always for watching my videos. I hope that you learned something very educational! Please feel free to like, share, and comment on this post. Remember only risk what you are willing to lose. Trading is very risky but it can change your life!

OptionsMastery: Looking for an immediate buy on TSLA! 📣Make sure to watch fullscreen!📣
Thank you as always for watching my videos. I hope that you learned something very educational! Please feel free to like, share, and comment on this post. Remember only risk what you are willing to lose. Trading is very risky but it can change your life!

Amazon - The +150% All Time High Breakout!Amazon ( NASDAQ:AMZN ) is hugging the previous all time high:
Click chart above to see the detailed analysis👆🏻
Amazon has been moving sideways for almost four years, consolidating between support and the previous all time high. After retesting the resistance over and over again, it is just a matter of time until Amazon will break the previous all time high and start its next major bullish cycle.
Levels to watch: $190, $500
Keep your long term vision,
Philip (BasicTrading)

AAVE Breakout Incoming? Altcoin Sentiment Turns Bullish!AAVE/USDT is currently trading around the resistance zone, and we anticipate a breakout as the price has been holding these levels for several hours.
Additionally, the decline in BTC.D and USDT.D indicates a flow of money into altcoins, further supporting the potential for a bullish move in AAVE.
Keep an eye on the breakout for confirmation!

Applying Fan's Principle on XCHANGING!Fan Pattern in NSE:XCHANGING !
3rd Fan Line Breakout in XCHANGING!
XCHANGING SOLUTION Analysis on a Monthly Time Frame!
Analysis:
Hello all, as you can see I have applied the Fan Principle on XCHANGING SOLUTION, It is a type of Multi time frame analysis, Where we can draw multiple trendlines from an All-Time High price point. As per the Fan's Principle, there is a trend reversal When the price breaks the 3rd Fan Line.
Disclaimer = Consider my analysis for Educational Purposes only.
Before entering into any trade -
1) Educate Yourself
2) Do your research and analysis
3) Define your Risk to Reward ratio
4) Don't trade with full capital

Amazon - Breakdown of the breakout!NASDAQ:AMZN is definitely ready for a major bullish (triangle) breakout.
Here we have a textbook example of a bullish stock. Amazon's stock chart is simply moving from bottom left to top right. Of course there are minor corrections here and there, but the trend is clearly higher. For the past four months, Amazon has been hugging a horizontal resistance level and is preparing a bullish breakout. This will certainly become a decent break and retest setup.
Levels to watch: $185
Keep your long term vision,
Philip - BasicTrading

AUD-USDThe audusd pair breaks the resistance level at 0.66500 and closes the candle above this level. Now the market is testing again this level to give a big move to the upside level. There is also another strong resistance level at 0.68500. the market breaks this resistance and then turns into support, and if the market holds this support level of 0.66500 then we see an upside move.

ESTC Pushing Resistance after PEGESTC making a nice run at the downward resistance on the daily. Printed a beautiful PEG after earnings in early December. Nice looking hammer candle during a weak tape suggests this should be a leader when markets bounce.

Uranium Miner ETF 2 Year Resistance Breakout UPDATEHi Guys! This is a Technical Analysis Update on Sprott Uranium Miners ETF (URNM) on the 1 Week Timeframe.
URNM was able to BREAK Above the 2 year Resistance line and close Friday with a Strong body candle close.
It was accompanied with a VOLUME SPIKE, which shows follow through and supports price action.
This is the 1st step in attempting a Trend Change.
2nd MOST important step = Confirming the breakout = Testing Support and Succeeding
So this upcoming Week to couple weeks is crucial for us to stay above Resistance line.
Not only are we ABOVE the Resistance line but we also CLOSED ABOVE the 100 SMA. Again if we confirm SUPPORT, we will now have the backing of 2 MAJOR Resistance turned SUPPORT zones.
Prior to this current move we also maintained SUPPORT on the 50 SMA for 3 weeks before moving up.
In the coming weeks, it is likely we also have a GOLDEN CROSS occur.
This is when the 50 SMA CROSSES ABOVE the 100 SMA. This leads to a confirmation of BULL TREND. So i'd we watching for this.
Bullish Momentum is also currently PRESENT, expressed through the STOCH RSI and MACD.
One thing to OBSERVE aggressively is the MACD.
Particularly on the size of the histogram bars and the slope of the blue/orange line. We are ABOVE the 0 level, universally this leads to BULLISH MOMENTUM and UPTRENDS.
________________________________________________________________________________
Thank you for taking the time to read my analysis. Hope it helped keep you informed. Please do support my ideas by boosting, following me and commenting. Thanks again.
Stay tuned for more updates on URNM in the near future.
If you have any questions, do reach out. Thank you again.
DISCLAIMER: This is not financial advice, i am not a financial advisor. The thoughts expressed in the posts are my opinion and for educational purposes. Do not use my ideas for the basis of your trading strategy, make sure to work out your own strategy and when trading always spend majority of your time on risk management strategy.

TV18 BROADCAST eyes on itCreated a long path of consolidation and tried two times but failed, though with healthy short term gain. Weakly and monthly time frame speaks clear story. Fundamentally Ambani's company it is. Isn't it enough :)
Well this should be for patient investor only who can hold it for at least one and half year.
Disclaimer: My ideas are not for recommendation purpose. Just sharing ideas with community.

BLISSGVS: Breakout of ConsolidationNSE:BLISSGVS has broken the resistance line of the consolidation phase. The target and the stop loss of the same are given. We can expect the retest till the resistance line.

GBPAUD Sell & Buy Setup On H4GBPAUD is currently trading at 1.8863. If it is rejected from the resistance area, which is at 1.8902, it will then move down to the support level at 1.8744. However, if it successfully breaks above the resistance area, you can consider buying on its retest, aiming for the next resistance at 1.9165 for GBPAUD.
Disclaimer: The information provided is for general informational purposes only and should not be considered as professional advice. Use at your own risk.


EURUSD Breaks Resistance 29.03.2023No scheduled important figures today and the EURUSD is moving rapidly upwards after a short reversal
breaking resistance at 1.8495.
Next resistance is estimated to be 1.8650.
__________________________
Information Regarding Important News and Figures can be found here in our Economic Calendar: mau.bdswiss.com/economic-calenda...
Risk Warning: Trading in CFDs is highly speculative and carries a high level of risk. It is possible to lose all of your invested capital. These products may not be suitable for everyone, and you should ensure that you fully understand the risks taking into consideration your investment objectives, level of experience, personal circumstances as well as personal resources. Speculate only with funds that you can afford to lose. Seek independent advice if necessary. Please refer to our Risk Disclosure.
BDSwiss is a trading name of BDS Markets and BDS Ltd.
BDS Markets is a company incorporated under the laws of the Republic of Mauritius and is authorized and regulated by the Financial Services Commission of Mauritius ( FSC ) under license number C116016172, address: 6th Floor, Tower 1, Nexteracom Building 72201 Ebene.
BDS Ltd is authorized and regulated by the Financial Services Authority Seychelles (FSA) under license number SD047, address: Tenancy 10, Marina House, Eden Island, Mahe. Payment transactions are managed by BDS Markets (Registration number: 143350).

RAMCOCEM Daily Channel Continuation
Ramco Cements at resistance zone can give a breakout & go upto channel topline. A good risk to reward ratio swing trade idea.

KCSUSDT wants the resistance!KCSUSDT had a false breakout from the triangle exactly on the Weekly support in 6.3$ area. The market grabbed new liquidity for this movement and started with the uptrend printed HH and HL.
The market had a clear breakout and retest on the dynamic resistance, a very good opportunity to apply MTB and create the first profit.
The price had another breakout from the static resistance in 6.7$ area with a nice volume
what's next?
the price is testing the resistance at 6.9$ where the bearish movement started, so we need to see a clear breakout from here in order to retest the 7$ area, the key level.

GBPUSD CHANNEL BREAK H4Hello ! GBPUSD Broke The Channel Successfully
Now If GPBUSD Retest The Channel At 1.2050 Area Then You Can Take A Long Position For 1.2150 Area .
I Hope It Will Work And Give Us Good Pips .
Thank You

Breakout in Fertilizer and chemical After a soo long tym a good breakout has-been come in fertilizer and chemical which look like bullish.
Buy it above 155
Target 165.30 174.5 180 200
Sl 141
