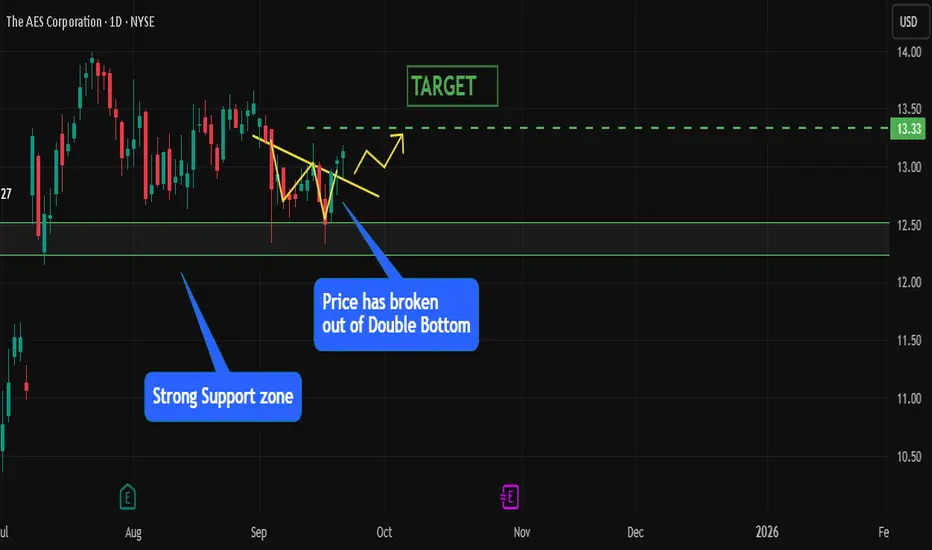
AES Springs Out of Double BottomAES has been showing a constructive setup on the charts, and the latest move looks like a clear signal from the bulls. Recently, the stock broke out of a Double Bottom pattern , which is widely considered a bullish reversal structure. This pattern often marks the end of a downtrend and the start of a potential uptrend, especially when supported by volume and clear support levels.
Adding to the strength of this breakout, AES took support from a strong support zone in the range of 12.24–12.5 . This area has acted as a solid base where buyers consistently stepped in, preventing further downside. The fact that the stock respected this zone before bouncing gives extra conviction that the downside is well protected in the near term.
Now, with the breakout confirmed and buyers back in control, the next logical upside level comes in at 13.33 . This acts as the immediate price target based on the pattern’s projection and prior resistance levels.
If AES continues to hold above the breakout area, momentum could carry it higher in the short term, attracting more participants who missed the initial move. On the flip side, a sustained break back below the 12.24 zone would weaken this bullish setup.
Overall, the technical confluence of a Double Bottom breakout , strong support zone confirmation , and a clear price target of 13.33 makes AES an attractive setup to watch in the coming sessions.
Resistence
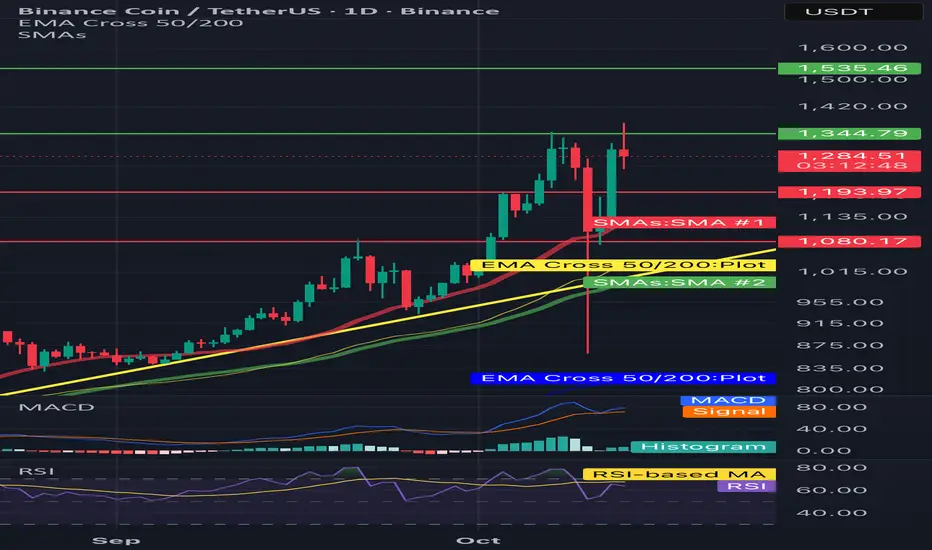
BNB/USDT 1D Chart Review🧭 Key technical levels
Resistances:
• 1,344–1,350 USDT – local resistance (last candle highs).
• 1,535 USDT – strong resistance from previous highs.
Support:
• 1,193–1,200 USDT – first strong support (the reaction of the candles is visible).
• 1,080 USDT – another important level, coincident with the yellow uptrend line and EMA50.
⸻
📊 Technical indicators
1.EMA/SMA:
• The red SMA and yellow EMA show that the medium-term trend is up (EMA 50 > EMA 200).
• The price is currently testing the zone between the SMA and EMA - if it stays above ~1,190-1,200, a rebound may occur.
2. MACD (bottom):
• The signal line (orange) crosses the MACD (blue) from above → bearish signal.
• The histogram is starting to flatten - possible end of correction if it lasts for a few days.
3.RSI:
• RSI around 50-55, neutral → no overbought or oversold yet.
• If the RSI rebounds from 50 upwards, it may mean the price rebounds from support.
⸻
📈 Scenarios
✅ Upward scenario (more likely if it maintains support)
• Maintaining above 1,190 USDT → reflection towards 1,344 and then 1,535.
• Confirmation: daily candle closed above 1,344 + increasing volume.
⚠️ Downside scenario
• Loss of the level of 1,190 USDT → correction to 1,080 USDT (EMA 50 test).
• If this support breaks, the next target is around USDT 950-1,000.
Will BTC go further down?🧩 1. General Context
Bitcoin is currently declining after rebounding from around $124,000.
The chart shows a clear descending channel (yellow lines), where the price bounced off the upper and lower boundaries.
Currently, the daily candle is testing the lower boundary of the channel and the support zone (red rectangle) between ~$110,000 and $107,000.
📉 2. Key Technical Levels
Resistance 1) 115,699 EMA50/SMA200 average zone — possible retest from below
Resistance (2) 119,875 resistance with a potential bounce
Resistance (3) 124,585 strong resistance with a potential bounce
Support (1) 110,000 Daily support currently being tested
Support (2) 107,111 200-day SMA — a strong defensive line in the uptrend
Support (3) 105,000 Lower boundary of the September demand zone
📊 3. Moving Averages
The 50-day EMA (~115,700) recently crossed the 200-day SMA (~115,600) → a possible death cross if it holds below.
Price below the EMA50 and SMA100, approaching the SMA200 → momentum is definitely bearish in the short term.
⚙️ 4. MACD
The MACD indicator shows a fresh crossover of the downward signal.
The histogram deepens into the negative zone → confirmation of downward pressure.
Momentum is negative, with no signs of upward divergence.
💪 5. RSI
RSI = 37.9, close to the oversold zone, but not yet extreme.
A technical rebound could potentially occur when touching 30–35.
No divergence is visible yet (RSI confirms price movement).
🕯️ 6. Candlestick Structure
The last three daily candles are:
Two strong bearish candles with large bodies (without significant shadows).
Today's candle with a lower wick is testing the 110,000 zone → a possible defense attempt by buyers.
📈 7. Short-Term Scenarios
🔻 Bearish:
A break of 110,000 and a daily close below 107,000 → a possible decline to 105,000 and even 101,000–102,000 USD.
The MACD and moving averages confirm this scenario.
🔼 Bullish:
A defense of 110,000 and a return above 112,000–113,000 → a possible retest of 115,000–116,000 (EMA50/200) is possible.
The RSI indicates that the market has cooled down → a short-term technical rebound is possible.

Gbp/Jpy - Bullish Reversal From Demand ZoneDemand Zone (Blue Rectangle):
The price tapped into this zone and showed a rejection wick.
Suggests strong buying interest, as seen previously on October 7-8.
Acts as a support base for a potential reversal or bullish rally.
Resistance / Target Zone (Green Rectangle):
Previous support turned resistance, aligned with a weak high.
Logical target for a bullish move.
Near 205.000 psychological level — a good place for taking profit.
Entry Setup:
Entry Point: Marked at the edge of the demand zone.
Confirmation: Price rejection with a long wick and small-bodied candle indicates a possible bullish reversal.
Confluence Factors:
Break of Structure (BOS) and Change of Character (ChoCH) earlier in the trend.
The price is now creating a higher low, suggesting a potential trend shift.
Price is oversold (outer Bollinger band tapped), signaling a mean reversion.
Indicators & Tools:
Bollinger Bands:
Price touched the lower band (supportive of reversal).
Bands are starting to widen again, suggesting incoming volatility.
Parabolic SAR (dots):
Currently above price, indicating a bearish trend — but could flip if price breaks upward.
Moving Average (Green Line):
Price is below the MA — will need to break above for stronger bullish confirmation.
Trade Idea:
Bias: Bullish Reversal from Demand Zone
Entry: Around 202.600 (current level)
Target: 205.000 zone (resistance / weak high)
Stop Loss: Below demand zone — e.g., 201.900 (below the wick)
Risk Management & Notes:
Wait for confirmation (e.g., bullish engulfing or MA crossover).
Monitor for false breakouts — a break below demand zone invalidates setup.
Ideal R:R (Risk to Reward) appears to be 2:1 or better.
Summary:
This chart suggests a potential long trade setup based on price rejecting a strong demand zone, with a target set near a resistance/weak high area. If momentum builds and breaks above short-term resistance, a bullish move toward the 205.000 area is likely.

The LINK/USDT will probably go lower📉 Trend and Structure
The price is currently trading within a descending channel (yellow lines), which has been in place since late August.
The price attempted to break out of the channel at the top around $23.40, but buyers lacked strength – it was rejected at resistance and fell back below the downtrend line.
Currently, the price is just below the upper edge of the channel and below the 50/200 EMA, confirming that the medium-term trend remains downward.
🔹 Key Technical Levels
Support:
$21.40 – local support, which is currently being tested.
$20.80 – strong support from previous price reactions.
$19.68 – lower boundary of the channel, a very important level for bulls.
Resistance:
$22.20–$22.70 – zone of the 50/200 EMA and previous rejections.
USD 23.40 – the last local high and the point of the false breakout.
USD 24.90 and USD 25.50 – key breakout levels from the channel, paving the way to USD 27–28.
⚙️ Technical Indicators
MACD:
The MACD line has crossed the upside signal → sell signal.
The histogram has turned slightly negative, indicating a loss of upward momentum.
RSI (14):
Currently around 51, with a slight downward slope.
Neutral, but with a strong upside – a drop to around 40 is possible before the bulls attempt a rebound.
🧭 Scenarios
🔻 Bearish Scenario (more likely)
If the price remains below $22 and the channel is not broken, a further decline to $20.80 is possible, or even a test of the lower band of the channel at $19.70.
Confirmation will be a close of the 4-hour candle below $21.40.
🔺 Bullish Scenario (less likely at this time)
If the bulls reclaim $22.70–$23.00 and close the 4-hour candle above it, a breakout from the channel could occur.
The targets will then be $23.40, $24.90, and $25.50, respectively.
Increased volume and confirmation on the MACD (bullish cross) are required.

BTC Short-Term 1H🔹 General Context
On the chart, we see that Bitcoin:
Has broken the local downtrend line (yellow line), suggesting an attempt to change the short-term trend.
It is currently consolidating just above the 50/200 EMA, which is a positive sign for bulls.
We also see a MACD crossover in the positive zone and an RSI rising, but not yet overloaded (around 52–60).
🔸 Key Technical Levels
Support:
122.460 USDT – strong local support, aligned with previous lows and the 200 EMA.
121.900 USDT – next support, also marked by the blue 200 EMA.
120.600 USDT – deeper support, recent significant low.
Resistance:
123,700 – 123,900 USDT – resistance zone where the price is currently stalling (there was a reaction after the trendline breakout).
124,700 USDT – next resistance level (local high).
125,700 USDT – strong resistance resulting from previous swing highs.
🔸 Technical Indicators
📈 EMA 50/200 (golden cross on 1 hour):
The 50 EMA is breaking below the 200 EMA – a classic bullish signal (Golden Cross).
Confirmation requires the price to stay above 122,800 USDT for several H1 candles.
📊 MACD:
The histogram has turned positive, the MACD line is breaking above the signal line – momentum is increasing.
There is no strong negative divergence yet, so the signal is clear.
💪 RSI:
Value ~52–60 – moderately bullish.
It is not overbought yet, so there is potential for further upward movement.
🔹 Scenarios
✅ Bullish Scenario:
Sustainability above 122,800 USDT.
A breakout and retest of the 123,700–123,900 USDT resistance could open the way to 124,700 USDT and then 125,700 USDT.
The MACD and RSI support this scenario.
❌ Bearish Scenario:
A reversal from the current level and a decline below 122,400 USDT.
A retest of 121,900 USDT and a possible deepening correction to 120,600 USDT is possible.

Xauusd - Price At Decision Point Price is currently hovering around a Decision Point at a key Resistance Zone, following a series of BOS (Break of Structure) and CHoCH (Change of Character) formations, indicating significant market shifts.
Key Levels & Zones:
Resistance Zone: Price is retesting this zone, which has acted as a ceiling previously.
Demand Zone: Below current price — if the market rejects from resistance, this becomes a potential area for bullish reactions.
Weak High: Marked just above current price action; may be targeted for liquidity sweep before a reversal.
Scenario 1 (Bullish):
Price breaks and holds above the Decision Point, invalidating the Resistance.
Potential upside target towards 4,000 - 4,020 range.
Confirmation would come from a strong bullish candle closing above the Resistance with momentum.
Scenario 2 (Bearish):
Rejection from current level (Resistance/Decision Point) suggests price may target the Demand Zone.
Break below demand could lead price lower, targeting 3,940 area.
Look for signs of exhaustion or bearish engulfing candles near resistance.
Market Bias: Neutral-Bullish
Awaiting clear breakout or rejection at the Decision Point to determine the short-term trend.

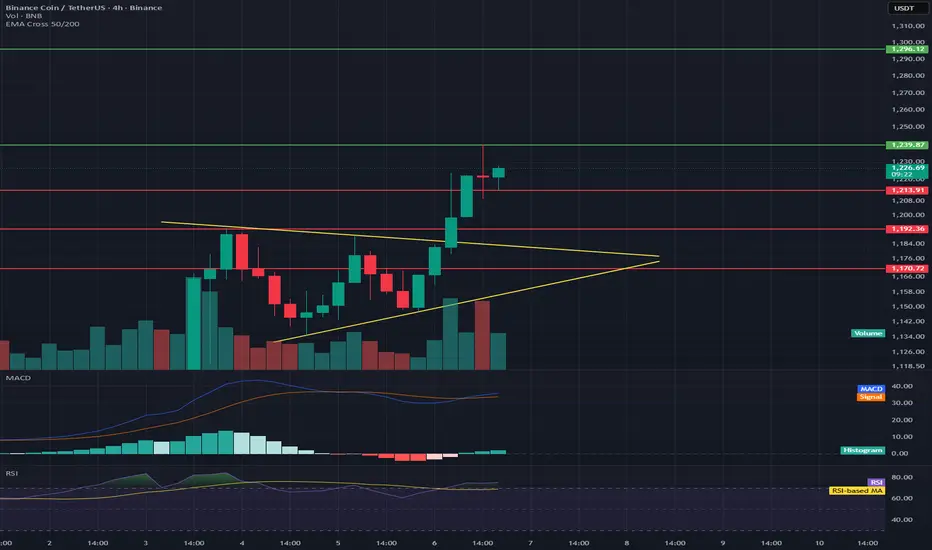
BNB/USDT 4H Chart Review📊 Market Structure
The chart shows a symmetrical triangle (yellow lines) from which a breakout occurred upwards—a classic signal of a continuing uptrend.
The price has broken above resistance at ~$1,210, which now acts as local support.
Current price: ~$1,226, following a dynamic breakout from the triangle.
📈 Key Levels
Support:
$1,210 — Retest after the breakout (important defensive level for bulls)
$1,193 — Previous local support in the triangle
$1,170 — Stronger support and lower boundary of the previous consolidation
Resistance:
$1,239 — Local resistance that has already been tested
$1,260–$1,265 — Next target upon breakout (equal movement or measuring the height of the triangle)
$1,300 — Psychological and technical resistance level
📊 Volume
The breakout was confirmed by a significant increase in volume, lending it credibility.
No sharp drop in volume after the breakout — the market remains in demand.
⚙️ MACD
The MACD is above the signal line and rising, confirming a bullish impulse.
The histogram is positive, but not excessively broad → momentum is healthy, but not overheated.
💪 RSI
RSI: ~75, which is slightly in the overbought zone.
It's worth watching for a short-term correction or retest of the $1,210 level before the uptrend becomes more established.
ETHUSDT 1D chart review📊 1. Main trend
• The chart shows a long -term movement in the inheritance trend channel in which the price is currently fighting for the mountain, but here you can see that the inferior canal limit is a strong resistance for the price.
⸻
🧠 2. Medium walking
• We see the cut SMA 50 and SMA 200 (so -called Golden Cross) - this is an upward signal in day interval.
• EMA 50 (green) is approaching the intersection of EMA 200 (red) - if the growth cross is confirmed, it may mean further growth time.
⸻
💹 3. Horizers of support and resistance
Support:
• 4,034 USDT - strong level, defended after the last inheritance.
• 4,252 USDT - short -term support (after breaking above trendline).
Resistance:
• 4 720 USDT - local resistance, previously rejected several times.
• 4,966 USDT - next strong resistance (local peak).
If ETH pierces 4 720 with a volume, the road opens towards 4,950-5,000 USDT.
⸻
⚙️ 4. Indicators
Macd:
• The histogram grows green → growth momentum.
• The MacD line cut the signal line from the bottom → buy signal.
RSI:
• RSI around 60, which indicates the advantage of bulls, but without buying out.
• If the RSI pierces 70, a short -term pullback may occur.

KIOCL on the verge of 8 years BreakOut📊 KIOCL Ltd – 8-Year Breakout Summary
🔑 Price Action Overview
The stock is trading at ₹528.80 (+19.99%), hitting an upper circuit with strong momentum.
Price is on the verge of a multi-year breakout from the consolidation zone that lasted nearly 8 years (2017–2025).
Historically, every breakout in KIOCL has led to sharp parabolic moves (2017 rally, 2020 rally, 2024 rally).
📈 Key Resistance Levels
1. ₹540 – ₹560 zone → Immediate breakout resistance (current price testing this zone).
2. ₹620 – ₹650 → Next major resistance; earlier rejection zones in 2017 and 2024.
3. ₹750 – ₹800 → Medium-term resistance zone.
4. ₹900 – ₹1000 → Psychological & historical supply zone.
📉 Key Support Levels
1. ₹500 – ₹510 → Immediate support (previous resistance now acting as support).
2. ₹450 – ₹460 → Strong support, base of recent rally.
3. ₹400 – ₹410 → Long-term support, multiple touch points (2023–24).
4. ₹340 – ₹350 → Strong multi-year support zone; breakdown here invalidates bullish structure.
🔍 Volume & Strength
Volume has spiked sharply (11.5M vs avg 9.9M), confirming institutional buying interest.
Weekly chart breakout with highest volume in years indicates accumulation phase turning into expansion phase.
📊 Technical Indicators
Momentum: RSI likely entering overbought zone but still bullish (strengthening breakout).
Trend: Higher highs & higher lows visible since mid-2023.
Pattern: Cup & Handle / Long-term Rectangle breakout.
🚀 Upside Potential
Measured move targets (based on breakout projections):
First Target: ₹620 – ₹650 (20–25% upside)
Second Target: ₹750 – ₹800 (45–50% upside)
Final Target: ₹900 – ₹1000 (80–85% upside)
⚠️ Risks
Profit booking after sharp rallies.
If it fails to sustain above ₹500 support, trend may weaken.
PSU stocks can be volatile due to government policies.
✅ Summary in One Line:
KIOCL is on the verge of an 8-year breakout with strong volumes. Sustaining above ₹500–₹510 opens the gates for ₹620 → ₹750 → ₹900+ in the medium to long term, while downside is protected by ₹450 & ₹400 supports.

BTCUSD 1W chart review• Currently BTC is at ~ USD 123,000 (+1.97%).
• Strong support visible in the area of 113 400 USD and USD 106,800.
• The next resistance is USD 124,500, and the next important is USD 133,500.
2. Trend:
• You can see the growing trend line (orange), which supports increases.
• The weekly candle is green and quite strong - suggests that the demand persists.
3. Medium walking (SMA / EMA):
• SMA 50/200 shows the Golden Cross (EMA CROSS 50/200), which is a long -term bull signal.
• SMA (red) is below the price → pro-rectification signal.
4. RSI (Relative Strength Index):
• Currently approx. 60 → Neutral-BYCZECZE territory.
• Not bought yet (> 70), so there is space for further increases.
5. MacD / Histogram:
• The histogram begins to grow green - growth moment is growing.
• This confirms that the buyers are taking over the initiative.
⸻
📈 Scenarios:
1. Bull (greater likelihood at the moment)
• If BTC pierces and stays above USD 124,500, the goal may be USD 133,500.
• Breaking over 133K opens the road even to around 140k.
2. Bear
• If the price does not pierce 124.5k and reject the resistance, it may drop to $ 113,400.
• Punction below this zone will give a signal of declines up to USD 106,800.

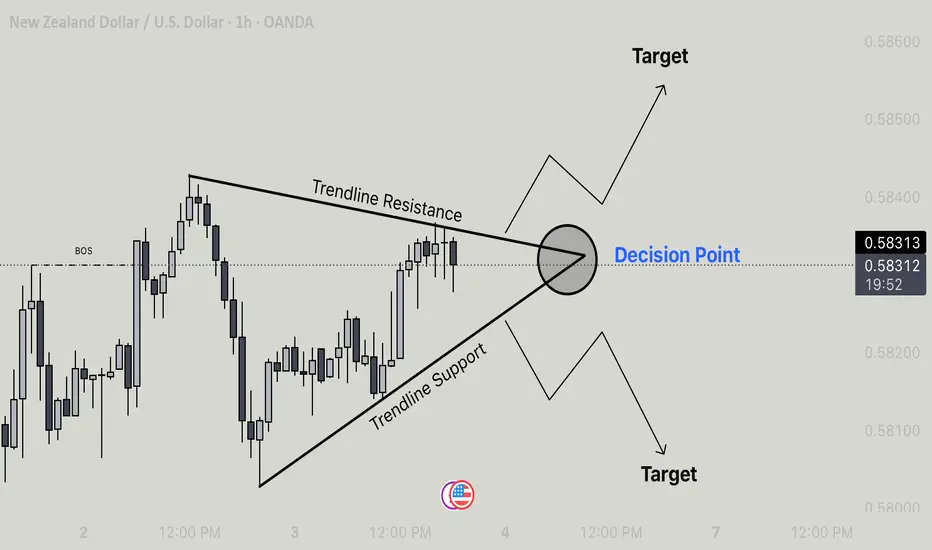
NZD/USD Symmetrical Triangle, Breakout Decision Point AheadThe price is consolidating inside a symmetrical triangle pattern formed by:
• Trendline Resistance (upper line)
• Trendline Support (lower line)
• The apex (where the two lines converge) is marked as the Decision Point. This is where price is likely to break out, either upward or downward.
Key Observations
1. Break of Structure (BOS):
• A previous structural break is marked on the chart, showing where the price had shifted momentum earlier.
2. Decision Point:
• Price is currently trading near 0.58292.
• At this point, a breakout could happen in either direction (up or down).
3. Targets:
• Upside Target: Near 0.58600 (if price breaks above the resistance).
• Downside Target: Near 0.58000 (if price breaks below the support).
Trading Implications
• Bullish Scenario: If price breaks and closes above the trendline resistance, buyers could push towards the 0.58600 level.
• Bearish Scenario: If price breaks and closes below the trendline support, sellers may drive it down to 0.58000.
• Neutral Zone: Until breakout confirmation, price may continue to consolidate inside the triangle.
Summary:
The market is at a decision point. Traders should watch for a confirmed breakout above resistance (for longs) or below support (for shorts) before entering trades.
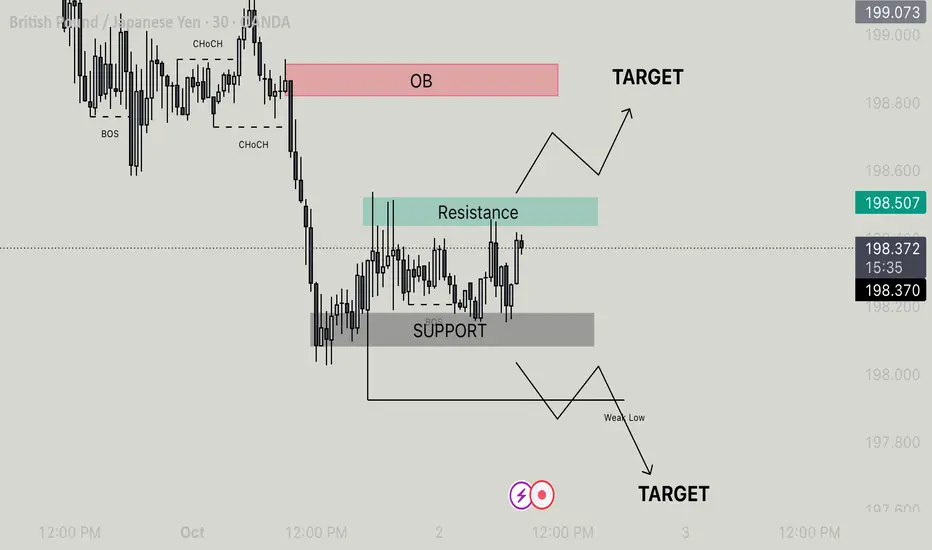
GBP/JPY - Range Bound Before Big MovePrice is currently consolidating between a clearly defined Support Zone and Resistance Zone after a strong bearish move.
Support has been respected multiple times, indicating short-term buying interest.
Resistance aligns with a previous supply zone, showing potential rejection or continuation bias.
Two possible scenarios are unfolding:
Bullish Breakout
If price breaks above the resistance zone, it could target the Order Block (OB) above, which is a key supply area from the last strong bearish move.
Break and retest of resistance would confirm bullish structure shift.
Target area: ~199.07
Bearish Continuation
A rejection from resistance could lead to another test of support.
A break below the support zone and the Weak Low would confirm bearish continuation.
Bearish target sits around 197.60 (lower liquidity grab zone).
Key Notes:
Watch for a Change of Character (ChoCH) for confirmation in either direction.
Volume and momentum confirmation will strengthen breakout bias.
Consider OB zone as a potential reversal or mitigation point.
BNB/USDT 4h chart review1. Trend and structure
• The price struck the relegation (orange) line, which is a positive signal.
• Currently, the course oscillates around 1007 USDT after reflection from holes ~ 930.
2. Key levels
• Support: 995, 971, 930.
• Resistance: 1026, 1051, 1084.
3. MacD
• The histogram grows, but begins to slightly weaken.
• MacD line still above the signal → slightly bullish signal, but with braking signs.
4. RSI (4H)
• RSI around 55–60 → neutral/bullish, not yet burdened.
5. Simple interpretation
• As long as the course lasts above 995, the upward scenario is possible.
• Breaking above 1026 will open the road to 1051 and 1084.
• decrease below 995 → Risk of retests 971, and later 930.

Liquidity Grab Complete, Bearish Move AheadPrice has recently tapped into a key resistance zone (highlighted in green), which aligns with a previous strong high, indicating a high probability of rejection. The recent move up appears to be a liquidity grab or a stop hunt before a potential reversal.
We also observe multiple CHoCHs (Change of Character) on the way up, signaling short-term bullish structure shifts. However, the price has now reached a premium zone, and an entry has been marked at the top of this rally.
Given the overextended move and rejection from the resistance zone, we anticipate a bearish move toward the OB (Order Block) below, which is a likely liquidity pool and demand zone.
Entry: 1.17445 (Resistance Rejection Zone)
Target: 1.17200 Area (OB - Demand Zone)
Stop Loss (Should be above strong high for risk management)

Will BTC come out of the downward channel?• In the chart you can see how we are close to the upper limit of the downward channel. This is a key signal - if the breaking persists, it may mean a change in the trend.
• We have several support levels from below (marked with red lines):
• 112,238 USD
• USD 108,981
• USD 107,040
• From the top you can see resistance (green lines):
• 115,266 USD (local resistance - the course is just approaching)
• 117 395 USD
• 119 404 USD
⸻
🔹 Medium walking (SMA/EMA)
• You can see EMA Cross 50/200 (yellow label) - a classic signal "Golden Cross" / "Death Cross". It seems that the average is raised recently, which the market often interprets as a signal of a potential change of trend.
• SMA #1 and #2 (red and green lines) - the course tries to stay above the average, which is positive.
• SMA #5 (blue line below) shows long -term support ~ 107k USD.
⸻
🔹 MacD (below)
• The histogram shows reversal - red posts decrease, and the lines (blue and orange) are approaching each other → possible buy signal.
• If the signal line is intersected up, this will be confirmed by the growth moment.
⸻
🔹 RSI (Relative Strength Index)
• RSI is currently around 40-50 →, i.e. a neutral level (neither purchase nor selling).
• It slightly reflects from below, which suggests that there may still be space for further growth before we enter the purchase zone (> 70).
⸻
📌 Summary
• Short -term (1-7 days): it looks like BTC is trying to stand out from the downward trend. If it pierces 115,266 USD and persists above, subsequent goals are 117 395 USD and 119 404 USD.
• Medium -term (weeks): support levels 112K - 108K are key. A decrease below 107k would negate a bull scenario.
• Technical signals: MacD and RSI give the first signs of reflection. The course balances on the border of breaking the trend.
👉 It looks at the beginning of a potential growth movement, but it will be crucial whether BTC will stay above 115K.

BTC/USDT - BREAKOUT Or BREAKDOWN AHEADThe price is currently trading around the 112,112 USDT level with slight intraday fluctuations. The chart highlights a key horizontal support and resistance (S/R) structure with two red horizontal lines marking these zones.
1. Resistance (R) Zone
The upper red horizontal line, marked as “R,” is acting as a resistance level around the 112,400 USDT region. Price has tested this level multiple times in the recent sessions. A clear breakout above this resistance could signal further bullish continuation.
2. Support (S) Zone
The lower red horizontal line, marked as “S,” is situated around the 111,600 USDT level. This zone has provided a strong demand base for buyers. If the price retraces, this level will act as a critical support.
3. Current Price Action
At the time of observation, Bitcoin is consolidating right above the resistance zone, suggesting a possible breakout attempt. The candlesticks indicate bullish momentum leading into the resistance, with a series of higher lows forming before the test of resistance. This pattern reflects increasing buying pressure.
4. Possible Scenarios
• Bullish Scenario: If the price successfully breaks and holds above the resistance zone (R), it may trigger a move towards the next target to the upside, projected around the 112,800 – 113,200 USDT region. The structure suggests the possibility of forming a bullish continuation pattern, with traders targeting higher resistance levels.
• Bearish Scenario: If the breakout attempt fails and Bitcoin gets rejected at resistance, price could retrace downward. A move below the support zone (S) at 111,600 USDT would likely signal bearish momentum, with the next target projected around the 111,200 – 110,800 USDT range.
5. Market Sentiment
The price action is consolidating in a range-bound structure between support and resistance. This often reflects market indecision before a breakout. A breakout from this range, either above resistance or below support, will provide a clearer directional bias.
⸻
Conclusion:
The BTC/USDT 15-minute chart is currently at a critical juncture. Traders should closely monitor whether Bitcoin sustains above the 112,400 resistance to confirm a bullish breakout, or if it fails and drops back below support at 111,600, signaling bearish continuation. Patience and confirmation of breakout direction are key before entering new trades.

SOL/USDT 1D chart review 1. General trend
• A strong upward trend has been underway since June (orange trend marked).
• Recently, we had a very strong rally to around USD 250, but there was a violent correction.
2. Support and resistance
• resistance:
• USD 214 (local resistance, the market has bounced down here).
• 230 USD (strong resistance).
• USD 250 (peak, main resistance).
• Support:
• USD 193 (here the price is currently fighting).
• 176 USD (another strong support - earlier consolidation).
• USD 158 (key support, fracture could mean a change in the trend).
3. STOCHASTIC RSI
• Currently in the sales zone (nearly 0) → may suggest that the market is approaching a local hole and a potential reflection.
4. Scenarios
• Bullish:
If support is supported at 193 USD, possible reflection in the direction of USD 214, and after breaking this level - an attack on USD 230.
• Bearish:
If the price pierces $ 193 down, the next goal is 176 USD, and below even USD 158.
5. Summary
• The market is in correction after strong height.
• At the moment, the key level is 193 USD. Maintaining this support can be reflected.
• However, breaking 193 will open the road to 176.
• RSI shows the sale → short -term relief.

4H IDEA FOR GBPJPY 26TH SEP, 2025.The British pound is still moving up, but choppy on the higher timeframes, but the trend is clear but more on the lower time frames. Price may continue higher in the coming session, but we sit on our hands and watch as my Bia is based on a bullish move.
As usual, my calls or analysis are based on what we see, the current Bias, and from a probability standpoint, meaning that this projection may be or may not be validated, so tread carefully, and as usual, this is not financial advice, trade responsibly

ETHUSDT 1D chart Review1. Trendline (orange) - was clearly pierced down → it is a signal of weakening the growth moment.
2. Horizers of support / resistance:
• Resistance: $ 4,604 (strong), above $ 4,960.
• Support: $ 4 150 (currently tested), next $ 3,958 and $ 3,696.
3. Price - currently ~ 4 169 $, i.e. right with the support of $ 4 150.
4. Candles - a strong inheritance candle after piercing the trend → weakness signal.
5. STOCHASTIC RSI - in the sales zone (<20), which may suggest the possibility of short -term reflection.
⸻
🔹 Application:
• Short date: possible reflection from $ 4 150 thanks to the sale (technical bounce).
• average date: If level $ 4 150 breaks and the candle closes below → the road opens to $ 3,958 and even $ 3,696.
• Only a return above $ 4 272 and a retest trendline from below would give a signal of buyers.
⸻
👉 To sum up: The market is in the critical zone - support $ 4 150 decides.
• Bull: keeping the defense of this level + reflection from the sale.
• Bear: loss $ 4 150 = greater correction in the direction of $ 3 950–3 700.

BTCUSD 4h ShortTerm Chart1. Main Trend
The chart clearly shows a descending channel – the recent upward breakout failed to hold, and the price has returned to resistance.
The pattern of lower highs (LH) and lower lows (LL) continues, likely indicating a break to a lower low.
The recent high at ~$118.3k has been rejected, and the market is heading down.
2. Key Levels
Support (red lines):
$111.426 – currently being tested.
$109.408 – stronger support, previous local lows.
$108.100 and $107.356 – further potential targets if the decline deepens.
Resistance (green lines):
$115.775 – the nearest significant resistance.
$118.322 – the upper boundary of the channel and the previous LH.
USD 122,367 – a key breakout level that would reverse the trend.
3. EMA/SMA
The 50 and 200 EMAs (blue/yellow) show a bearish cross, with the price below the averages → a negative signal.
The 200 SMA (~USD 114,137) acts as strong resistance, currently unbroken.
4. Indicators
MACD: lines strongly below the line, histogram rising in the negative zone → a downtrend with a predominance of supply.
RSI: ~33, close to the oversold zone (<30), which could result in a short-term rebound, but there is no upside divergence yet.
5. Scenarios
🔴 Bearish (more likely)
Continuation of the downward move towards 109.4k → 108k → 107.3k.
A break below 107k opens the way to 103–105k (LL2 on the chart).
🟢 Bullish (less likely)
A defense of 111.4k and a return above 114.1–115.7k.
A break above 118.3k would negate the downtrend and open the way to 122k+.

BTC/USD 12H local downtrend📊 Chart structure
• BTC price: ~ 112,765 USD (decrease -2.18%).
• Trend: after prior reflection from the holes (~ 107k), BTC is approaching the resistance zone.
• Inheritance channel: The marked yellow line suggests that the price is still in a medium -term inheritance trend
⸻
🔑 levels of support and resistance
• Support:
• USD 111,461 (close to support - if it falls, a quick test below).
• USD 107,346 (key support - its loss opens the road towards 103-105k).
• resistance:
• USD 118.004 (important level of resistance).
• USD 124.619 (strong resistance - local peaks).
⸻
📈 indicators
• SMA (movable average):
• Red (SMA #1) - short -term, currently acts as dynamic resistance.
• Green (SMA #2) - average, the price fights around it.
• Blue (SMA #5) - long -term, still above the price, which means inheritance pressure.
• MacD:
• You can see a slight weakening of the growth moment. If there is no strong demand, it is possible to cut the signal down (inheritance signal).
• RSI (12H):
• fell from the level close to buying (~ 70) to ~ 45–50.
• Neutral, but with a slight tendency to further weakness.
⸻
🧭 Scenarios
1. Bullish:
• Support defense 111,400 USD → Reflection up.
• If $ 118,000 stands out, the next target is USD 124,600.
• Breaking over 125K will negate the inheritance channel and can open the road to 130K+.
2. Bearish:
• Support loss 111,400 USD → test 107,300 USD.
• If the 107K does not stand, a further decrease is possible to 103-105k.

Shriram Finance at Crossroads: Breakout or Breakdown..?
* CMP: ₹633
* Resistance: ₹640 (important barrier)
* Support: ₹630 (trendline + price support)
* Trend: Short-term uptrend
---
🔼 Bullish Scenario
* If price breaks and sustains above ₹640, it may extend the uptrend.
* Upside targets:
* 🎯 ₹648
* 🎯 ₹655
🔽 Bearish Scenario
* If price breaks below the trendline and loses ₹630 support, downside pressure likely.
* Downside targets:
* 🎯 ₹624
* 🎯 ₹620
📌 Conclusion
* As long as ₹630 holds, buyers have control.
* A breakout above ₹640 will strengthen the bullish case.
* A breakdown below ₹630 shifts sentiment bearish, opening room for deeper correction.
