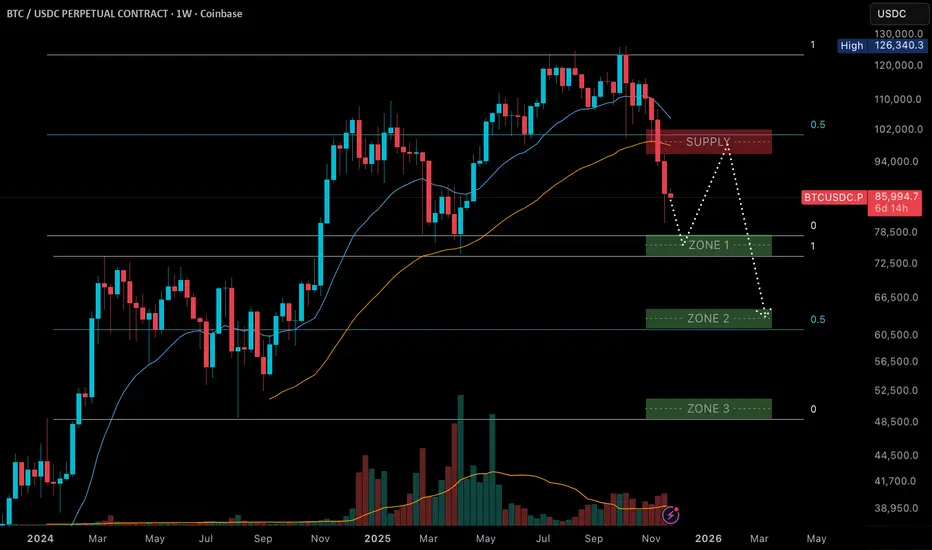
BTC Next weekly targetsMy last TA was on point at the top. However, the initial target isn't met yet. As we broke the weekly trend already, I expect a kind of a pullback to the supply (re-distribution area) and then back down.
Acceptance above the supply area would invalidate the idea. For now, I expect a little relief bounce to that area from here of from lower down before the next level gets revisited.
Restest
Gold Eyes Short-Term Pullback Before Key Support Test"Gold Eyes Short-Term Pullback Before Key Support Test 🏆📉"
Market Structure
The chart shows a clear range-bound price action between the strong support near 3,303 – 3,316 and the resistance zone around 3,420 – 3,440.
Multiple Higher Lows (HL) indicate that the market has been trying to build a bullish structure, but the recent level rejection from resistance suggests sellers are still defending that zone aggressively.
2. Key Zones
Resistance (3,420 – 3,440): Price tested this level and faced a sharp rejection, marking it as a strong supply zone.
Support (3,303 – 3,316): Historical buy reactions are seen here, making it a crucial demand zone.
Entry Zone: Around 3,351 – 3,360, which is being used for the current short setup.
3. Pattern & Price Action
BOS (Break of Structure) occurred earlier on the left side of the chart, breaking above previous highs and confirming bullish strength at that time.
BOL (Break of Low) later on indicates a shift in momentum, as price failed to maintain the bullish push and created a bearish swing.
The Bullish Fair Value Gap (FVG) earlier provided a springboard for upward movement, but recent momentum failed to sustain.
4. Current Trade Idea (Short Bias)
Entry: 3,351 – 3,360 (retracement to minor resistance after breakdown).
Stop Loss: Above 3,380, protecting against a false breakout.
Target: 3,316 (mid-term) with a possible extension to 3,303 if bearish pressure continues.
5. Sentiment & Risk Factors
Bears are currently favored due to the rejection from major resistance and the inability of bulls to reclaim 3,380+.
If the price reclaims and holds above 3,380, this short setup will be invalidated, and the market could retest 3,420 – 3,440.
📌 Summary:
XAUUSD is trading in a defined range, with the current structure leaning bearish after resistance rejection. A short position from the entry zone targets the strong support below, but traders should remain cautious as higher lows in the past indicate that bulls may still attempt to defend support aggressively.

Mayor resistanceI bought puts there expire a month from now strike 190. That's a mayor resistance zone I think is going to 180 right there 10 dollars drop. My SL 195.

GBPJPY H1Hi traders, watch GBPJPY with your own according strategy and look for a short position opportunity for a short term trade setup GOOD LUCK.

EURUSDHi traders, watch EURUSD with your own according strategy and look for a short position opportunity for a short term trade setup GOOD LUCK.

GBPAUD H1Hi traders, GBPAUD is setting up for a upside move the price is testing the support level and double bottom neckline.

EURCHF H1Hi traders, EURCHF is setting up for a long watch trendline breakout and look for long GOOD LUCK.

USDCAD POSSIBLE MOVE H1Hi traders, My point of view for the USDCAD. watch price action and look for short GOOD LUCK.

AUDJPY | About to start a new bearish movement
AUDJPY is still within a descending channel and reached a level to either breakout the channel or stay within it and start a new bearish movement...I'm personally bearish but i will wait for confirmation on the 94.600 level before opening short positions.
Share your opinion in the comments and support the idea with like.

AUDCAD | will continue its bullish movement!
After last Thursday breakout of the descending channel, we are waiting for a succesful retest around the 0.90200 level before riding the next bullish movement.
Share your opinion in the comments and support the idea with like.


Quantum (QTUM) Buy ZoneQuantum (QTUM) Buy Zone
--------------------
BIAS
Mid-Term : Bullish
Risk : Medium
On the 4 hours timeframe, Quantum has retested lower parallel channels and the the price is also mid-term support zone.
--------------------
$QTUM/USDT LONG SETUP
Leverage : x3 - x5
Entry Price : 6.15 - 5.97
TP 1 : 6.346
TP 2 : 6.525
TP 3 : 6.59
TP 4 : 6.91
TP 5 : 7.15
TP 6 : 7.31
TP 7 : 7.65
TP 8 : 8.075
Stop Loss : 5.75
*Maximum 3% of Portfolio.
*Unload 12.5% at each TP. Whenever TP 2 hits, Move stop loss to entry.
--------------------

GBPAUD Buy setupPrice currently downtrend but right now it the weekly trend line and make higher high and high low. WAIT FOR BREAK & Retest and Buy GL!!!

Cryptyk (CTK) Sell ZoneCryptyk (CTK) Sell Zone
--------------------
BIAS
Mid-Term : Neutral
Long-Term : Neutral
Risk : High
Cryptyk will likely be a short-term correction down to a potential low around $0.985, where we would retest our previous long-term support zone and expect a high volume and high strength move up above this entry zone.
--------------------
$CTK/USDT SHORT SETUP
Leverage : x3 - x5
Entry Price : 1.175 - 1.23
TP 1 : 1.162
TP 2 : 1.145
TP 3 : 1.1
TP 4 : 1.086
TP 5 : 1.06
TP 6 : 1.025
TP 7 : 1
TP 8 : 0.985
Stop Loss : 1.275
*Maximum 2% of Portfolio.
*Unload 12.5% at each TP. Whenever TP 2 hits, Move stop loss to entry.
--------------------

1inch Network (1INCH) Buy Zone1inch Network (1INCH) Buy Zone
--------------------
BIAS
Mid-Term : Bullish
Long-Term : Bullish
Risk : Medium
With short-term bounce from $1.55 zone, 1inch Metwork has contributed greatly to our latest bearishness.
--------------------
$1INCH/USDT LONG SETUP
Leverage : x3 - x5
Entry Price : 1.5 - 1.575
TP 1 : 1.645
TP 2 : 1.69
TP 3 : 1.735
TP 4 : 1.775
TP 5 : 1.825
TP 6 : 1.9
TP 7 : 1.945
TP 8 : 1.995
Stop Loss : 1.4
*Maximum 3% of Portfolio.
*Unload 12.5% at each TP. Whenever TP 2 hits, Move stop loss to entry.
--------------------

Polygon (MATIC) Buy ZonePolygon (MATIC) Buy Zone
--------------------
BIAS
Mid-Term : Bullish
Long-Term : Bullish
Risk : Medium
Polygon rejected $1.6 zone on its short-term rates, currently reaching between entry zone and last targets. Strong support currenlty at $1.4 zone which must be held on the 4 hours timeframe to confirm such a move above our trendline.
--------------------
$MATIC/USDT LONG SETUP
Leverage : x3 - x5
Entry Price : 1.48 - 1.4
TP 1 : 1.525
TP 2 : 1.56
TP 3 : 1.61
TP 4 : 1.67
TP 5 : 1.73
TP 6 : 1.79
TP 7 : 1.87
TP 8 : 1.98
Stop Loss : 1.28
*Maximum 3% of Portfolio.
*Unload 12.5% at each TP. Whenever TP 2 hits, Move stop loss to entry.
--------------------

Swipe (SXP) Buy ZoneSwipe (SXP) Buy Zone
--------------------
BIAS
Mid-Term : Neutral
Long-Term : Bullish
Risk : Medium
Swipe has become mid-term neutral as it retested its $1.2 zone and rejected them with recent strength. This means we have to wait for further price action confirmation, which will determine SXP’s next significant move.
--------------------
$SXP/USDT LONG SETUP
Leverage : x3 - x5
Entry Price : 1.15 - 1.23
TP 1 : 1.275
TP 2 : 1.375
TP 3 : 1.46
TP 4 : 1.53
TP 5 : 1.6
TP 6 : 1.705
TP 7 : 1.765
TP 8 : 1.83
Stop Loss : 1.05
*Maximum 3% of Portfolio.
*Unload 12.5% at each TP. Whenever TP 2 hits, Move stop loss to entry.
--------------------

AUDUSD - Potential retest ContinuationHello Traders
Here is a new SELL Scenario, this pair has extented his recovery, and may fail to pass this resistance 7160/83
for now this is just a probability, if it break the resistance, it would suggest further strength
JamdeJam will not accept any liability for loss or damage as a result of
reliance on the information contained within this channel including

LUNA Breakout of Flag patternHi traders,
Here is another idea and TA for Terra LUNA coin from me. As I had expected in the previous related idea.
LUNA followed somewhat the same pattern, and has just broken out to the Flag pattern and now, we can observe if it re-tests the current support level. If it does, it should continue the direction of the original trend.
That could then be a Buy signal.
Happy Trading.
Thank you.
Disclaimer: This is not a financial or investment advise. Please do your own analysis before taking any trades.

Polygon (MATIC) Buy ZonePolygon (MATIC) Buy Zone
--------------------
BIAS
Mid-Term : Bullish
Risk : Medium
Polygon has retested $1.5 zone many times on 4 hours timeframe over the last week, from where we've bounced with very decent strength up to $1.65 zone.
--------------------
$MATIC/USDT LONG SETUP
Leverage : x3 - x5
Entry Price : 1.48 - 1.56
TP 1 : 1.59
TP 2 : 1.64
TP 3 : 1.68
TP 4 : 1.725
TP 5 : 1.78
TP 6 : 1.83
TP 7 : 1.89
TP 8 : 2
Stop Loss : 1.385
*Maximum 3% of Portfolio.
*Unload 12.5% at each TP. Whenever TP 2 hits, Move stop loss to entry.
--------------------

Kyber Network (KNC) Buy ZoneKyber Network (KNC) Buy Zone
--------------------
BIAS
Long-Term : Bullish
Risk : Medium
Already retesting our previous lows, decent buying volume giving it a more than decent probability of retesting lower entry.
--------------------
$KNC/USDT LONG SETUP
Leverage : x3 - x5
Entry Price : 1.28 - 1.36
Mid-Term
TP 1 : 1.385
TP 2 : 1.42
TP 3 : 1.495
TP 4 : 1.582
Long-Term
TP 5 : 1.71
TP 6 : 1.89
TP 7 : 2.11
TP 8 : 2.32
Stop Loss : 1.165
*Maximum 3% of Portfolio.
*Unload 12.5% at each TP. Whenever TP 2 hits, Move stop loss to entry.
--------------------

Bitcoin's Wicked Weekly @RSI/VolumeBTC Retest on the Card! Before the Big Move!!
WEEKLY CHART
*********
RSI - Bearish Divergence
Volume - Declining
Conclusion - It may touch 53k to 52k
Wish you Safe & Happy Trading

NQ Power Range Report with FIB Ext - 11/1/2021 SessionContract - CME_MINI:NQZ2021
- PR High: 15897.00
- PR Low: 15863.75
Evening Stats
- Gap: = N/A
- Session Open ATR: 210.59
- Volume: 22k
- Open Int: 247k
- Trend Grade: Long
- From ATH: 0% (Rounded)
Key Levels (Rounded - Think of these as a range)
- Long: 16105
- Mid: 15819
- Short: 15247
Keep in mind this is not speculation or a prediction. Only a report of the Power Range with Fib extensions for target hunting. Do your DD! You determine your risk tolerance. You are fully capable of making your own decisions.
