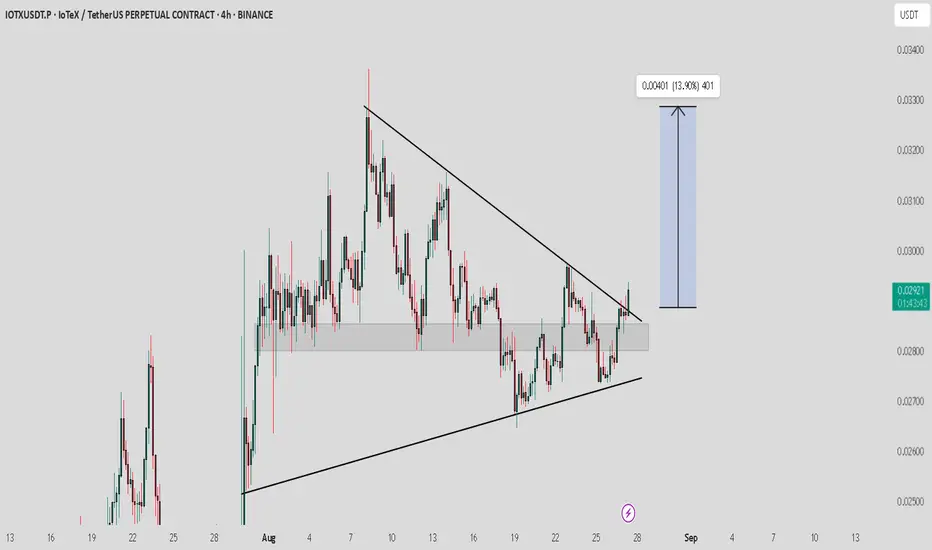
IOTX / USDT : Breaking out from symmetrical triangleIOTX/USDT has broken out from the symmetrical triangle. The key now is confirmation — a retest of the breakout zone may occur before continuation. If this level holds, price could rally toward the $0.0315 – $0.033 zone (+13–15%).
Trade Setup:
Entry: On successful retest hold / bullish confirmation candle above $0.030
Targets: $0.0315 – $0.033
Stop-Loss: Below $0.028 (breakout zone invalidation)
Best strategy: Wait for retest confirmation to avoid getting trapped in a false breakout.
Retest
BTC Might Drop to 100,000 (at least) After Today's Retest CandleSaw a Double Top Pattern in 1D with a minimum objective of going to 99,800. Also saw a Head and Shoulders in 4H , with a measurement minimum objective of going to 106,500 more or less
Although this is a bearish signal. I will be looking for the retest today. So far, today's candles are showing a lot of bullish patterns. Starting from the Flat Top Triangle in 1H , and the Inverse Head and Shoulders in 15m in total agreement with its volume.
For me, it's safe to say i will be taking this buy trade and set my TP at 111,500.00. After that, i will wait for consolidation and watch for a downside break and enter for a sell there. My TP for the sell will be divided into 2. 1 at around 105,200. and 1 at around 99,800. Stop loss will be just above 112,900.
Anyways, Disclaimer on. Happy Trading!

USDJPY - Bulls Loading at the Golden Zone?USDJPY has been overall bullish 📈 , trading inside a rising channel after bouncing from the April lows.
Recently, price rejected the weekly resistance zone (~152.000) and is now approaching the daily support zone (~146.000 – 144.000).
This support area also lines up with the lower bound of the channel 🔵, making it a potential launchpad for the next bullish impulse 🚀.
If buyers step in here, we could see a rebound toward the upper blue trendline, while a confirmed break below support would flip the outlook bearish.
In Brief:
- Trend: Overall bullish 📈
- Key Levels: 146.000 – 144.000 support | 152.000 resistance
- Plan: Look for long setups near support ✅
📚 Always follow your trading plan regarding entry, risk management, and trade management.
Good luck!
All Strategies Are Good; If Managed Properly!
~Richard Nasr
Disclosure: I am part of Trade Nation's Influencer program and receive a monthly fee for using their TradingView charts in my analysis.

Bitcoin will bounce from buyer zone and start to growHello traders, I want share with you my opinion about Bitcoin. The broader market context for Bitcoin has been one of prolonged and volatile consolidation, with price action largely contained between two dominant control zones: a major seller zone capping rallies near 120000 and a foundational buyer zone providing strong support around 112000. After the most recent rejection from the upper boundary, the asset has undergone a significant downward correction, which has taken the shape of a smaller descending triangle. Currently, the price has reached a critical inflection point, as it is testing the apex of this triangle directly at the major horizontal support level of 112000. The primary working hypothesis is a long scenario, which anticipates that the strong historical demand within the buyer zone will absorb the recent selling pressure and initiate a powerful rebound. This rebound is expected to be strong enough to cause a breakout from the descending triangle, signaling a shift in short-term momentum. The scenario further anticipates a brief retest of the broken triangle's resistance line from above to confirm it as new support. Following a successful retest, the path would be clear for a continued rally. Therefore, the tp for this move is logically placed at the 117000 level. Please share this idea with your friends and click Boost 🚀
Disclaimer: As part of ThinkMarkets’ Influencer Program, I am sponsored to share and publish their charts in my analysis.

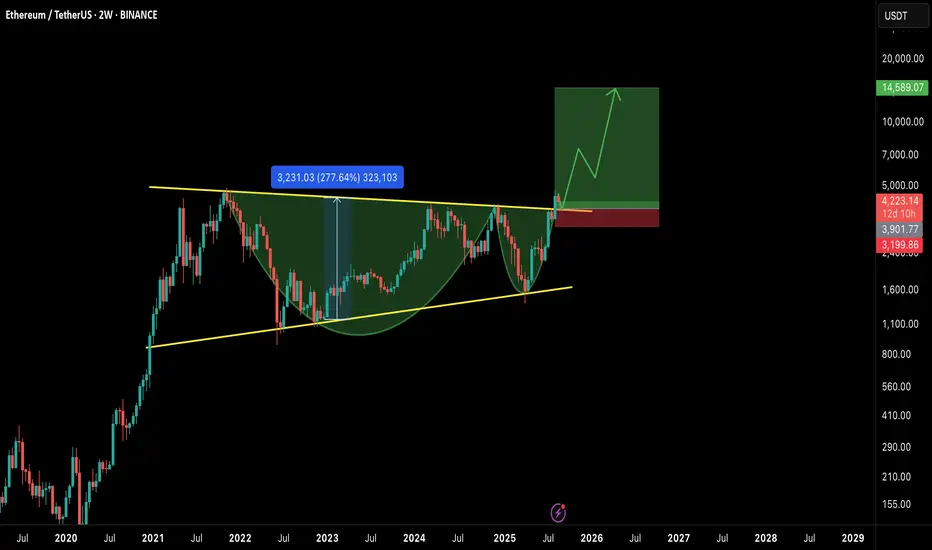
ETH/USDT – Mega Breakout on Higher Timeframe!Ethereum has confirmed a massive breakout on the 2W timeframe, breaking through a multi-year cup & handle and also ascending triangle formation. This is one of the strongest bullish continuation patterns and could fuel ETH into a new long-term rally. 🚀
📊 Chart Analysis
Pattern: Cup & Handle on the 2W chart.
Breakout Zone: Around $4,000–$4,300, now acting as support.
Measured Move Target: ~$14,500 (based on cup depth).
Stop Loss Zone: ~$3,200 (below major support).
✅ Bullish Factors
Multi-Year Accumulation: ETH has spent years consolidating below $4K, and this breakout confirms strength.
High R:R Setup: Risk is limited while the potential upside is ~3x from current levels.
Market Cycle Timing: BTC dominance topping out + potential altseason rotation favors ETH’s outperformance.
Strong Structure: Break above resistance aligns with long-term moving averages flipping bullish.
⚠️ Risk Factors
Macro events (FOMC, inflation data) could cause temporary retracements.
A weekly close back below $4K would invalidate the breakout.
BTC volatility may suppress ETH in the short term before altseason kicks in.
🎯 Targets
TP1: $6,500
TP2: $9,500
TP3: $14,500 (full measured move target)
📌 Conclusion
ETH is showing one of the strongest technical breakouts in years. If $4K+ holds as support, the path to new ATHs and beyond looks wide open. This setup could define the next phase of the bull market.
Bulls are in control — it’s ETH’s time to shine. 🌟
🔔 What’s your target for ETH in this cycle? $10K or higher? Let me know in the comments
EIGEN / USDT : Keep a close watch on retest processEIGEN/USDT – Bullish Breakout Potential
EIGEN has broken the descending resistance trendline, signaling a possible upward move. The current breakout shows strong bullish momentum with a target of around 0.830 USDT, offering a potential 52.73% gain. Keep an eye on this level for possible retest and confirmation.
Key Points:
Strong trend reversal from the downtrend.
Breakout above resistance could lead to further gains.
Target price 2.4 USDT.
Risk management advised for volatile market conditions.
Stay sharp and trade wisely!

GBP/NZD Breakout & Retest, Potential Bullish RallyThe GBP/NZD chart on the 4-hour timeframe shows a symmetrical triangle pattern that has formed since late April 2025, with a descending upper trendline and an ascending lower trendline. During this period, price has continued to move within an increasingly narrow range, creating price compression that is characteristic of a symmetrical triangle pattern. The pattern’s upper resistance line has been tested multiple times (red arrows), while the lower support line has consistently maintained higher lows (green arrows).
Recently, price successfully broke above the pattern’s upper resistance line with a clear breakout, followed by a retest phase that held above the pattern line. This scenario indicates a role reversal, where the former resistance now acts as new support. A long green Heikin Ashi candle after the retest provides an additional signal that buying momentum is currently dominant.
Trade Plan:
Entry is taken after confirmation of breakout & retest, with the take profit (TP) set at 2.3200 as a key resistance area and the nearest historical high target. The stop loss (SL) is placed at 2.2600, just below the retest area, to anticipate the possibility of a false breakout.
Trading Plan Details:
Direction: Long (Buy)
Timeframe: 4H
Reason: Symmetrical Triangle Breakout + Retest
Entry: After retest & bullish candle confirmation
TP: 2.3200
SL: 2.2600
Additional Confirmations:
Green Heikin Ashi candle without a lower shadow as a sign of strong momentum
Increased buying pressure following a consolidation period
Disclaimer: This analysis is part of a trading plan and does not constitute investment advice. Always use strict risk management and consider potential losses in every trading decision.

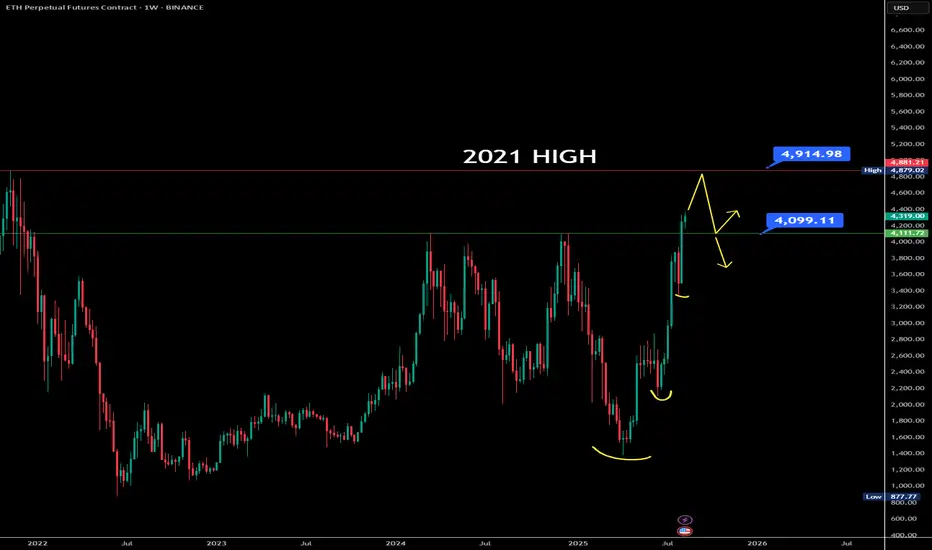
$ETH breakout leading to test 5000$Over the past three months, Ethereum has been consistently forming higher lows, starting from the ~$1,362 level, showing a strong and sustained uptrend. Recently, ETH decisively broke above the $4,100 resistance zone, which had previously rejected price action three times.
With this breakout, I’m not expecting an immediate retest of $4,100. Instead, price may continue its rally toward the 2021 all-time high near $4,900. Only after testing that level could we see a pullback to retest the $4,100 zone or even fill the small gap near $4,050.
On the fundamentals side, ETH ETF inflows remain positive on a daily basis, signaling strong institutional demand. Combined with increased whale accumulation, buying pressure continues to dominate.
Earlier, I considered this area for a potential short, but the price action and on-chain data now clearly indicate this is not a shorting opportunity—momentum remains bullish.
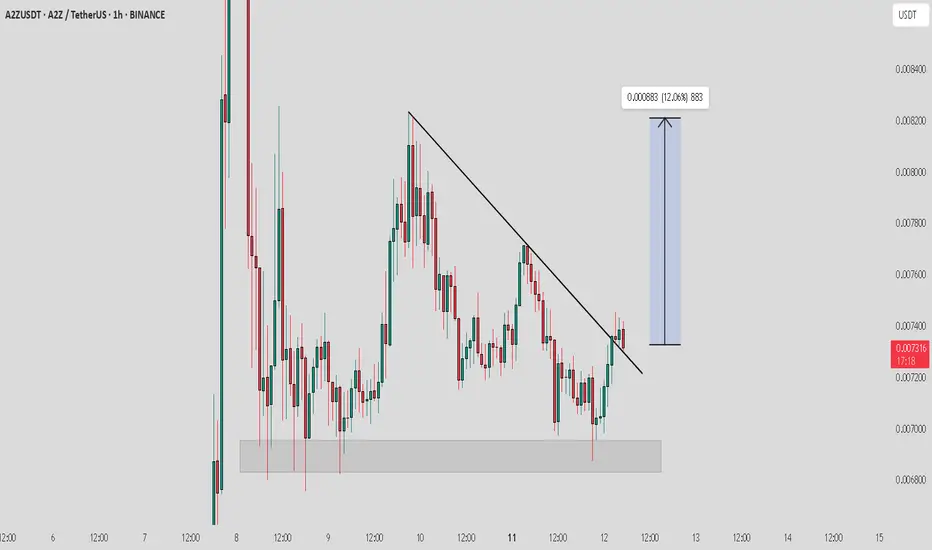
A2Z / USDT : Keep a close watch on retest progressA2Z/USDT Breakout + Retest in Progress 🚀
We’ve seen a solid breakout from the downtrend resistance line. Currently, A2Z/USDT is in the process of retesting the breakout zone. If this retest is successful, we are likely to see a strong upward move targeting a 12%+ gain as shown in the chart.
Keep an eye on the price action around the retest zone. A successful retest could set the stage for a nice bullish move.
Stay alert and trade wisely!
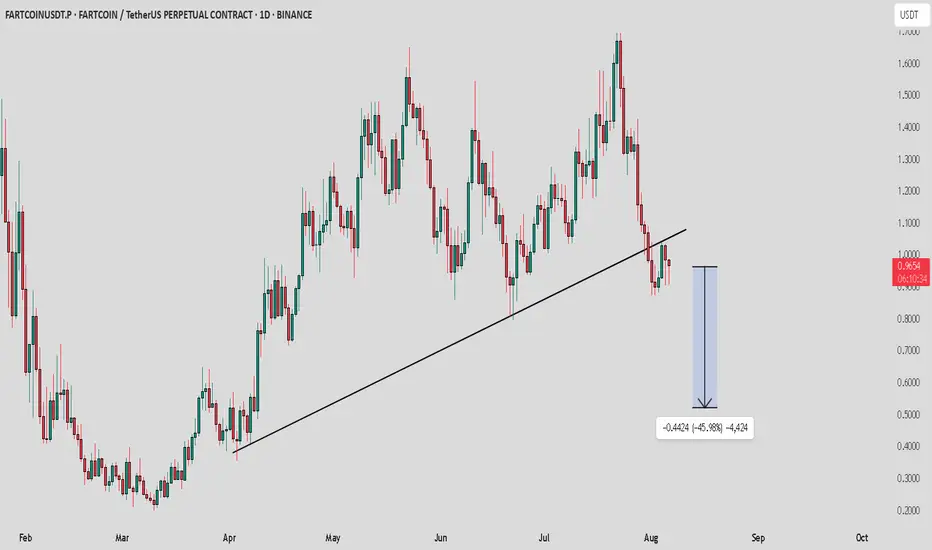
FARTCOIN / USDT : Trendline broken and retest successfulFARTCOIN: Trendline Broken, Bears in Control!
FARTCOIN's uptrend from March has been decisively broken. Price rejected the key trendline and is now showing strong bearish momentum. Expect further downside, with a potential target around $0.50. Bears are firmly in control!
BTC Retest In Progress – Ready for Liftoff?🚀 Bitcoin has been respecting the long-term rising channel (blue) — moving in clear impulsive 📈 and corrective 📉 waves.
After each bullish leg (highlighted in pink), BTC dips into a correction (red), finds support at key demand zones 🟧, and then kicks off a new rally.
🔥 Currently, BTC is hovering near a strong demand zone around the $110,000–$113,000 area, forming a potential higher low within structure.
If this zone holds, the bulls 🐂 could regain control and push price toward the $130,000–$140,000 range — aligning with the upper boundary of the channel 📊.
💡 Continuation soon?
Let the market decide — we’re watching this zone closely for a bullish breakout confirmation ✅
💬 What’s your bias here? Are you bullish or waiting for a deeper pullback?
📚 Always follow your trading plan regarding entry, risk management, and trade management.
Good luck!
All Strategies Are Good; If Managed Properly!
~Richard Nasr

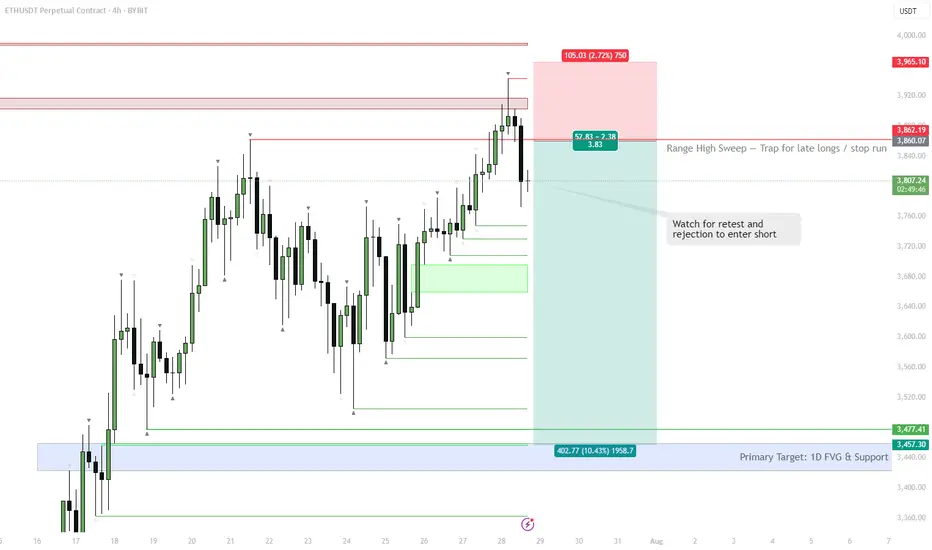
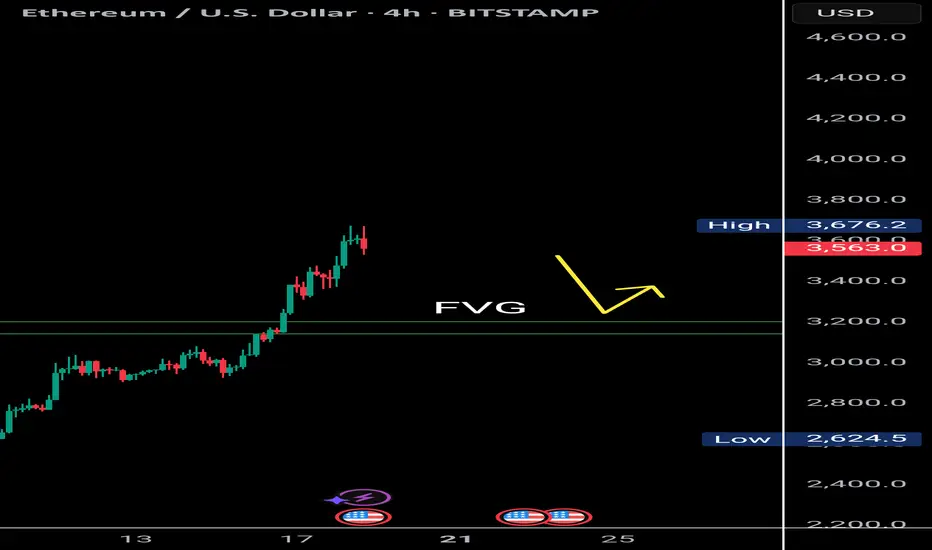
ETH | #4h #short — Range High Sweep & Short SetupScenario:
ETH swept the range high at $3,860, trapping late buyers and triggering stops. Watching for a retest of this level — if it holds as resistance and we see rejection, that’s a short trigger.
Target:
Main target is the 1D FVG at $3,457–$3,477. Possible extension: sweep of range low if selling accelerates.
Why:
Failed breakout setups are classic mean reversion triggers, especially when supported by a visible liquidity pool (FVG) below.
Plan:
Wait for a retest and rejection to confirm short. Partial TP at the FVG zone, manage risk above the sweep high.
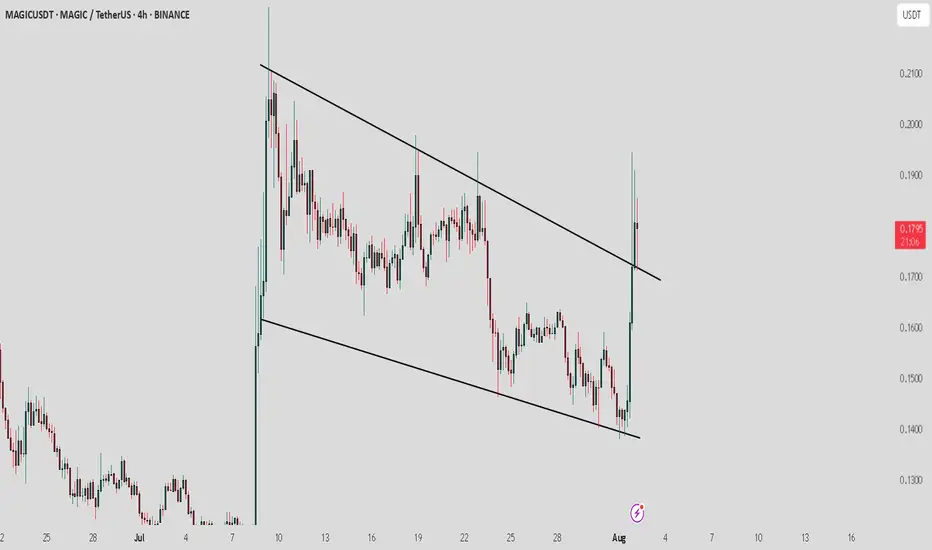
MAGIC/ USDT: Retest is in progress, keep a watch on confirmationMAGIC / USDT has broken out from the Trendline resistance and retest is still in progress . However, the market conditions are not ideal right now.
Bullish scenario : If the price holds above the breakout level and the retest is confirmed, the next target could be 0.19–0.21.
Bearish scenario : A failure to maintain above the breakout level may lead to a drop back to 0.15 or 0.13.
Pro Tip: Use tight stop-losses below the breakout point. Wait for confirmation before committing larger positions. Keep an eye on BTC dominance
#BTCUSDT – Healthy Correction, Not the End!Bitcoin is currently experiencing a healthy pullback after an impressive run, testing the neckline of the Inverse Head & Shoulders breakout on the 1D timeframe.
🔹 Current Market View:
BTC is retesting the neckline of the IHS pattern, which now acts as a strong support zone.
Price is holding near $113K–$115K, which is crucial for maintaining bullish momentum.
This dip is a healthy correction, flushing out over-leveraged positions and preparing for the next leg up.
🔹 Key Levels:
Support Zone: $113,000 – $115,000
Immediate Resistance: $120,000 – $122,500
Breakout Target: $165,000+ on the next bullish wave
🔹 Market Sentiment:
Holding above the neckline keeps the bullish structure intact.
If the support holds, we can expect continuation to new highs once buying pressure returns.
A daily close below $112K would signal caution and delay the next rally.
💡 Tip: Don’t panic on these red candles. Healthy corrections are part of a sustainable uptrend.
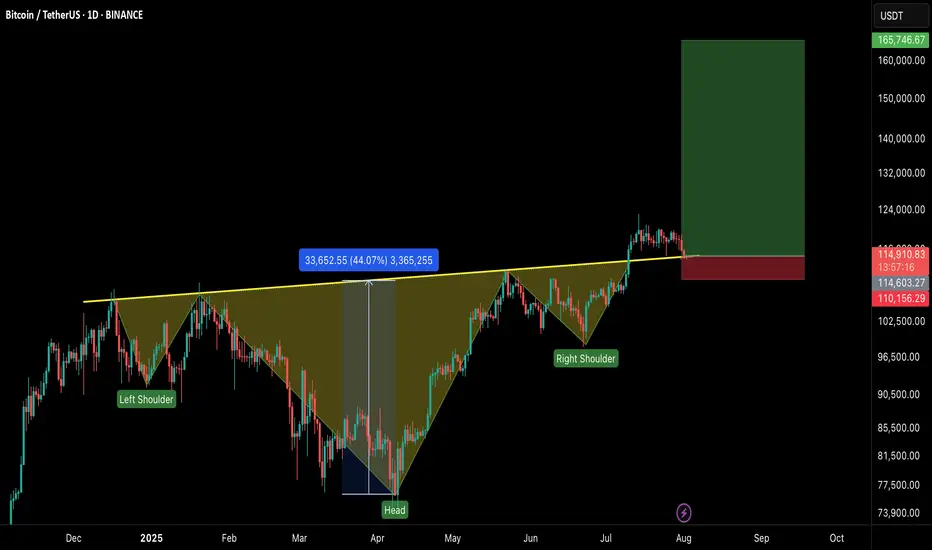
This is why I firmly believe we'll witness BTC reach 150K soon.No caption needed and every reasons are kept in the chart. Zoom In and analyze every single lines in the chart and hope you will see what I tend to see as far as my capabilities allows me. Let me know your comments on the idea. I am looking forward to witness $150K in the next 3 to 4 months time. I will be updating my confluences to say this on higher timeframes too.
With Regards. And stay Tuned.

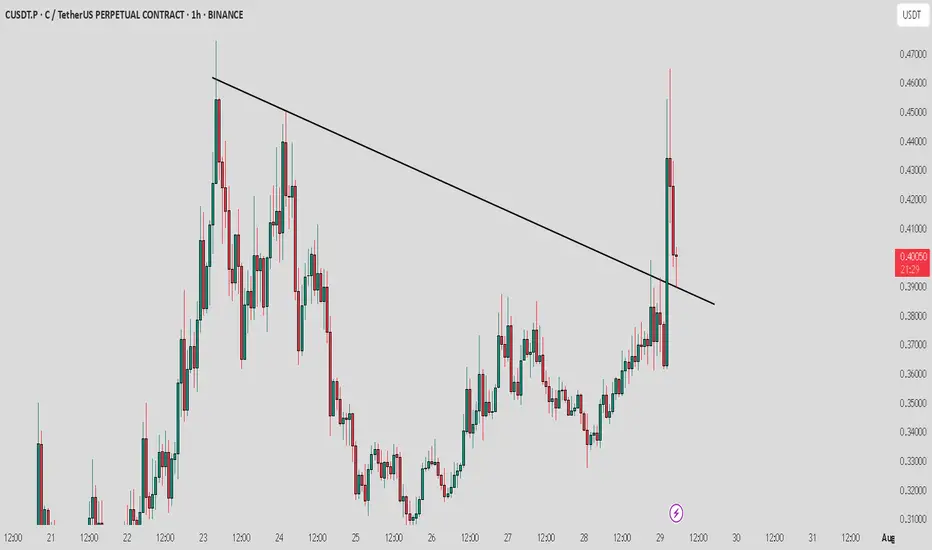
C / USDT : Watch closley to a retest for better Entry and profitC/USDT is currently retesting the breakout area. Expecting a short-term rally of 15-20% if the retest holds.
Bullish Scenario: If the retest is successful, we could see a continuation of the uptrend towards higher targets.
Bearish Scenario: A failure to hold the breakout level could lead to a pullback towards key support levels.
Pro Tip: Keep a tight stop loss around the breakout level to manage risk while targeting potential gains in the rally.
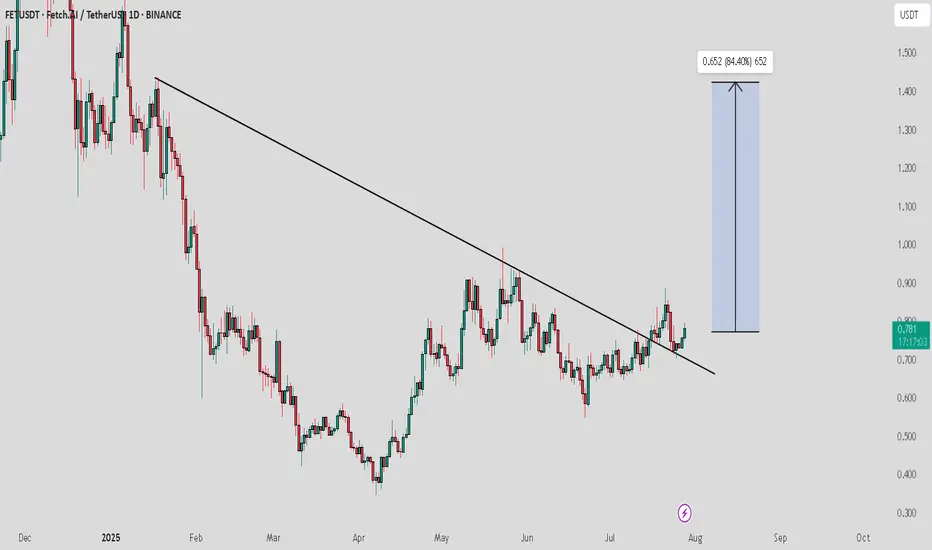
FET / USDT : Momentum building after successful retestFET/USDT has successfully broken out of the descending trendline resistance and is now holding strong after a successful retest. With momentum building, we are expecting a significant move towards the $1.5 level in the coming weeks.
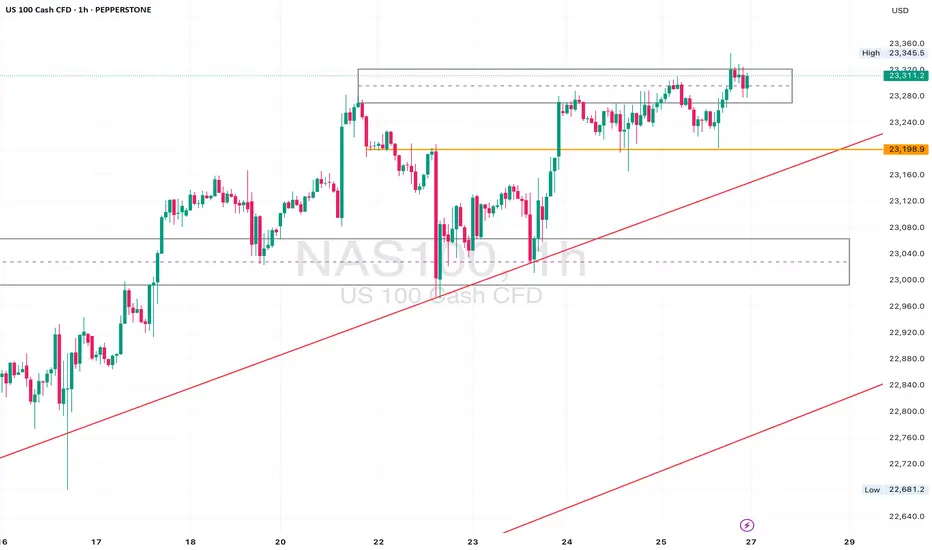
NAS100 Retesting Breakout – Eyes on 23170 for Bullish PushDaily Analysis:
Price is testing the upper boundary of the long-term ascending channel. Structure is still bullish with no major breaks of support. If momentum holds, we could extend toward the channel top.
4H Analysis:
Retesting breakout structure. Support is forming around 23000–23050. Bullish momentum remains valid unless price closes below this zone.
1H Analysis:
Micro-breakout confirmed with bullish impulse above 23120. If 23170 holds, continuation toward 23280–23320 is likely.
Confirmation & Entry:
Watch for continuation above 23170. SL below 23080. TP: 23280+
Use caution if 23000 breaks — this would weaken short-term bias.
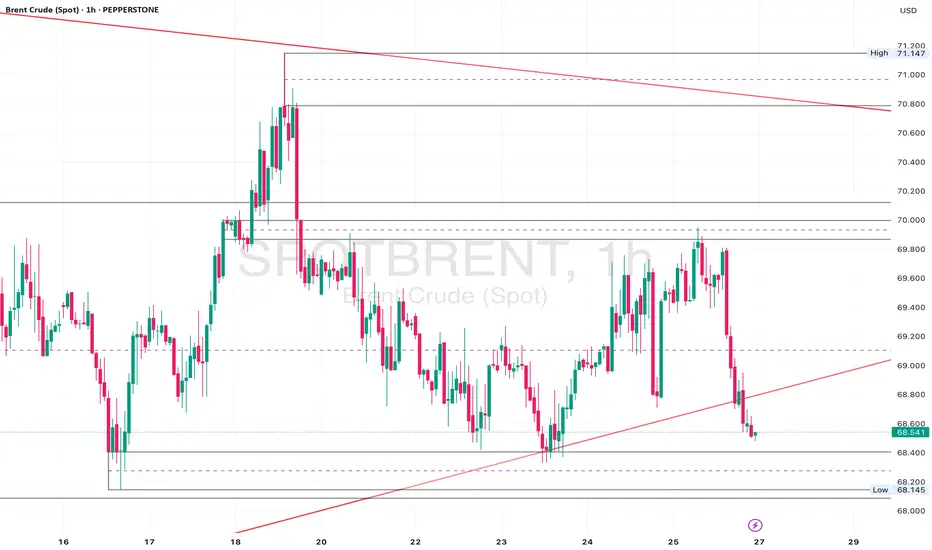
Brent Crude Sitting at Key Support – 69.20 Hold for a Rebound?Daily Analysis:
Price is holding above the ascending trendline and forming higher lows. Multiple rejections from the 68.00 region suggest strong demand. As long as we remain above the trendline, bulls stay in control.
4H Analysis:
Pullback after rejecting 71.00. Now sitting inside the 69.60–69.20 demand area. Bullish channel is still valid unless we break below 68.50.
1H Analysis:
Price broke the rising channel but is now hovering near key support. Bullish re-entry possible if lower timeframe aligns around 69.60.
Confirmation & Entry:
If we see bullish engulfing or pin bar at 69.60–69.20, this could signal a long setup back to 71.00. Invalidated on clean break below 68.50.
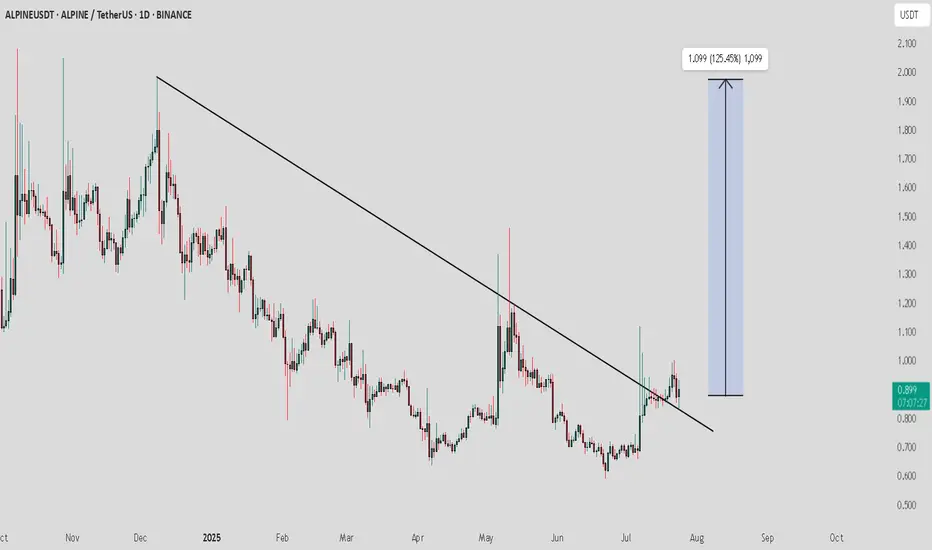
ALPINE / USDT : looking bullish ALPINEUSDT Analysis:
The price is currently retesting the downward trendline. This is a crucial point where the price may either bounce off or fail to hold the trendline, signaling the next major move.
Bullish Scenario:
Trendline Retest and Bounce: If the price holds above the trendline and shows bullish momentum, we could see a rise towards 1.099 (125.45% potential upside).
Confirmation: Look for strong buying volume during the retest to confirm the bounce.
Bearish Scenario:
Trendline Breakdown: If the price fails to hold the trendline and breaks below it, this could trigger a downward move.
Target: Watch for the next support levels to gauge the potential downside.
$Eth Faces Double Top Resistance with Bearish RSI DivergenceETH/USDT | 4H Analysis
Ethereum is currently showing signs of weakness on the 4H chart, forming a potential double top pattern around the $3,700-$3,680 range.
Adding to this, the RSI is exhibiting bearish divergence, suggesting that bullish momentum is fading. There's a visible liquidity gap between $3,200–$3,180, which might act as a magnet in the short term. A retest of this zone is likely before ETH attempts to resume its upward move.
Key Observations:
🟠 Double top structure on 4H chart
🔻 Bearish RSI divergence
🕳️ Favorable gap: $3,200 – $3,180
🔁 Watch for price reaction after retest
⚠️ If ETH holds the $3,180 support after filling the gap, a bullish bounce toward higher levels could follow.
📌 This idea is for educational purposes. Trade wisely with proper risk management.
Elecon Engineering: Pre-Breakout Momentum Building!🚀 Elecon Engineering: Pre-Breakout Momentum Building! 🚀
📉 CMP: ₹716
🔒 Stop Loss: ₹652
🎯 Target: ₹952
🔍 Why It Looks Promising?
✅ Rounding Bottom Breakout: Strong breakout above ₹652 with a successful retest.
✅ Fresh Upside Move: Momentum picking up—on track to challenge all-time highs.
💡 Strategy & Risk Management
📈 Staggered Entry: Accumulate gradually near support to manage risk effectively.
🔒 Strict SL: Maintain a disciplined stop loss at ₹652 to protect capital.
📍 Outlook: Elecon is well-positioned for a fresh rally with strong technical structure and volume support.
📉 Disclaimer: Not SEBI-registered. Please conduct your own research or consult a financial advisor before investing.
#EleconEngineering #BreakoutStocks #TechnicalAnalysis #RoundingBottom #SwingTrading #StockMarketIndia #InvestSmart

ARB — 4H Supply Break & Trend Reversal1. Watch for confirmed trendline break
2. Retest & hold above 0.3275 for entry
3. TP1: 0.345–0.35 / TP2: 0.38 / TP3: 0.41
4. If fails, watch demand zones below
