UCAD Gets Ready To Serve A "Cup" This Morning!Price on OANDA:USDCAD has made a impressive rally up and based on the parameters, has completed what looks to be the "Bowl" of a popular Reversal Pattern, the Cup and Handle!
Now, since price has pushed above the Confirmation of Pattern @ 1.38056, we should expect price to make a retracement down to no lower than the 50% Fibonacci level @ 1.37289 to create the "Handle" or Higher Low, suggesting Bulls are reversing price.
Long Opportunities will be generated when:
1) Price is supported on the retracement at the 50% level
2) Once Price Breaks and Retests the completion of the pattern altogether
When price completes the pattern, I'll be looking for price to head to the next Resistance level around 1.39575 - 1.39774.
Reversalpatterns

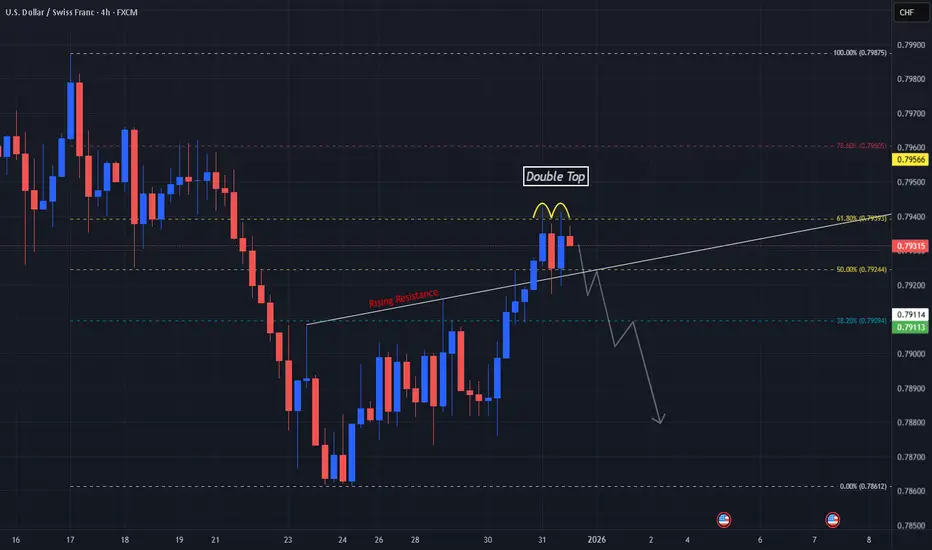
Potential Double Top @ Golden Ratio On USDCHFBefore the New Year, price on OANDA:USDCHF may have formed a strong reversal at a very vital level!
Since the Low @ .78612, price has made a retracement to the High @ .79875 and seems to have found some resistance at the Golden Ratio Level, 61.8% @ .79393.
In prices second attempt to break this level, we see it is again rejected down before markets closed for New Years.
If price breaks back below the 50% level @ .794244 where the Low of the Double Top sits, this will confirm the reversal pattern and generate Short Opportunities!
The Sun May Be Setting On EJ's Break of HighsOANDA:EURJPY has made an impressive Bullish Rally after breaking out of the Resistance that was holding price down around 183 - 183.1, but currently seems to be showing a great deal of exhaustion with a strong Bearish Reversal pattern forming, the Evening Doji Star!
The Evening Doji Star consists of 3 candlesticks:
1) Large Bullish Candle
2) Doji Candle
3) Large Bearish Candle
If Bears are able to Close this candle strong down at the Lows of the large Bullish Candle that started the pattern, this will be great Confirmation of the pattern and we can expect that price will continue to push down!
The next level of structure expected to be visited will be the Previous Resistance at the 183 - 183.1 level.

Double Top Formed After 88.6% Retracement on AJHere on the Hourly chart, OANDA:AUDJPY has formed a Bearish Reversal Pattern, the Double Top.
Price attempted to make a Higher High but was cut short by the 88.6% Fibonacci level where we now see price dropped back down to the Confirmation or "Neckline" of the Pattern @ 103.836.
Once the Confirmation is broken, this will generate Short Opportunities to take price down to the next Support Level @ 103.344 - 103.198!

Neckline Breaks and Trader Nerves: A Quick Guide to Bearish H&S The head and shoulders pattern is like the market’s way of clearing its throat and saying, “Things might be changing up here.” Once that neckline snaps, traders often sit up straighter — not because something magical happened, but because the chart finally drew a clean line between “maybe” and “now it matters.”
In this ZS (Soybean Futures) example, price slipped under the neckline and started wandering toward lower ground. Traders who work with this pattern usually focus on three things:
A possible bounce back toward the neckline (because markets love second chances),
A clear invalidation level (in this case, above 1136),
A logical downside objective such as the gap-and-support combo near 1070'4.
That simple trio turns a chaotic chart into a calm plan.
Contract specs matter too. The ZS contract moves in bigger bites:
Tick: 1/4 of one cent (0.0025) per bushel = $12.50 per contract
Margin: $2,000 per contract
The MZS (Micro Soybean Futures) contract takes smaller ones:
Tick: 0.0050 per bushel = $2.50 per contract
Margin: $200 per contract
Traders who want more precision sometimes choose the micro so their stop-loss distance and account size stay on speaking terms. Either way, the chart sets the idea, but the contract size sets the comfort level.
And of course, the golden rule in pattern-based trading: the market can still do whatever it wants. That’s why traders define their exit if wrong, their objective if right, and their size before clicking anything. A head and shoulders isn't about predicting — it's about organizing.
The chart example ties it all together: neckline break, resistance overhead, downside target below. Simple, structured, and practical — just the way traders like it.
Want More Depth?
If you’d like to go deeper into the building blocks of trading, check out our From Mystery to Mastery trilogy, three cornerstone articles that complement this one:
🔗 From Mystery to Mastery: Trading Essentials
🔗 From Mystery to Mastery: Futures Explained
🔗 From Mystery to Mastery: Options Explained
When charting futures, the data provided could be delayed. Traders working with the ticker symbols discussed in this idea may prefer to use CME Group real-time data plan on TradingView: www.tradingview.com - This consideration is particularly important for shorter-term traders, whereas it may be less critical for those focused on longer-term trading strategies.
General Disclaimer:
The trade ideas presented herein are solely for illustrative purposes forming a part of a case study intended to demonstrate key principles in risk management within the context of the specific market scenarios discussed. These ideas are not to be interpreted as investment recommendations or financial advice. They do not endorse or promote any specific trading strategies, financial products, or services. The information provided is based on data believed to be reliable; however, its accuracy or completeness cannot be guaranteed. Trading in financial markets involves risks, including the potential loss of principal. Each individual should conduct their own research and consult with professional financial advisors before making any investment decisions. The author or publisher of this content bears no responsibility for any actions taken based on the information provided or for any resultant financial or other losses.

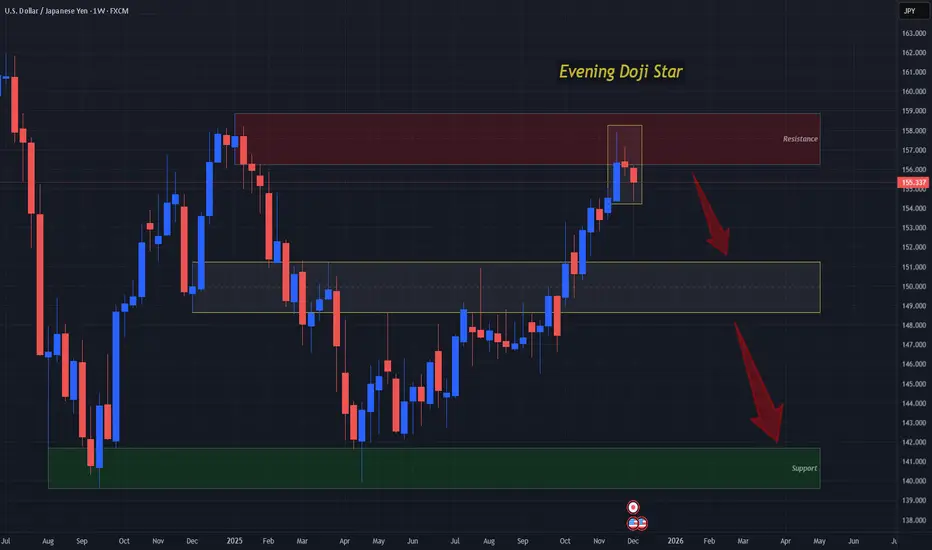
Evening Doji Star Forms at Weekly Resistance on UJAn Evening Doji Star is a Bearish Reversal Candlestick Pattern that consists of 3 Candlesticks:
1) Large Bullish Candle
2) Doji Candle
3) Large Bearish Candle
The Doji Candle represents indecision in the markets where the Bulls nor the Bears were able to overcome one another.
The last candle being a bearish one suggests that the Bears have successfully taken over and are looking to push price down!
This Candlestick Pattern itself is a strong indication that price is looking to reverse from this Resistance Level at 158 - 156 formed at the end of last year/beginning of this year, but what will also add "fuel to the fire" is if the next candle, being the Confirmation Candle of the pattern turns out to be a bearish one!
If so, I am looking for FX:USDJPY to continue this bearish push down in price to the next Area of Value being at 151 - 148 with a stronger Support Level down at the 141 - 139 where price last visited in April this year.
Fundamentally, USD has a heavily news filled week with Sept. and Oct. JOLTS Job Opening being released, Unemployment Claims, ADP Weekly Employment Change and the Federal Reserve with an 86% chance of Cutting Interest Rates on the 10th.
BOJ is set to Hike Interest Rates the following week, and this, fundamentally, could be the catalyst for the Bearish Reversal we see setting up in technical terms on the charts!
XRPUSD should correct before any further leg up
The party could continue but a correction is overdue. We're in a distinct Wave 5 move on the 2hr with several key indicators firing. Overbought on multiple oscillators.
Additionally, profit-taking from recent XRP gains, driven by optimism around partial legal victories, could add selling pressure. If trading volumes drop, it could amplify the downside move, before another (potential) leg up.

Scalping USDCHF -- 10 green candles -> slight correction
One of the easiest reversal moves to anticipate is when anytime the same color candle prints 10+ times in a row. When 9 out of 10 candles in a sequence are green, for example, you'll often see a slight correction, perfect for a scalp.
This is what we're seeing here on USDCHF, pointed out by Rev10 indicator. The SMA 200 was also in a downtrend, reinforcing our confidence in a quick short.
Short 0.88489
TP 0.88399 for potential $762.88
750k units

SPY due for a pullback -- EV3 and Treverse phenom on 8h
The SPY is due for a pullback. It’s been overextended after a strong rally, with key indicators like RSI showing overbought conditions. Currently in a W5 leg, we're waiting on EV3 or Treverse to fire, as these RevAlerts indicators have shown an excellent track record, as seen on the 8h chart.
Additionally, economic uncertainty, rising bond yields, and/or upcoming Fed decisions could trigger profit-taking. Traders know markets rarely move in a straight line, and healthy pullbacks often follow extended runs. Let's see what the week brings!

Buyback Watch for Swing TradingEarnings are over so buybacks are back in the mix. The market is likely to continue to be volatile and choppy until all the ETF investors who want to sell have done so. Then, the uptrend is likely to resume because there are not enough barometers warning of a recession AND we just had one 3 years ago.
Buybacks tend to drive price up, so they are a good swing and momentum trading strategy. Notice how neatly the support from previous highs halted the run down. Reversal points at strong support levels are one area to watch for buyback patterns.

XAUUSD | GOLDSPOT | New perspective | follow-up detailsGold closed last week with a modest 0.59% gain, after touching an all-time high of $2,431. Geopolitical tensions spurred demand for safe-haven assets, pushing gold to its new peak before a pullback due to a strengthening US Dollar.
The release of US inflation data midweek introduced volatility in gold prices. Following the Consumer Price Index (CPI) report, the price dipped to $2,320. However, this downturn was brief as inflation pressures eased, influenced by a lower-than-expected Producer Price Index (PPI) report.
Comments from Federal Reserve officials, including Boston Fed President Susan Collins, Chicago Fed President Austan Goolsbee, and Kansas City Fed’s Jeffrey Schmid, tempered expectations of rate cuts.
Given the recent attacks on Israel by Iranian military forces, this video will illustrate the technical implications on the chart and how to position ourselves for the market’s next moves.
XAUUSD Technical Overview:
In this video, we conducted a comprehensive analysis of the XAUUSD chart, utilizing both technical and fundamental perspectives. Our examination included an in-depth study of key levels, historical price movements, market behaviours, and the interplay between buyers and sellers, aiming to unveil potential trading opportunities.
Our focal point for the week is the $2,335 zone, endowed with historical significance, rendering it a pivotal level for next week's trading activity. The sustainability of bullish momentum above this zone could pave the way for continued buying pressure, potentially propelling prices to new highs. Conversely, the appearance of a breach below the $2,335 level, coupled with persistent selling pressure, might signal a resurgence of bearish sentiment.
#GoldMarket #SafeHavenAssets 📺🔔💼
Disclaimer Notice:
Please be aware that margin trading in the foreign exchange market, including commodity trading, CFDs, stocks, and other instruments, carries a high level of risk and may not be suitable for all investors. The content of this speculative material, including all data, is provided by me for educational purposes only and to assist in making independent investment decisions. All information presented here is for reference purposes only, and I do not assume any responsibility for its accuracy.
It is important that you carefully evaluate your investment experience, financial situation, investment objectives, and risk tolerance level. Before making any investment, it is advisable to consult with your independent financial advisor to assess the suitability of your circumstances.
Please note that I cannot guarantee the accuracy of the information provided, and I am not liable for any loss or damage that may directly or indirectly result from the content or the receipt of any instructions or notifications associated with it.
Remember that past performance is not necessarily indicative of future results. Keep this in mind while considering any investment opportunities.

XAU/USD | GOLDSPOT | New perspective | follow-up detailsGold closed last week deeply entrenched in negative territory, facing strong headwinds from a resilient US Dollar (USD) which hindered XAU/USD from capitalizing on declining bond yields. The Federal Reserve's March meeting highlighted the urgency for policymakers to consider interest rate reductions, despite recent inflation reports suggesting a potential reacceleration. This initially propelled XAU/USD to reach new all-time highs, albeit briefly.
Presently, the US economy exhibits signs of resilience, with the Federal Open Market Committee (FOMC) projecting a growth rate of 2.1% for 2024, up from the previous estimate of 1.4%, while maintaining the Unemployment Rate at 4%. Attention now turns to inflation metrics, particularly the Personal Consumption Expenditures (PCE) index, favored by the Fed, which is anticipated to reach 2.4%, with core PCE projected at 2.6%, an increase from 2.4%.
As we prepare for the upcoming week, this video serves as a guide to navigating the current market dynamics, offering insights into potential strategies amid these shifting economic conditions.
XAUUSD Technical Overview:
In this video, we conducted a comprehensive analysis of the XAUUSD chart, utilizing both technical and fundamental perspectives. Our examination included an in-depth study of key levels, historical price movements, market behaviours, and the interplay between buyers and sellers, aiming to unveil potential trading opportunities.
Our focal point for the week is the $2,145 zone, endowed with historical significance, rendering it a pivotal level. The sustainability of bullish momentum above this zone could pave the way for continued buying pressure, potentially propelling prices to new highs. Conversely, the appearance of a reversal pattern or a breach below the $2,145 level, coupled with persistent selling pressure, might signal a resurgence of bearish sentiment.
#GoldMarket #SafeHavenAssets 📺🔔💼
Disclaimer Notice:
Please be aware that margin trading in the foreign exchange market, including commodity trading, CFDs, stocks, and other instruments, carries a high level of risk and may not be suitable for all investors. The content of this speculative material, including all data, is provided by me for educational purposes only and to assist in making independent investment decisions. All information presented here is for reference purposes only, and I do not assume any responsibility for its accuracy.
It is important that you carefully evaluate your investment experience, financial situation, investment objectives, and risk tolerance level. Before making any investment, it is advisable to consult with your independent financial advisor to assess the suitability of your circumstances.
Please note that I cannot guarantee the accuracy of the information provided, and I am not liable for any loss or damage that may directly or indirectly result from the content or the receipt of any instructions or notifications associated with it.
Remember that past performance is not necessarily indicative of future results. Keep this in mind while considering any investment opportunities.

USDJPY | Perspective for the new week | Follow-upExplore the unfolding story of USDJPY in our latest technical analysis! Japan's Current Account growth fell short of expectations, printing at ¥1,925.6 billion in November. Despite markets anticipating ¥2,385.1 billion, the actual figure raised concerns. With expectations of the BoJ maintaining its ultra-dovish stance, we analyze how this might impact the JPY's upside potential.
The upcoming week brings Japan's Producer Price Index (PPI) figures for December, adding a layer of anticipation. Meanwhile, across the Pacific, the US Producer Price Index for final demand dipped 0.1% in the last month. This decline, coupled with service prices remaining unchanged, has heightened expectations of lower inflation in the future. Traders are now factoring in a 79% chance of a March rate cut, up from 73% on Thursday, according to the CME Group's FedWatch Tool.
USDJPY Technical Analysis:
As highlighted in the video, the recent upward pressure is beginning to ease, and the odds of USD pulling back further still exist. However, only persistent trading above 144.800 will validate an uptrend continuation. In this video, we conducted an in-depth technical analysis of the USDJPY chart, carefully examining the current bullish market structure. Our primary focus is within the key zone of 144.000/144.800, which will serve as our center of focus ahead of the upcoming week. The key level becomes an area of interest as continued buying pressure above this zone could incite a clear uptrend. The market's reaction around this area at the beginning of the new week will heavily influence the trajectory of price action in the days to come.
Join me on this journey as we explore potential trading opportunities using trendlines, key levels, and chart patterns. Be sure to stay connected to my channel, follow my updates, and actively engage in the comment section as we navigate the dynamic USDJPY market together.
Wishing you the best of luck as you chart your course in the USDJPY market this week.
#USDJPY #technicalanalysis #tradingopportunities #inflation #monetarypolicy #Fed #interestrates #economicanalysis #Forextrading
Disclaimer Notice:
Please be aware that margin trading in the foreign exchange market, including commodity trading, CFDs, stocks, and other instruments, carries a high level of risk and may not be suitable for all investors. The content of this speculative material, including all data, is provided by me for educational purposes only and to assist in making independent investment decisions. All information presented here is for reference purposes only, and I do not assume any responsibility for its accuracy.
It is important that you carefully evaluate your investment experience, financial situation, investment objectives, and risk tolerance level. Before making any investment, it is advisable to consult with your independent financial advisor to assess the suitability of your circumstances.
Please note that I cannot guarantee the accuracy of the information provided, and I am not liable for any loss or damage that may directly or indirectly result from the content or the receipt of any instructions or notifications associated with it.
Remember that past performance is not necessarily indicative of future results. Keep this in mind while considering any investment opportunities.

Cup & Handle - EUHere I have EUR/USD on the 4Hr Chart!
Price has outlined what looks to be a Possible Cup & Handle Pattern with the Low @ 1.07238 being the bottom of the "Cup" followed by an IMMEDIATE reversal to the High @ 1.10089!
Now price is creating what should be the "Handle" where then price should go BULLISH breaking the Top of the Cup CONFIRMING the Pattern!
*If Price Breaks Down below my ENTRY ZONE, Pattern Set-up is INVALIDATED!
Fundamentally this week:
EUR - Core CPI (Tue)
USD - Building Permits (Tue) Consumer Confidence/Home Sales (Wed) Final GDP/Unemployment (Thur) Core PCE/ Durable Goods/ UoM Consumer Sentiment/ New Home Sales (Fri)
*TRADING INVOLVES RISK! DO NOT TRADE WHAT YOU DO NOT UNDERSTAND OR HAVE NOT TESTED BEFORE! THIS IS NOT TRADING ADVICE. EDUCTIONAL PURPOSES ONLY!*
-BUY-
{ SL } 1.08330
{ ENTRY } 1.09002 - 1.08834
{ TP } TBD

GBPUSD | Perspective for the new week | Follow-upDespite a slight dip on Friday, the GBPUSD charts remain poised for potential new highs. The aftermath of the U.S. Federal Reserve's dovish pivot faced resistance from New York Federal Reserve President John Williams, moderating rate cut expectations and emphasizing the central bank's commitment to tackling inflation.
In this dynamic landscape, both the Bank of England (BoE) and the Federal Reserve (Fed) maintained unchanged rates but conveyed distinct messages. BoE Governor Andrew Bailey struck a hawkish tone, highlighting that there's "still some way to go" in their inflation battle. In contrast, Fed Chair Jerome Powell hinted at sufficiently restrictive monetary policy, introducing discussions about rate cuts, a notion later tempered by New York Fed President John Williams, deeming March rate cut talks as "premature."
On the UK front, December witnessed an overall improvement in business activity, barring manufacturing, which lingered in recessionary territory since July 2022.
As we gear up for the upcoming week, the UK's economic docket will unveil crucial inflation figures and retail sales. Simultaneously, across the pond, the week kicks off with housing data and consumer confidence until Wednesday, followed by the final GDP print, unemployment claims, Durable Goods Orders, and consumer sentiment from Thursday onwards.
Given these developments, how should we approach the week ahead from a technical standpoint?
GBPUSD Technical Analysis:
Will the pound continue its trajectory and sustain its momentum above the $1.26000 zone? The stakes are high, and we're on the edge of our seats!
The spotlight is on high-impact economic events from both the US docket for clues. Brace yourselves as the anticipation and the actual events may trigger sharp price movements that could present incredible trading opportunities.
In this video, we've analyzed the Daily and 4-hour timeframes, exploring bullish and bearish sentiments to uncover the most promising trades for the week ahead. We've delved into key levels, trendlines, and support/resistance points, unveiling essential insights into the current market structure.
We are keeping a close eye on the potential range between $1.27350 and $1.26000 where a consolidation could happen before the next BIG move. It's a decisive structure where both sellers and buyers will be vying for control, and how the market reacts here will set the course for GBPUSD in the upcoming days.
Stay connected and join the conversation in the comment section to stay updated on the latest developments. Thank you for tuning in, and get ready for more enlightening insights into GBPUSD in our upcoming content. Buckle up for a thrilling journey ahead! Happy trading!
Disclaimer Notice:
Please be aware that margin trading in the foreign exchange market, including commodity trading, CFDs, stocks, and other instruments, carries a high level of risk and may not be suitable for all investors. The content of this speculative material, including all data, is provided by me for educational purposes only and to assist in making independent investment decisions. All information presented here is for reference purposes only, and I do not assume any responsibility for its accuracy.
It is important that you carefully evaluate your investment experience, financial situation, investment objectives, and risk tolerance level. Before making any investment, it is advisable to consult with your independent financial advisor to assess the suitability of your circumstances.
Please note that I cannot guarantee the accuracy of the information provided, and I am not liable for any loss or damage that may directly or indirectly result from the content or the receipt of any instructions or notifications associated with it.
Remember that past performance is not necessarily indicative of future results. Keep this in mind while considering any investment opportunities.

XAUUSD | GOLDSPOT | New perspective | follow-up detailsOn Thursday, Fed Chair Jerome Powell joined his teammates in endorsing a stable interest rate policy, providing further support for the XAUUSD. Amidst increasing geopolitical risks, with the conflict between Israel and Hamas spreading to more countries in the region, Gold extended its weekly rally and reached the $1,990 area for the first time in five months on Friday. This surge in Gold prices is driven by safe-haven flows as investors seek to reduce risk exposure, combined with a downward correction in US yields.
Additionally, Atlanta Fed President Raphael Bostic has indicated the possibility of a rate cut in 2024, suggesting a potential shift in monetary policy if economic conditions warrant it. Cleveland Fed President Loretta Mester has also expressed that the Federal Reserve may be at or near the peak of its rate hike cycle, emphasizing that the central bank will closely depend on incoming data for its decision-making process in the next monetary policy meeting.
As we look ahead, this week's economic calendar will feature key events such as US flash PMI data, the release of Q3 Gross Domestic Product (GDP) on its preliminary reading, Durable Goods Orders, unemployment claims, and the Fed's preferred gauge for inflation, the core PCE.
XAUUSD Technical Analysis:
In this video, we dissected the XAUUSD chart from a technical standpoint, analyzed the key levels, analyzed historical price moves, market behaviors, and buyer-seller dynamics, and uncovered potential trading opportunities.
The $1,985 zone will remain our center stage for this week. Its historical significance makes it a crucial point. If the bullish momentum is sustained then the breakout of the $1,985 will serve as a platform for new highs. However, if selling pressure persists below $1,985 just as it had done in the last 5 months $1,900 we could witness renewed selling pressure back into the demand zone at the $1,900 zone.
Stay tuned for more thrilling updates on the Gold market! Hit the like button if you found this analysis helpful, and don't forget to subscribe for more insightful content! 📺🔔💼
Disclaimer Notice:
Please be aware that margin trading in the foreign exchange market, including commodity trading, CFDs, stocks, and other instruments, carries a high level of risk and may not be suitable for all investors. The content of this speculative material, including all data, is provided by me for educational purposes only and to assist in making independent investment decisions. All information presented here is for reference purposes only, and I do not assume any responsibility for its accuracy.
It is important that you carefully evaluate your investment experience, financial situation, investment objectives, and risk tolerance level. Before making any investment, it is advisable to consult with your independent financial advisor to assess the suitability of your circumstances.
Please note that I cannot guarantee the accuracy of the information provided, and I am not liable for any loss or damage that may directly or indirectly result from the content or the receipt of any instructions or notifications associated with it.
Remember that past performance is not necessarily indicative of future results. Keep this in mind while considering any investment opportunities.

XAUUSD | GOLDSPOT | New perspective | follow-up detailsWith increasing geopolitical tensions in the Middle East, having Gold in your portfolio can serve as a perfect hedge against international turmoil. As investors closely monitor events in Israel, any increase in geopolitical risk is certain to trigger panic demand for safe-haven buying in gold. Our analysis indicates that the rally is likely to reach $1930 in a quick chase.
Last Friday, buying pressure built up within the $1,810 zone after markets reacted positively to the US Non-Farm Payrolls report. The report handily beat the street, printing at a forecast-clobbering 336K against the anticipated 170K, and the previous figure was also revised higher to 227K from 187K. As a result, market sentiment has turned firmly bullish, taking XAUUSD back up the charts after most of the week saw spot Gold prices firmly on the low end.
XAUUSD Technical Analysis:
In this video, we dissected the XAUUSD chart from a technical standpoint, analyzed the key levels, analyzed historical price moves, market behaviors, and buyer-seller dynamics, and uncovered potential trading opportunities.
The $1,810 and $1,830 zones will remain our center stage for this week. Its historical significance makes it a crucial point. If the bearish momentum is sustained then the breakdown of the $1,810 and the support line on the 4H timeframe could incite a strong downtrend continuation. However, for a sustained recovery the asset has to recapture the crucial $1,830.00.
Stay tuned for more thrilling updates on the Gold market! Remember, trading involves risks, and I always recommend exercising caution and seeking advice from financial professionals. Hit the like button if you found this analysis helpful, and don't forget to subscribe for more insightful content! 📺🔔💼
Disclaimer Notice:
Please be aware that margin trading in the foreign exchange market, including commodity trading, CFDs, stocks, and other instruments, carries a high level of risk and may not be suitable for all investors. The content of this speculative material, including all data, is provided by me for educational purposes only and to assist in making independent investment decisions. All information presented here is for reference purposes only, and I do not assume any responsibility for its accuracy.
It is important that you carefully evaluate your investment experience, financial situation, investment objectives, and risk tolerance level. Before making any investment, it is advisable to consult with your independent financial advisor to assess the suitability of your circumstances.
Please note that I cannot guarantee the accuracy of the information provided, and I am not liable for any loss or damage that may directly or indirectly result from the content or the receipt of any instructions or notifications associated with it.
Remember that past performance is not necessarily indicative of future results. Keep this in mind while considering any investment opportunities.

XAUUSD | GOLDSPOT | New perspective | follow-up detailsIn the latest twist of events, gold prices have experienced a significant downturn, marking the second consecutive quarterly decline. This decline, which initiated in August and persisted through September, reached a pinnacle this week, marking the most substantial drop in over two years.
What's particularly noteworthy is gold's relinquishment of its stronghold on the crucial bullish threshold of $1,900 an ounce, a level it had firmly maintained since mid-August. This strategic shift occurred as investors sought refuge in the dollar, deeming it a safer haven, especially given the relatively robust performance of the U.S. economy in comparison to the global landscape.
The U.S. economic growth, standing at 2.1% year-on-year in the second quarter (following 2.2% in the first quarter), underscores this strength. Projections indicate a consistent 2.1% expansion for the entirety of 2023. While factors such as inflation, the labor market, and consumer spending have contributed to this stability, concerns loom over factory activity due to a bleak demand outlook.
To gain further insights into the state of the factory sector, all eyes are on the Manufacturing PMI report for September, set to be released on Monday. This report is anticipated to provide crucial clues about the current health of the manufacturing industry, influencing the market sentiment significantly.
In terms of gold prices, there's a glimmer of hope as the asset found interim support after hitting a fresh six-month low at $1,847.00. The recent five-day losing streak appears to have paused, yet for a sustainable recovery, gold must reclaim the pivotal $1,900.00 mark. Despite this temporary reprieve, the overarching trend remains bearish.
XAUUSD Technical Analysis:
In this video, we dissected the XAUUSD chart from a technical standpoint, analyzed the key levels, analyzed historical price moves, market behaviors, and buyer-seller dynamics and uncovered potential trading opportunities.
The $1,847 and $1,885 zone will remain our center stage for this week. Its historical significance makes it a crucial point. If the bearish momentum is sustained then the breakdown of the $1,847 and the support line of the descending channel on the 4H timeframe could incite a strong downtrend continuation. However, for a sustained recovery the asset has to recapture the crucial $1,900.00.
Stay tuned for more thrilling updates on the Gold market! Remember, trading involves risks, and I always recommend exercising caution and seeking advice from financial professionals. Hit the like button if you found this analysis helpful, and don't forget to subscribe for more insightful content! 📺🔔💼
Disclaimer Notice:
Please be aware that margin trading in the foreign exchange market, including commodity trading, CFDs, stocks, and other instruments, carries a high level of risk and may not be suitable for all investors. The content of this speculative material, including all data, is provided by me for educational purposes only and to assist in making independent investment decisions. All information presented here is for reference purposes only, and I do not assume any responsibility for its accuracy.
It is important that you carefully evaluate your investment experience, financial situation, investment objectives, and risk tolerance level. Before making any investment, it is advisable to consult with your independent financial advisor to assess the suitability of your circumstances.
Please note that I cannot guarantee the accuracy of the information provided, and I am not liable for any loss or damage that may directly or indirectly result from the content or the receipt of any instructions or notifications associated with it.
Remember that past performance is not necessarily indicative of future results. Keep this in mind while considering any investment opportunities.

XAUUSD | GOLDSPOT | New perspective | follow-up detailsGold's recent performance faced an unexpected twist, challenging the notion that a Fed rate pause could be its ticket to a breakout. Instead, the precious metal found itself in the shadow of its formidable rival, the US dollar.
The preceding week had seen gold bask in the glory of the US non-farm payrolls report for August. Despite an employment gain of 187,000 jobs, surpassing the forecasted 170,000, the unemployment rate inched up from July's 3.5% to 3.8%. This unexpected rise fueled speculation that the upcoming Fed meeting on Sept. 20 might result in unchanged interest rates, briefly propelling gold higher.
However, as the week unfolded, a new narrative emerged. Speculation resurfaced, suggesting that the Fed might consider not just a pause but potentially more rate hikes before year-end to achieve its 2% annual inflation target. Inflation, as measured by the Consumer Price Index (CPI), rekindled in July, surging to 3.2%. These mounting concerns prompted the Dollar Index to soar to six-month highs.
Now, the burning question is: What lies ahead for the Gold market in the coming week? Join us as we unravel the intricacies and potential scenarios in this ever-evolving landscape.
XAUUSD Technical Analysis:
In this video, we delve into XAUUSD from a price action-based technical analysis standpoint. By analyzing historical price moves, market behaviors, and buyer-seller dynamics, we extract insightful cues.
The $1,915 zone will take center stage for this week. Its historical significance makes it a crucial point. If the bullish momentum is sustained then the breakout of the uptrend continuation pattern - falling wedge identified on the daily timeframe could incite a strong uptrend continuation. However, if the price breaks below both the ascending trendline and the $1,915 zone then some selling opportunities could take center stage to trigger a USD-favored sell-off.
Stay tuned for more thrilling updates on the Gold market! Remember, trading involves risks, and I always recommend exercising caution and seeking advice from financial professionals. Hit the like button if you found this analysis helpful, and don't forget to subscribe for more insightful content! 📺🔔💼
Disclaimer Notice:
Please be aware that margin trading in the foreign exchange market, including commodity trading, CFDs, stocks, and other instruments, carries a high level of risk and may not be suitable for all investors. The content of this speculative material, including all data, is provided by me for educational purposes only and to assist in making independent investment decisions. All information presented here is for reference purposes only, and I do not assume any responsibility for its accuracy.
It is important that you carefully evaluate your investment experience, financial situation, investment objectives, and risk tolerance level. Before making any investment, it is advisable to consult with your independent financial advisor to assess the suitability of your circumstances.
Please note that I cannot guarantee the accuracy of the information provided, and I am not liable for any loss or damage that may directly or indirectly result from the content or the receipt of any instructions or notifications associated with it.
Remember that past performance is not necessarily indicative of future results. Keep this in mind while considering any investment opportunities.

GBPUSD | Perspective for the new week | Follow-upWelcome, traders, to another exciting episode of my weekly price action-based technical analysis series, dedicated to unraveling the intricacies of the GBPUSD market.
The Bank of England (BoE) gears up for its 15th consecutive interest rate hike on September 21st. Join us as we dissect the implications of this development on price action!
August witnessed a notable surge in the British public's expectations for medium to long-term inflation. The BoE, confronting the highest inflation rate among leading global economies, has set the stage for yet another rate hike. However, the anticipation has stirred a cauldron of mixed reactions. Recent surveys have hinted at a softening outlook for inflation, further fueled by Governor Andrew Bailey's remark that the rate peak is now 'much nearer.'
Throughout the second half of the previous week, the pound oscillated just above a three-month low, eventually finding equilibrium around the $1.24500 territory as the week drew to a close. The brewing uncertainties, coupled with signs of a jobs market slowdown in Britain and an impressive dollar rally, have driven the pound to a 5% decline against the U.S. dollar since mid-July.
With the BoE's next interest rate decision looming on September 21st, traders are keeping a close watch. Derivatives markets indicate a 73% probability of a 25 bps rate hike, while a 27% chance exists that rates will remain steady at the current 5.25% level.
How will these prevailing sentiments sculpt the terrain of this market in the week ahead?
GBPUSD Technical Analysis:
Will the pound find solid support at the $1.24500 zone, or are we heading towards a potential breakdown and a possible sell-off? The stakes are high, and we're on the edge of our seats!
The spotlight is on high-impact economic events from both the UK and US dockets for clues. Brace yourselves as the anticipation and the actual events may trigger sharp price movements that could present incredible trading opportunities.
In this video, we've analyzed the Daily and 4-hour timeframes, exploring bullish and bearish sentiments to uncover the most promising trades for the week ahead. We've delved into key levels, trendlines, and support/resistance points, unveiling essential insights into the current market structure.
Keep a close eye on that critical confluence at $1.24500. It's a decisive moment where both sellers and buyers are vying for control, and how the market reacts here will set the course for GBPUSD in the upcoming days.
Stay connected and join the conversation in the comment section to stay updated on the latest developments. Thank you for tuning in, and get ready for more enlightening insights into GBPUSD in our upcoming content. Buckle up for a thrilling journey ahead! Happy trading!
Disclaimer:
Trading on margin in the foreign exchange market (including commodities, CFDs, stocks, etc.) carries a high level of risk and may not be suitable for all investors. The content of this speculation (including all data) is provided by me for educational and informational purposes only to assist in making independent investment decisions. All information presented here is for reference purposes only, and I do not accept any responsibility for its accuracy.
It is important that you carefully consider your investment experience, financial situation, investment objectives, and risk tolerance level, and seek advice from an independent financial advisor to assess the suitability of your situation before making any investment.
I do not guarantee the accuracy of the information provided and shall not be held liable for any loss or damage that may arise directly or indirectly from the content or the receipt of any instructions or notifications related to it.
Please note that past performance is not necessarily indicative of future results

USDJPY | Perspective for the new week | Follow-upIn a fresh turn of events, USDJPY surged to new intraday highs on Friday, but the question remains: Can it sustain its four-week uptrend? Meanwhile, Japan's economic output hit levels above full capacity in April-June for the first time in nearly four years, raising questions about the possibility of a shift in ultra-low interest rate policy.
Adding to the intrigue, Japan’s Finance Minister, Shunichi Suzuki, weighed in on Friday, emphasizing the undesirability of sudden FX movements and asserting that Forex rates should be influenced by market conditions and fundamental factors.
On the flip side, wage growth in the U.S. is showing signs of slowing down, adding a layer of complexity to the job market. These mixed signals are fueling uncertainty about the Federal Reserve's forthcoming interest-rate decision, scheduled for September 20th. Fed Chair Jerome Powell's recent remarks at the Jackson Hole Symposium underscored the importance of incoming data, particularly in the context of the evolving relationship between inflation and employment.
So, as we look ahead, what does the coming week hold in store for USDJPY?
USDJPY Technical Analysis:
In this video, we conducted an in-depth technical analysis of the USDJPY chart, carefully examining the current market structure which is evidently bullish. Our primary focus is still within the key zone of 144. 600 and 146.600 zone, which will serve as our center of focus ahead of the upcoming week. As price action remains within this zone, it becomes an area of interest that has led to choppy consolidation before a clear direction emerges. The market's reaction around this area at the beginning of the new week will heavily influence the trajectory of price action in the days to come.
Join me on this journey as we explore potential trading opportunities using trendlines, key levels, and chart patterns. Be sure to stay connected to my channel, follow my updates, and actively engage in the comment section as we navigate the dynamic USDJPY market together.
Wishing you the best of luck as you chart your course in the USDJPY market this week.
#USDJPY #technicalanalysis #tradingopportunities #inflation #monetarypolicy #Fed #interestrates #economicanalysis #Forextrading
Disclaimer Notice:
Please be aware that margin trading in the foreign exchange market, including commodity trading, CFDs, stocks, and other instruments, carries a high level of risk and may not be suitable for all investors. The content of this speculative material, including all data, is provided by me for educational purposes only and to assist in making independent investment decisions. All information presented here is for reference purposes only, and I do not assume any responsibility for its accuracy.
It is important that you carefully evaluate your investment experience, financial situation, investment objectives, and risk tolerance level. Before making any investment, it is advisable to consult with your independent financial advisor to assess the suitability of your circumstances.
Please note that I cannot guarantee the accuracy of the information provided, and I am not liable for any loss or damage that may directly or indirectly result from the content or the receipt of any instructions or notifications associated with it.
Remember that past performance is not necessarily indicative of future results. Keep this in mind while considering any investment opportunities.

GBPUSD | Perspective for the new week | Follow-upExplore the GBPUSD landscape as it maintains its optimistic stance above $1.2710 market, driven by robust UK inflation data. The Pound Sterling gains strength from this report and the potential for further interest rate adjustments by the Bank of England (BoE).
With core CPI data raising inflation concerns within the UK economy, the BoE might opt for more interest rate hikes, adding more fuel to the fire of the Pound Sterling's rise. The stage is set for the GBPUSD pair to reap the benefits of this pivotal scenario.
Across the Atlantic, declining US unemployment claims for the week ending August 12 underscore the tightness of the labor market, potentially paving the way for another Federal Reserve (Fed) interest rate rise. Fresh FOMC Minutes emphasized the challenge of high inflation and the need for possible monetary policy tightening.
In the upcoming week, eyes will turn to key macroeconomic events from both economies, including the Jackson Hole Symposium and PMI data releases from the UK and US. These data points will shape market sentiment and drive opportunities for the GBPUSD pair.
GBPUSD Technical Analysis:
Will the pound find solid support at the $1.27000/$1.26700 zone, or are we heading towards a potential breakdown and a possible sell-off? The stakes are high, and we're on the edge of our seats!
The spotlight is on high-impact economic events from both the UK and US dockets for clues. Brace yourselves as the anticipation and the actual events may trigger sharp price movements that could present incredible trading opportunities.
In this video, we've analyzed the Daily and 4-hour timeframes, exploring bullish and bearish sentiments to uncover the most promising trades for the week ahead. We've delved into key levels, trendlines, and support/resistance points, unveiling essential insights into the current market structure.
Keep a close eye on that critical confluence at $1.27000, where an ascending trendline intersects in the Daily timeframe. It's a decisive moment where both sellers and buyers are vying for control, and how the market reacts here will set the course for GBPUSD in the upcoming days.
Stay connected and join the conversation in the comment section to stay updated on the latest developments. Thank you for tuning in, and get ready for more enlightening insights into GBPUSD in our upcoming content. Buckle up for a thrilling journey ahead! Happy trading!
Disclaimer:
Trading on margin in the foreign exchange market (including commodities, CFDs, stocks, etc.) carries a high level of risk and may not be suitable for all investors. The content of this speculation (including all data) is provided by me for educational and informational purposes only to assist in making independent investment decisions. All information presented here is for reference purposes only, and I do not accept any responsibility for its accuracy.
It is important that you carefully consider your investment experience, financial situation, investment objectives, and risk tolerance level, and seek advice from an independent financial advisor to assess the suitability of your situation before making any investment.
I do not guarantee the accuracy of the information provided and shall not be held liable for any loss or damage that may arise directly or indirectly from the content or the receipt of any instructions or notifications related to it.
Please note that past performance is not necessarily indicative of future results

XAUUSD | Price Action | New Week perspective | follow-up detailsWelcome back to another episode where we dive deep into the dynamic world of Gold. The bulls' recent positive traction lifted Gold's price on Friday; Breaking a four-day losing streak, it surged from its lowest point since March, hovering above the pivotal $1,885 zone.
Adding to the intrigue, the US macro data paints a portrait of an exceptionally resilient economy, lending strength to the Federal Reserve's hawkish stance. This fortifies the US Dollar (USD), holding it near its peak for over two months, thus constraining Gold's ascent.
Beyond these nuances, traders exhibit a certain caution, likely opting to wait on the sidelines as the momentous Jackson Hole Symposium looms on the horizon next week. Brace yourselves for market volatility as central bankers' comments wield their influence. As the anticipation builds, US bond yields emerge as the juggernauts shaping USD dynamics in the absence of significant domestic economic data.
The broader risk sentiment becomes a compass that will be guiding our trading decision toward short-term opportunities.
Stay tuned as we navigate through the intricate tapestry of Gold's journey, dissecting trends, patterns, and possibilities.
XAUUSD Technical Analysis:
In this video, we delve into XAUUSD's price action, decoding accumulation, and distribution patterns. By analyzing historical price moves, market behaviors, and buyer-seller dynamics, we extract insightful cues. The strategic approach? Waiting for compelling follow-through buying signals to confirm a potential near-term bottom for the USD-linked Gold before diving into bullish ventures.
The $1,895 and $1,885 zones take center stage. Its historical significance makes it a crucial point. If the reversal set-up sustains and the price breaks out both the descending trendline and the $1,895 level, a bullish week could unfold. However, the breakdown of the $1,895 level can trigger a USD-favored sell-off.
Stay tuned for more thrilling updates on the Gold market! Remember, trading involves risks, and I always recommend exercising caution and seeking advice from financial professionals. Hit the like button if you found this analysis helpful, and don't forget to subscribe for more insightful content! 📺🔔💼
Disclaimer Notice:
Please be aware that margin trading in the foreign exchange market, including commodity trading, CFDs, stocks, and other instruments, carries a high level of risk and may not be suitable for all investors. The content of this speculative material, including all data, is provided by me for educational purposes only and to assist in making independent investment decisions. All information presented here is for reference purposes only, and I do not assume any responsibility for its accuracy.
It is important that you carefully evaluate your investment experience, financial situation, investment objectives, and risk tolerance level. Before making any investment, it is advisable to consult with your independent financial advisor to assess the suitability of your circumstances.
Please note that I cannot guarantee the accuracy of the information provided, and I am not liable for any loss or damage that may directly or indirectly result from the content or the receipt of any instructions or notifications associated with it.
Remember that past performance is not necessarily indicative of future results. Keep this in mind while considering any investment opportunities.
