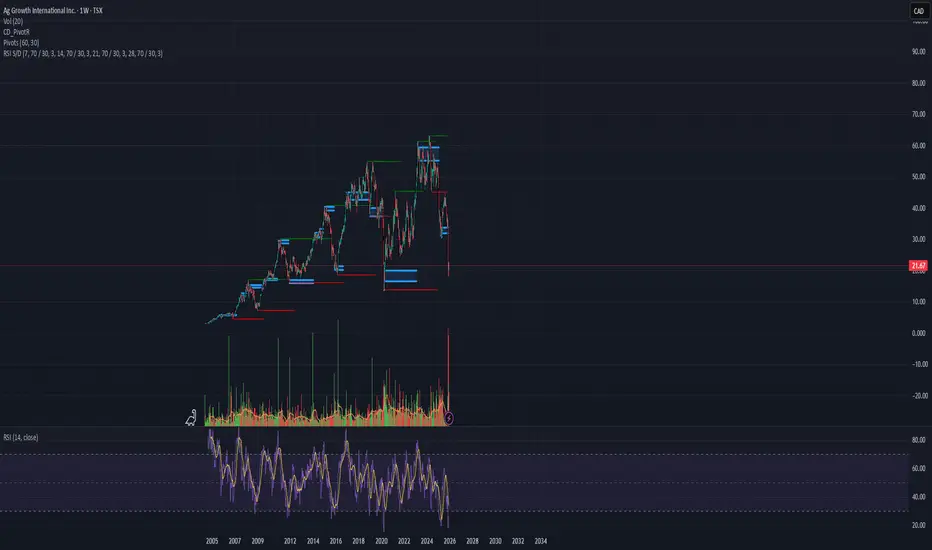
Weekly Trading Idea | AFN.AG 21.67 | Fast 5% Bounce TargetThis is my fast strategy for short moves (3–5%) ⚡
I publish these setups weekly with a win rate above 90% 📈🔥
Fundamentals are not bad 👍
The drop from ~$65 → ~$20 should be enough for a short bounce 🎯
📊 Forecast also shows an increase in revenue and profit in the coming years, which supports the upside 📈💵
From the technical side:
RSI oversold 📉
Strong support zone 🧱
Price action showing reversal signs 🔄
For a small quick profit, this looks like a good entry point 💰⚡
Reversalsetups
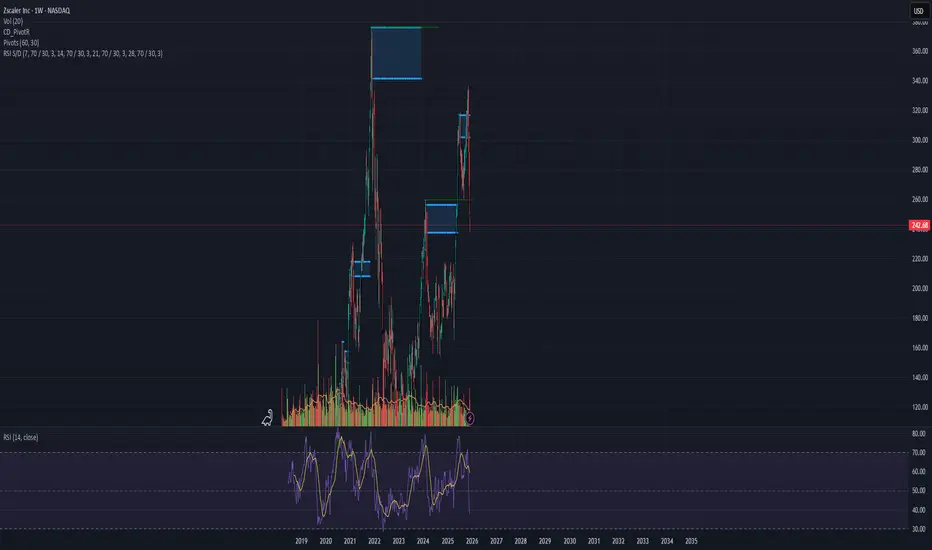
Fast Bounce Setup | Price: 242.68 → Target: 254.81 (+5%)Fundamentals 📊💼
Strong revenue growth from rising demand in cloud security and zero-trust solutions.
Forecasts support short-term upside momentum.
Repeated Behavior 🔁📉➡️📈
ZS often makes 5%–30% quick bounces after oversold drops.
The current pattern strongly matches earlier reversal cycles.
Volume & Price Action 🔥📊
Volume shows buyer accumulation, and price is sitting at a familiar bounce zone where ZS reacts quickly.
Entry: 242.68 💵
Target: 254.81 🎯
Profit: +5% expected 💰⚡
Fast Bounce Setup | Price: 242 → Target: 254.10 (+5%)Fast Bounce Setup | Price: 242 → Target: 254.10 (+5%) 📈⚡
Fundamentals 📊
VEEV shows steady revenue and profit growth, supported by strong demand for its cloud solutions in the life sciences sector.
Repeated Behavior 🔍
Historically, VEEV produces 5%–25% quick bounces after oversold or sharp pullback zones.
Current price action matches those previous reversal patterns.
Volume & Price Action 🔥
Volume shows accumulation and the price is sitting on a familiar bounce level.
Entry: 242
Target: 254.10
Profit: +5% expected 💰⚡

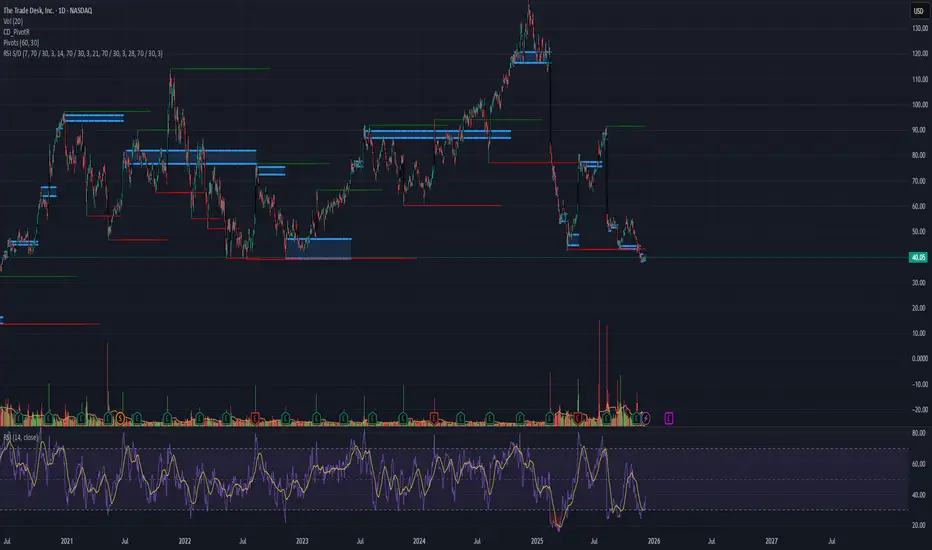
Fast Bounce Setup | Price: 40.05 → Target: 42.05 (+5%)Fast Bounce Setup | Price: 40.05 → Target: 42.05 (+5%) 📈⚡
Fundamentals 📊
TTD maintains strong long-term revenue growth, driven by rising digital ad spending and increasing adoption of programmatic advertising.
Profit forecasts also show healthy growth, strengthening the short-term upside potential.
Repeated Behavior 🔍
TTD has a well-defined behavioral pattern historically:
after sharp selloffs or oversold conditions, the stock often delivers 5%–100% quick bounces before consolidating.
Today’s setup fits the same repeated cycle seen in prior reversals.
Volume & Price Action 🔥
Recent volume indicates buyer accumulation after a wave of selling pressure.
Price is currently sitting at a familiar zone where TTD has shown fast short-term rebounds multiple times.
Entry: 40.05
Target: 42.05
Profit: +5% expected 💰⚡
Fast Bounce Setup | Price: 3.61 → Target: 3.79 (+5%)Fundamentals 📊
STKL shows improving revenue and margin forecasts, indicating gradual recovery.
Even though long-term movement has been unstable, the short-term fundamental outlook supports a bounce.
Repeated Behaviour 🔍
Historically, STKL has shown a clear behavioural pattern:
after deep pullbacks or oversold conditions, it regularly produces 5%–1000% bounces before stabilizing.
Today’s setup matches those previous repeated cycles.
Volume & Price Action 🔥
Recent volume activity suggests seller exhaustion and early accumulation.
Price is sitting exactly in a zone where STKL has shown multiple fast rebounds in the past.
Entry: 3.61
Target: 3.79
Profit: +5% expected 💰⚡

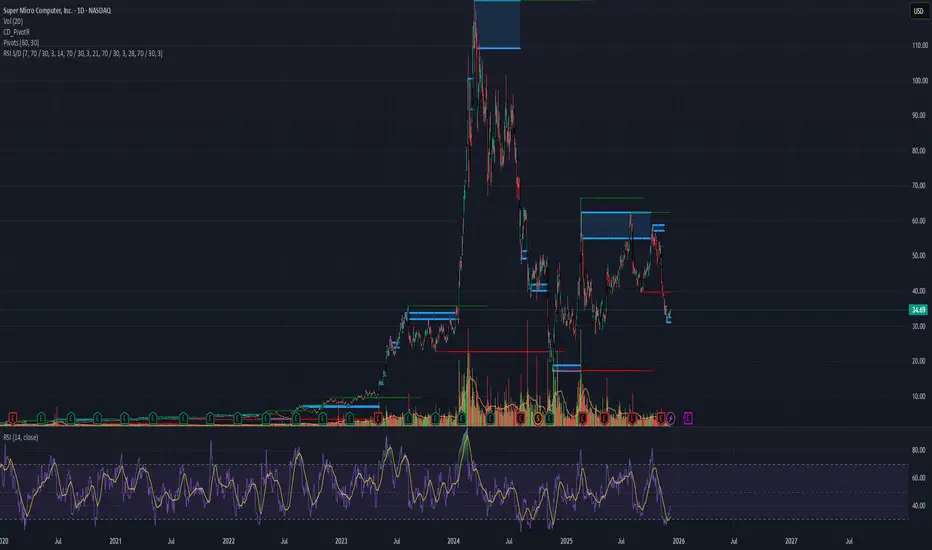
Fast Bounce Setup | Price: 34.69 → Target: 36.42 (+5%)Fundamentals 📊
SMCI continues to show strong revenue and profit forecasts, supported by growing demand in AI servers and high-performance computing hardware.
The long-term outlook is strong, which also supports short-term bounce setups.
Repeated Behavior 🔍
Historically, SMCI has shown a clear behavioral pattern: after sharp pullbacks or oversold phases, it typically produces 5%–50% bounces before stabilizing.
The current structure matches those previous behavior cycles.
Price Action 🔥
Recent volume spikes and the pullback zone align with previous SMCI reversal phases.
Price is reacting at a familiar technical level where the stock has shown fast rebounds.
Entry: 34.69
Target: 36.42
Profit: +5% 💰⚡
This setup is based entirely on the repeated behavioral pattern of SMCI itself.
Each stock has its own cycle — we do not use one fixed formula.
All signals come from pure behavior analysis.
#BehaviorBasedTrading 🔍📈
GBPUSD | Perspective for the new week | Follow-upThe British Pound (GBP) has been on a rough ride lately, closing out its fifth consecutive week in the red. But a late-week rally brought some hope, pulling the GBP/USD back from its lowest point in five months. Now, all eyes are on the upcoming week, which is packed with key economic data and a crucial Fed decision.
In this video, we'll analyze the GBP/USD currency pair, examining the potential for a bullish rebound in light of the upcoming economic releases and the Fed's likely rate cut.
With the Federal Reserve's September meeting on the horizon, investors are keenly focused on the potential for a rate cut. Current rate markets have priced in the beginning of a rate cut cycle, with the Federal Open Market Committee (FOMC) expected to meet on September 18. Although the probability of a 50 basis point cut was previously high, expectations have adjusted slightly. According to the CME’s FedWatch Tool, there is now a 53.5% chance of a 50 bps cut in September, with further cuts anticipated later in 2024.
Next week’s economic calendar is packed with key data. On Tuesday and Wednesday, we’ll receive the US Producer Price Index (PPI) and Consumer Price Index (CPI) inflation reports, which could provide crucial insights into market direction. Additionally, US Retail Sales and updates from the University of Michigan’s Consumer Sentiment Survey will offer more context for economic trends.
Given these developments, the big question is: will the British Pound be able to maintain its bullish momentum as we head into the new week? Join us as we dive into the charts, analyze the current market conditions, and discuss potential trading opportunities.
GBPUSD Technical Analysis:
Will the pound maintain buying pressure above $1.27500 and the ascending trendline next week? Watch this video for key trades this week. Join the discussion for updates on GBP/USD trading. Stay tuned for more content. Happy trading!
Disclaimer Notice:
Trading in the foreign exchange market and other instruments carries high risk and may not be suitable for all investors. The content provided here is for educational purposes only. Evaluate your financial situation and consult with a financial advisor before making any investment decisions. Past performance is not indicative of future results.

GBPNZD | New PerspectiveFollowing a 500pips move since my last publication on this pair (see link below for reference purposes); It appears we do have another trading opportunity here on the GBPNZD.
The appearance of a reversal set-up on the 1H time frame coupled with the obvious that the price is currently within a supply zone; we might want to consider a selling opportunity on this one as we anticipate a breakdown/retest of the key level @ 1.94 for confirmation.
Risk Disclaimer:
Margin trading in the foreign exchange market (including commodity trading, CFDs, stocks etc.) has a high risk and is not suitable for all investors. The content of this speculation (including all data) is organized and published by me for the sole purpose of education and assistance in making independent investment decisions. All information herein is for your reference only and I take no responsibility.
You are hereby advised to carefully consider your investment experience, financial situation, investment objective, risk tolerance level, and consult your independent financial adviser as to the suitability of your situation prior to making any investment.
I do not guarantee its accuracy and is not liable for any loss or damage which may result directly or indirectly from such content or the receipt of any instruction or notification therewith.
Past performance is not necessarily indicative of future results.

The Simple Thing That Tells You Not To Trend TradeI am a firm believer that when I’m stopped out of a trade it’s for 2 reasons.
Reason 1: a deeper pullback has occurred. This does not mean the trend has changed. Price just pulled back a bit more than expected.
Reason 2: a reversal has occurred. At this point I’m stopped out of the trade and the direction I was once trading in reverses.
In this GBPJPY 1 hour timeframe a reversal. I’ve been the buyer up tip this point. Now that a 1 hour
Lower low has been formed I’ll stop being the buyer. A lower low represents the sellers pushing price past the last higher price buyers(Japan) were willing to buy the base currency which in this case was the Pound.
As a trend trader my goal is to trade with the trend per the timeframe I’m analyzing. So, the buy is invalidate Ted until price begins to trend again. So, I wait for a pullback and evidence price can stay below the higher high and fall again. If it can I begin selling.
If price passes the higher high the lower low will have been a false breakout and I am the buyer again.
Just a simple understanding of when it’s time to not trend trade. Any questions?

NZDUSD breaking out of consolidation? Needs confirmation.From neutral to bearish (see previous idea/post link below) especially if we see a daily close as confirmation.
Measured target for this move shown in the chart.
This is a reversal trade and is a contrarian position against the overall preceding trend. I tend to view these setups as lower probability so I'm managing my risk here as best I can. Let's see what the market gives us.
This is not trading advice. Trade at your own risk.
