BTC | 111k holds: tactical long bias, eyes on 113.1k__________________________________________________________________________________
Market Overview
__________________________________________________________________________________
BTC is consolidating above 111,040, trapped in a tight range with a higher‑timeframe bullish bias, while intraday remains pressured below 113,129. The 111k area acts as the market’s key pivot. 🔁
Momentum: Range with bullish tilt 📈 — higher TFs positive (1D/12H), intraday needs a reclaim above 113,129.
Key levels:
• Resistances (TF): 113,129–114,384 (240/1D, immediate ceiling), 117,900 (1D, upper cap).
• Supports (TF): 111,040 (240/1D, major pivot), 110,440 (intraday), 107,255 (1D).
Volumes: Normal on daily; moderate on 4H/30m downside pushes — no standalone catalyst.
Multi-timeframe signals: 1D/12H/6H bullish, 4H/2H/1H mixed-to-bearish below 113,129; a reclaim/hold > 113,129 opens 114,384.
Risk On / Risk Off Indicator: NEUTRAL BUY (stronger on 15m) — confirms the range‑bullish bias and favors buy‑the‑dip above 111k.
__________________________________________________________________________________
Trading Playbook
__________________________________________________________________________________
Strategic stance: higher‑timeframe uptrend, prefer tactical longs above 111,040. 🎯
Global bias: NEUTRAL BUY while 111,040 holds; key invalidation on a close below 111,040 (align TF to your horizon).
Opportunities:
• Defensive long: bullish reaction confirmed above 111,040; add on break/hold > 112,300 then > 113,129.
• Breakout long: close and hold > 113,129 (30m/15m ≥ 2 bars) to target 114,384.
• Tactical sell: clean rejection at 112.9k–113.1k with selling volume, target a pullback to 111,040 (reduced size vs HTF filter).
Risk zones / invalidations:
• A confirmed loss of 111,040 → increases risk toward 110,440 then 107,255.
• Reclaim & hold > 113,129 → negates intraday pressure and unlocks 114,384.
Macro catalysts:
• Fed: -25 bps cut with dovish guidance — medium‑term risk support, validates buy‑the‑dip.
• Dollar (DXY): bounce risk — near‑term headwind, argues for staged entries.
• ETF flows: recent modest inflows, neutral‑to‑slightly constructive — not a trigger but doesn’t cap the technical upside.
Action plan:
• Entry: 111,300–111,500 on re‑acceptance/HL confirmation (15m/30m); add if holding > 112,300 then > 113,129.
• Stop: 110,850 (below swing & S1).
• TP1: 112,950; TP2: 113,129–113,300; TP3: 114,300–114,400.
• R/R: ≈ 2.0–2.5x depending on execution and adds.
__________________________________________________________________________________
Multi-Timeframe Insights
__________________________________________________________________________________
Overall, higher timeframes lean bullish while lower timeframes remain pressured until 113,129 is reclaimed. 🧭
1D/12H/6H: Bullish bias while holding 111,040; clearing 113,129 then 114,384 would enable compression toward 117,900.
4H/2H/1H/30m/15m: Intraday pressure below 113,129, moderate volume on sell pushes; dip‑buys near 111,040 remain preferred as long as the pivot holds.
Key divergences: HTF Up vs LTF Down → favors “buy the dip” at support, confirmed by volume and reclaim of prior caps (112,300 → 113,129).
__________________________________________________________________________________
Macro & On-Chain Drivers
__________________________________________________________________________________
Macro backdrop is modestly supportive (dovish Fed), but a dollar bounce could cap near‑term rallies; ETF flows are constructive but not decisive. ⚖️
Macro events: Fed -25 bps and still‑dovish dot plot support risk; a technical DXY bounce remains a short‑term counterweight.
Bitcoin analysis: Defending ~111k near the 100D; gradual recovery toward the 50D plausible if 113,129/114,384 are reclaimed; institutional/ETF tone mildly positive.
On-chain data: Not provided — technicals and flows drive the lens.
Expected impact: Macro is broadly risk‑friendly, but execution should be paced under resistance; prefer staged entries above 111k.
__________________________________________________________________________________
Key Takeaways
__________________________________________________________________________________
BTC is ranging above 111,040 with a higher‑timeframe bullish bias and intraday headwinds below 113,129.
- Trend: bullish in HTF, neutral/paused intraday until 113,129 is reclaimed.
- Setup: buy the dip above 111,040, then add on breakout > 113,129 toward 114,384.
- Macro: Dovish Fed supports the case, while a firm DXY can slow upside.
Stay nimble: watch 111,040 defense and the 113,129 reclaim to trigger the next leg.
Risk

BTC – Momentum Returns!Hello TradingView Family / Fellow Traders. This is Richard, also known as theSignalyst.
📈BTC has been overall bullish trading within the rising broadening wedge marked in red.
This week, BTC has been retesting the lower bound of the wedge.
Moreover, the orange zone is a strong structure and previous ATH.
🏹 Thus, the highlighted blue circle is a strong area to look for buy setups as it is the intersection of the lower red trendline and orange structure.
📚 As per my trading style:
As #BTC approaches the blue circle zone, I will be looking for trend-following bullish reversal setups (like a double bottom pattern, trendline break , and so on...)
📚 Always follow your trading plan regarding entry, risk management, and trade management.
Good luck!
All Strategies Are Good; If Managed Properly!
~Richard Nasr

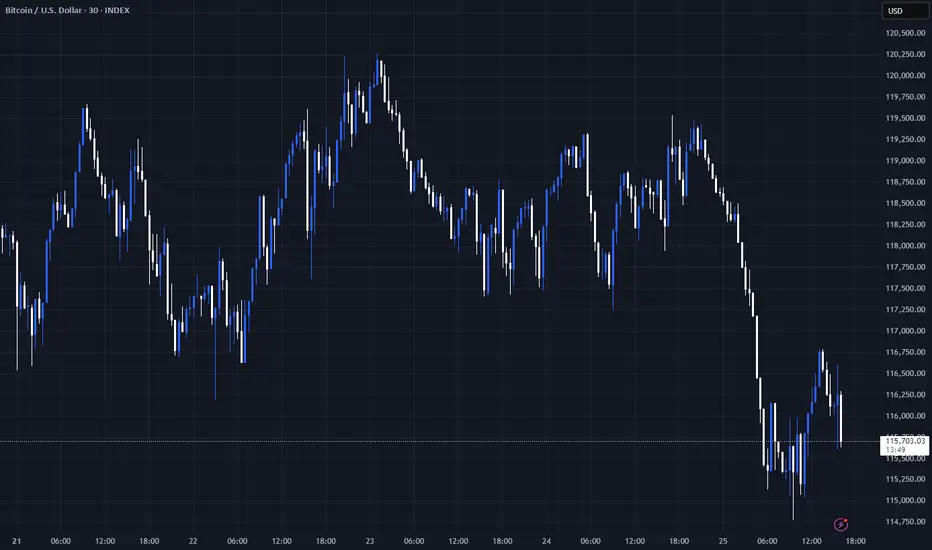
BTC: All eyes on 116,814.5 into the FOMC__________________________________________________________________________________
Market Overview
__________________________________________________________________________________
BTC is coiling below the 116.6–116.8k supply zone, keeping the higher-timeframe uptrend intact but capped by the daily pivot at 116,814.5. With the FOMC ahead, volumes remain normal, favoring “break & hold” confirmation over anticipation.
Momentum: Mild bullish bias 📈 but capped under 116,814.5 → high-range 115.0–116.8k.
Key levels:
- Resistances : 116,600–116,814.5 (D/4H pivot), 117,600–118,000 (local liquidity), 124,277.5 (major D pivot).
- Supports : 115,100–114,900 (1H/30m), 114,447.7–113,421 (4H/12H confluence), 111,965.8 (weekly pivot).
Volumes: Normal across TFs; a volume spike is needed to validate the 116.8k breakout.
Multi-timeframe signals: 1D/12H Up (MTFTI filter), 6H/4H/2H NEUTRAL BUY with stair-step structure; notable exception: 1D Dashboard at STRONG SELL, tempering extensions.
Risk On / Risk Off Indicator: NEUTRE VENTE (slight risk-off tilt) — this contradicts the tactical bullish momentum, so demand robust breakout confirmation.
__________________________________________________________________________________
Trading Playbook
__________________________________________________________________________________
Strategic stance: primary uptrend intact but locked by 116,814.5; favor confirmed breakouts and clean retests.
Global bias: Neutral-bullish while 113,421 holds; key invalidation on a close < 113,421 (HTF).
Opportunities:
- Breakout long: Buy a break & hold > 116,814.5 (≥2 closes 4H/12H), target 117.6–118.0k then 120k.
- Buy the dip: Tactical bids at 115,100–114,900 with tight stop below 114,447.7, targeting 116.2 then 116.8k.
- Tactical sell: Fade 116.6–116.8k if 115.1k/114,447.7 breaks, target 113.42k.
Risk zones / invalidations:
- A loss of 113,421 unlocks 111,97k and invalidates the bullish bias.
- Failed hold above 116,814.5 (fast rejection) = bull trap risk; wait for a “break & hold”.
Macro catalysts (Twitter, Perplexity, news):
- FOMC: 25 bp cut expected; Powell’s guidance/dot plot will steer risk.
- Softer USD, record gold and strong equities = conditional tailwind.
- Elevated post-Fed whipsaw risk; avoid impulsive entries.
Action plan:
- Plan A (Breakout long) : Entry 116.9–116.4k (retest), Stop 114.9k, TP1 117.6–118.0k, TP2 120k, TP3 124,277.5, R/R ~1.8–2.5x.
- Plan B (Buy the dip) : Entry 115.10–114.90k, Stop 114.40k, TP1 116.20k, TP2 116.80k, TP3 117.6–118.0k, R/R ~1.5–2.0x.
- Plan C (Tactical sell) : Entry on 116.6–116.8k rejection confirmed by a 115.1k break, Stop > 116,814.5, TP1 114.45k, TP2 113.42k, TP3 111.97k, R/R ~1.8–2.2x.
__________________________________________________________________________________
Multi-Timeframe Insights
__________________________________________________________________________________
Higher TFs remain constructive but constrained by a single overhead pivot, while tactical TFs lean bullish provided a confirmed breakout.
1D/12H: Up with higher highs/lows; 116,814.5 is the decision pivot. Holding above unlocks 118–120k; below it, high-range 114.9–116.8k persists.
6H/4H/2H: NEUTRAL BUY; stair-step advance with bids near 114.4–115.1k. The Dashboard (4H = STRONG BUY) supports a clean breakout if volumes expand.
1H/30m: NEUTRAL; compression 115.1–116.0k with supply 115.6–115.9k. Validation requires > 116.20k then > 116,814.5.
15m: NEUTRAL BUY; micro higher lows but intraday cap intact. Key confluence: single 116,814.5 resistance + normal volumes → need a catalyst.
__________________________________________________________________________________
Macro & On-Chain Drivers
__________________________________________________________________________________
Macro is FOMC-driven (cut expected) with a softer USD and record gold aiding risk, yet event risk is elevated.
Macro events: A 25 bp cut is widely anticipated; Powell/dot plot to guide risk. DXY pullback and equity momentum are tailwinds; whipsaw risk post-Fed remains high.
Bitcoin analysis: Price compressed under ~116.8–118k; 115k acts as intraday pivot. The 114.45–113.42k cluster is critical; losing it invites 111.97k.
On-chain data: Spot/ETFs flows tempered; derivatives more influential with moderate leverage — a durable breakout needs spot volume and multi-bar holds above 116.8k.
Expected impact: A dovish Fed improves odds of a break & hold > 116,814.5; a hawkish tilt risks a slide toward 114.45–113.42k.
__________________________________________________________________________________
Key Takeaways
__________________________________________________________________________________
BTC is in a high-range under a single daily pivot, with an intact uptrend but macro headwinds.
- Overall trend: neutral-bullish while 113,421 holds; a clean break of 116,814.5 is needed to target 118–120k.
- Top setup: confirmed breakout > 116,814.5 with a successful retest and rising volume.
- Macro factor: FOMC ahead; softer USD and record gold support risk but heighten whipsaw potential.
Stay patient: wait for “break & hold” or buy the manageable dip — discipline around major pivots is key.

BTC capped at 113.2k–115.2k: fade rallies, watch CPI__________________________________________________________________________________
Market Overview
__________________________________________________________________________________
BTC is chopping in the low-110k, capped by a stacked 113.2k–115.2k supply zone, with macro headline risk elevated into CPI.
Momentum: 📉 Range with bearish tilt — upside attempts fail below 113.2k–114k while HTF pressure remains risk-off.
Key levels:
• Resistances (HTF/LTF) : 113.2k–113.4k (LTF/240 PH) · 114.5k–115.3k (HTF/720 PH) · 116.6k (recent high, HTF).
• Supports (HTF) : 111.9k–112.0k (W pivot) · 110.8k (240 PL) · 107.8k (D PL).
Volumes: Normal on HTF; “moderate” upticks on 1H–30m during failed breakouts.
Multi-timeframe signals: 1D/12H/6H trend down; 4H–1H mixed with a hard cap at 113.2k–114k; 15m micro-bullish while 111.96k holds. Strong confluence at 113.2k → 115.2k resistance and 111.96k/110.77k/107.8k supports.
Risk On / Risk Off Indicator: NEUTRAL SELL ; Global Risk Regime stays STRONG SELL — confirms the bearish bias and fades micro-rallies.
__________________________________________________________________________________
Trading Playbook
__________________________________________________________________________________
As long as 113.2k–115.2k caps price, favor “sell the rip” and only buy on confirmed signals.
Global bias: SELL while below 115.24k; major short invalidation on daily > 116.6k.
Opportunities:
• Tactical short on 113.2k–114.0k rejection toward 112.0k/111.0k; inval. above 115.3k.
• Breakout long only on H1/H4 acceptance > 113.3k (retest holds) toward 114.6k/115.24k; inval. below 111.9k.
• Defensive long on clean reaction at 110.8k or 107.8k if risk blocks improve (≥ NEUTRAL BUY on LTF).
Risk zones / invalidations: Break < 110,77k voids defensive longs (opens 107.8k); H4/D12 close > 115.24k voids range shorts (opens squeeze to 116.6k).
Macro catalysts (Twitter, Perplexity, news): CPI next (direct vol around 111k–112k pivot) · Geopolitics (NATO Article 4; Middle East) supports risk-off · US tariff path (SCOTUS) preserves trade-policy uncertainty.
Action plan:
• Fade-rally short : Entry 113.2k–114.0k / Stop 115.3k / TP1 112.0k · TP2 111.0k · TP3 110.8k / R:R ~1.8–2.5.
• Breakout long : Entry > 113.3k (confirmed retest) / Stop 111.9k / TP1 114.6k · TP2 115.24k · TP3 116.6k / R:R ~1.6–2.2.
__________________________________________________________________________________
Multi-Timeframe Insights
__________________________________________________________________________________
HTFs remain bearish while LTFs attempt extensions under a dense overhead supply.
1D/12H/6H: Downtrend, rallies capped below 113.2k–115.2k; dominant supply, supports layered at 111.96k → 110.77k → 107.8k.
4H/2H/1H: Mixed reads; need a clean close > 113.24k to open 114.6k–115.24k, otherwise frequent fades back to 111.96k.
30m/15m: 30m cautious (STRONG SELL) vs 15m micro-bullish (NEUTRAL BUY); classic pre-catalyst divergence — wait for H1/H4 confirmations.
Confluence/Divergence: Heavy multi-TF supply 113.2k → 115.2k; risk-on equities vs risk-off credit/crypto warns against chasing crypto bounces.
__________________________________________________________________________________
Macro & On-Chain Drivers
__________________________________________________________________________________
Macro is mixed (gold ATH, firm oil, US equities buoyed by cut hopes) while geopolitics heats up and CPI looms.
Macro events: CPI imminently (sets risk tone) · NATO Article 4/Middle East tensions (risk premia higher) · US tariff track (SCOTUS) sustains uncertainty.
Bitcoin analysis: 100–1k BTC cohorts accumulating, 1k–10k distributing — potential cap on impulsive upside; ETF flows cooling, consistent with consolidation below 114k–116k.
On-chain data: Activity skewed by inscriptions/runes; sentiment in “fear” (44/100) implies positioning not crowded long.
Expected impact: Range-to-down bias while < 113.3k–115.2k; a benign CPI could trigger a push > 113.3k toward 114.6k/115.24k.
__________________________________________________________________________________
Key Takeaways
__________________________________________________________________________________
The market stalls under multi-TF supply as key catalysts approach.
- Overall trend: 📉 bearish on HTF; LTFs try but stall below 113.2k–114k.
- Best setup: Fade 113.2k–114.0k into CPI with active management.
- Key macro: CPI and geopolitics drive the global risk regime.
Stay disciplined around the 111.9k–112.0k pivot and let confirmation lead exposure. ⚠️

Risky NZDUSD Trade RecapThis setup wasn’t the cleanest, but sometimes calculated risk pays off.
📉 Setup:
Price was in a clear downtrend, making this buy counter-trend.
Demand zone around 0.5818 offered a possible bounce.
Break of the descending trendline gave early confirmation.
✅ Entry: 0.58189
❌ SL: 0.57964
🎯 TP: 0.59420 – 0.59490 supply zone
📊 Outcome:
Despite the risk of fading the trend, price respected demand, broke structure, and ran straight into my supply target at 0.5940+ for full profits.
⚠️ Not every trade will be textbook perfect — but with proper risk management, even the risky ones can pay off.
#NZDUSD #ForexTrader #RiskManagement #RiskyTrade #PriceAction #SmartMoneyConcepts #ForexJourney #MarketStructure

Indecision and Potential StallingHi Traders!
GBPUSD is telling me indecision right now. When mapping out my trading plan I'm seeing price recently made a higher low on the weekly, dipped into a Daily Order Block, and currently testing the 1.36000 neckline. However, unless GBPUSD closes above 1.35200, retests with continuation, this looks like consolidation. Alerts set, and waiting for some more confirmation right now.
Key levels:
Bullish breakout- Close above 1.35200.
Bearish caution- Break below 1.34600/1.34500.
*DISCLAIMER: I am not a financial advisor. The ideas and trades I take on my page are for educational and entertainment purposes only. I'm just showing you guys how I trade. Remember, trading of any kind involves risk. Your investments are solely your responsibility and not mine.*

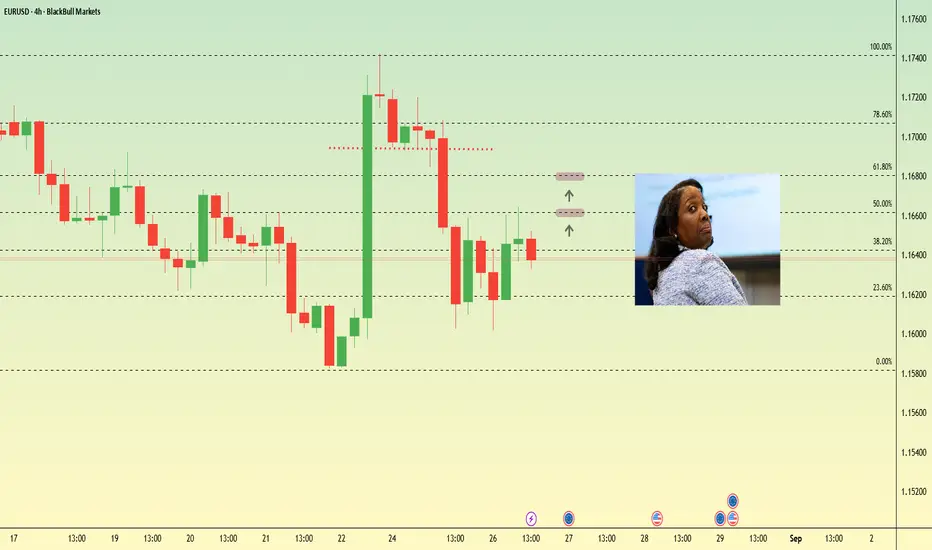
How Lisa Cook’s Rejection Sparked a Dollar Rebound Markets were quick to react to President Trump’s decision to fire Federal Reserve Governor Lisa Cook.
The U.S. dollar softened immediately, as traders weighed the possibility of political interference undermining confidence in the Fed’s policy outlook.
The EURUSD found support near 1.1690, before retracing as Cook’s stance restored some market confidence.
Cook has refused to step down and is preparing legal action, arguing that the president lacks the authority to remove a sitting governor.
If Trump doubles down or the legal fight escalates, we could expect volatility with a possible bias for euro strength. If 1.1640 breaks cleanly to the upside, EUR/USD could attempt to retest the 50% retracement at 1.1660, and then the 61.8% level near 1.1680.
BTC Long (short term high risk)Hi,
I just entered a BTC long, expecting a further upwards move after the indication and pullback.
Hopefully it will short term go to around 119k, but can be a further continuation of the bull trend longterm. But thinking short term in this one, I set a stop loss just below this weekend's pullback low.
Lucky trading!
David.

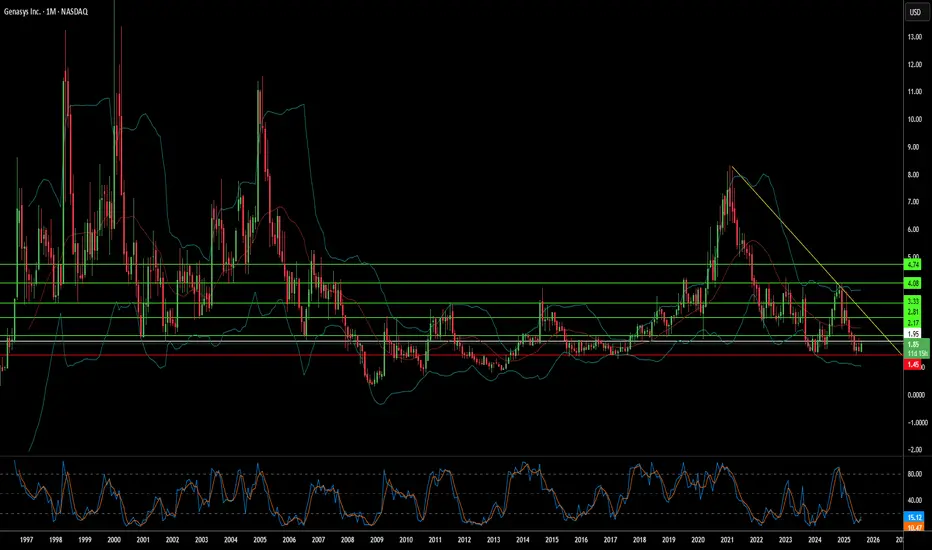
Can Sound Waves Become Tomorrow's Shield Against Global Chaos?Genasys Inc. (NASDAQ: GNSS) operates at the convergence of escalating global instability and technological innovation, positioning itself as a critical player in the protective communications sector. The company's sophisticated portfolio combines its proprietary Long Range Acoustic Device (LRAD) systems with the cloud-first Genasys Protect software platform, serving over 155 million individuals across more than 100 countries. With law enforcement agencies in over 500 U.S. cities utilizing LRAD systems for applications ranging from SWAT operations to crowd control, Genasys has established itself as the global standard in acoustic hailing devices, delivering messages 20-30 decibels louder and with superior intelligibility compared to traditional systems.
The company's growth trajectory aligns with powerful macroeconomic forces driving unprecedented demand for protective communications. Global defense spending surged to $2.718 trillion in 2024—a 9.4% increase representing the steepest rise since 1988—while the critical infrastructure protection market is projected to grow from $148.64 billion in 2024 to $213.94 billion by 2032. Genasys's integrated solutions directly address this expanding market through non-kinetic de-escalation capabilities and cyber-physical threat mitigation, recently securing $1 million in LRAD orders for the Middle East and Africa as geopolitical tensions intensify.
Genasys's competitive advantage rests on a robust foundation of 17 registered patents, particularly in acoustic hailing technology, creating significant barriers to entry while enabling premium pricing. The company's $4.2 million annual R&D investment ensures continued innovation, while strategic partnerships like its collaboration with FloodMapp demonstrate the platform's evolution toward predictive threat mitigation rather than merely reactive response. Despite current profitability challenges—with Q3 2025 net losses of $6.5 million—the company maintains a substantial project backlog exceeding $16 million, plus the transformative $40 million Puerto Rico Early Warning System project expected to generate $15-20 million in fiscal 2025 revenue.
The investment thesis centers on Genasys's unique positioning to capitalize on the global shift toward sophisticated, non-lethal security solutions amid rising geopolitical instability. With percentage-of-completion accounting currently suppressing gross margins to 26.3% but promising significant margin expansion as major projects near completion, the company represents a compelling opportunity for investors seeking exposure to defense, public safety, and critical infrastructure growth markets. The convergence of technological superiority, strategic market positioning, and substantial revenue visibility through confirmed backlog suggests significant long-term potential despite near-term financial complexities.
U.S. Slaps 39% Tariff on Swiss Gold BarsU.S. Slaps 39% Tariff on Swiss Gold Bars, Shaking the Global Bullion Market
By Hirad Aryanejad – Macroeconomic & Gold Markets Analyst
---
The United States has moved to impose a 39% tariff on imports of one-kilogram and 100-ounce gold bars from Switzerland — a shock decision that could ripple across the global bullion market.
In a letter dated July 31, 2025, the U.S. Customs and Border Protection (CBP) reclassified these widely traded bullion products — critical to the Comex futures market — as “semi-manufactured”, making them subject to duties.
Previously, they were classified as “unwrought, nonmonetary gold” , exempting them from earlier tariff rounds.
---
A Blow to the World’s Largest Refining Hub
The decision follows former President Donald Trump’s broader tariff package on all Swiss goods, announced after rejecting Switzerland’s proposal for a 10% tariff in exchange for \$150 billion in U.S.-bound investment.
Switzerland — the world’s largest gold refining hub — exported roughly $61.5 billion in gold to the U.S. over the 12 months ending June 2025. The new tariff could add nearly $24 billion in duties.
Christoph Wild, President of the Swiss Association of Manufacturers and Traders of Precious Metals, called the ruling “another blow” to Swiss-U.S. gold trade, warning that exports may become “economically unviable”.
---
Market Reaction: Record Gold Prices
The ruling triggered an immediate market shock. Gold futures in New York surged past $3,500 per troy ounce, hitting a record $3,534 on August 8, before pulling back slightly.
Analysts say the rally was driven by both the tariff announcement and gold’s safe-haven appeal amid escalating trade tensions and geopolitical uncertainty.
Some traders described the CBP’s decision as “shocking” and possibly mistaken, predicting legal challenges ahead. The lack of clarity has already caused certain shipments to freeze in transit.
---
The Critical Role of Switzerland in Bullion Logistics
Global bullion trade depends on a triangular supply chain:
Raw gold refined in Switzerland Cast into kilo bars for the U.S. market or 400-ounce bars for London Delivered to satisfy Comex contracts and central bank reserves
This logistical network is now under threat. UBS strategist Joni Teves has questioned whether U.S. gold futures trading can remain viable if tariffs on deliverable products persist.
The Swiss Precious Metals Association noted that the CBP’s clarification applies to all 1kg and 100oz gold bars imported into the U.S. not only those from Switzerland — raising the stakes for global trade flows.
---
Negotiations and Uncertainty Ahead
Switzerland continues to negotiate with Washington to reduce the tariff burden, but uncertainty remains.
The White House is reportedly preparing a clarification on the bullion tariffs that could determine whether the market stabilizes or faces prolonged disruption.
Until then, gold industry players — from major banks to refining houses — are bracing for further volatility, both in pricing and physical supply chains.
---
Keywords: gold market news, Swiss gold bars, U.S. gold tariffs, Comex gold futures, bullion trade, Switzerland gold exports, precious metals refining, gold price surge, macroeconomic analysis.
Swing opportunity on cluster support, technical & macro plan__________________________________________________________________________________
Technical Overview – Summary Points
__________________________________________________________________________________
Momentum : Tech sector bias supportive on higher timeframes (Risk On / Risk Off Indicator “Buy” on 1D/12H) despite MTFTI “Down” on intraday (15min to 6H).
Key Supports : Major cluster at 111,900–112,772 (W Pivot High, 12H/24H Pivot Low). Critical defense short/mid term.
Resistances : 114,723, then 115,900, then 119,800–122,318 (break to relaunch impulse).
Volumes : Moderate to normal across all timeframes: no panic or capitulation.
Multi-TF Behaviour : ISPD DIV neutral everywhere: neither fear nor euphoria; wait-and-see market. No climax nor emotional extremes: conducive to squeeze or extension after catalyst.
__________________________________________________________________________________
Strategic Summary
__________________________________________________________________________________
Global Bias : Neutral to cautious bullish if 111,900–112,772 holds (invalidate if <111,900).
Opportunities : Defensive swing long entries on support. Gradual targets: 114,723, 115,900, 119,800–122,318.
Risks : Daily/4H close below 111,900 = acceleration towards $110k/$105k (on-chain air-gap).
Macro Catalysts : Geopolitical tensions (Gaza/Ukraine/China), China crypto ban headlines, sector decoupling, Fed/BoE policy.
Action Plan : Strict stop management (<111,750), agile on volume/ISPD signals. Critical macro monitoring: any exogenous move can trigger directional volatility.
__________________________________________________________________________________
Multi-Timeframe Analysis
__________________________________________________________________________________
1D (Daily) : Key support 114,723.2. Tech sector indicator (Risk On / Risk Off Indicator) bullish. MTFTI Up. Normal volume, no panic. Lack of ISPD oversold signal.
12H : Support W Pivot High 111,900 – 12H Pivot Low 111,920. Uptrend, moderately higher volumes, ISPD neutral. Battling for support maintenance and bounce.
6H : Core pivot support 111,900–112,000. MTFTI Down. No volume excess or sentiment signal. End of momentum, increase vigilance.
4H : Weakness confirmed, supports 112,000–112,500, resistance 117,722 to 119,800. Last short-term rampart tested.
2H-1H : Bearish, attacks on 111,900–112,772 supports, immediate resistance at 114,723/115,900. Weak range market.
30min-15min : Neutral, lower range between supports (111,900–112,772) and resistances (113,950–114,723). Volatility on breakout events, no sector bias.
Risk On / Risk Off Indicator : Persistent “Buy” on higher timeframes (12H/1D), neutral/bearish intraday (4H and below).
ISPD DIV : No extremes detected: no exhaustion, panic or major oversold; “range” environment.
Volumes : Normal, no climax or anomaly. Market awaiting a catalyst.
__________________________________________________________________________________
Fundamental, Macro Events, Sentiment Overview
__________________________________________________________________________________
Macro : Newsflow on China crypto ban, multiple tensions (Gaza, Russia-Ukraine), Fed/BoE slowing. Globally cautious setting despite no direct institutional shock.
On-chain (Glassnode) : Major OTC sale (~80k BTC) absorbed, 97% supply in profit: “moderate euphoria” phase, not capitulation; on-chain supports $110–117k, resistance $125–141k, air-gap below $115k.
Twitter : No panic, “final wick” narrative then anticipated technical rebound. No institutional outflows. China ban read as cyclical FUD.
__________________________________________________________________________________
Summary & Action Plan
__________________________________________________________________________________
Support 111,900–112,772 = key multi-TF cluster; area for defensive swing opportunity.
MTFTI is “Down” on lower TF, but Risk On / Risk Off Indicator bullish on daily/12H.
No capitulation, normal volume, market waiting for catalyst.
Swing bullish invalidated below 111,900—stop required, R/R 1:2 minimum.
Fast reclaim above 114,723 plus strong upside volume: short squeeze & potential extension to 119,800–122,318.
Macro monitoring essential (China ban, monetary policy, geopolitics).
__________________________________________________________________________________
Operational Summary : Favor defensive swing long plans on multi-TF cluster support (111,900–112,772), strict stop <111,750, progressive TPs to 114,723/115,900/119,800. Stay opportunistic: bias cautiously bullish but risk management is paramount in a cautious global environment and with no strong extremes detected.
__________________________________________________________________________________

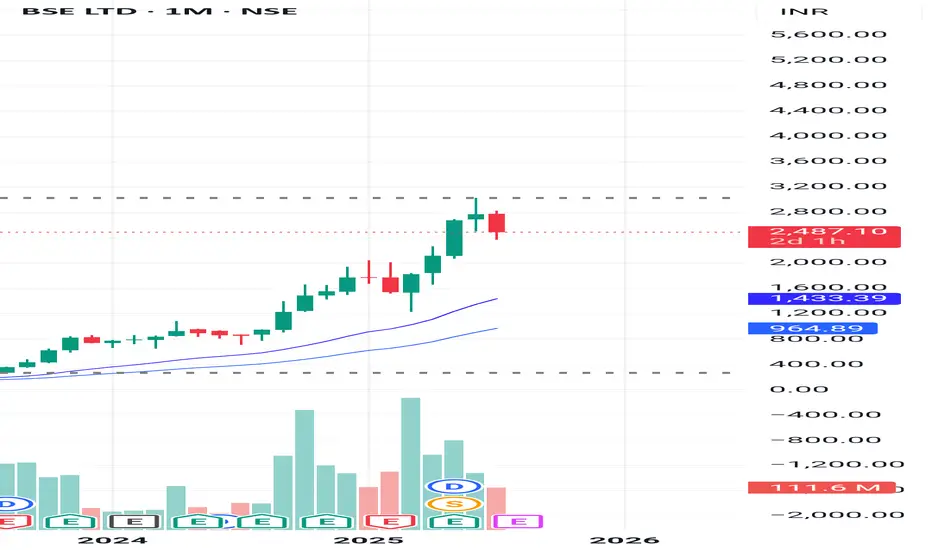
DCF VALUATION ANALYSIS OF BSEConclusion: OVERVALUED
:-OVERVIEW
BSE Limited has shown strong financial growth in recent years. Its revenue jumped from ₹924.84 crore in FY23 to ₹1,592.50 crore in FY24 (a 72% increase), and further surged to ₹3,212 crore in FY25, doubling year-on-year. EBITDA grew impressively to ₹1,779 crore in FY25 with a 60% increase, and EBIT reached ₹1,670 crore, up 56%. Net profit also rose significantly to ₹1,112 crore, with earnings per share increasing to ₹81. Dividend per share improved to ₹23, reflecting healthy returns
DCF:
-The valuation was performed using a Discounted Cash Flow (DCF) approach based purely on verified financial data and market risk parameters without relying on user-specific growth assumptions.
-The cost of equity was calculated using an adjusted risk-free rate plus equity risk premium multiplied by beta, resulting in a discount rate of approximately 13.58%. The terminal growth rate was conservatively taken as 4%. Using these reliable inputs and actual EBIT cash flows, the intrinsic enterprise value was estimated at around ₹36,839 crore, translating to an intrinsic value per share of approximately ₹1,364.
-Currently, BSE’s market price is around ₹2,480 per share, which is substantially higher than the intrinsic value derived from fundamentals, indicating the stock is trading at a significant premium. This valuation is grounded in audited company financials and globally accepted valuation methodologies, providing a trustworthy reference point for investors.
Risk-to-Reward and Journaling : Track, analyze, and evolve
📈 Mastering the Markets: Why Risk-to-Reward and Journaling Are Every Trader’s Edge
In trading, profitability isn't just about making winning trades — it's about managing risk smartly and learning from every position. Two of the most underrated habits that separate amateurs from consistent traders are:
1. Understanding Risk-to-Reward (R:R)
The risk-to-reward ratio is the foundation of trade planning. It's a simple calculation of how much you're willing to risk versus how much you aim to gain. A ratio of 1:2 means you risk $1 to potentially make $2.
✅ Why it matters:
Even with a 40% win rate, a positive R:R can still yield profitability.
It disciplines your entries, stops, and targets — no more emotional exits.
It forces you to filter out trades that don’t offer enough upside.
📊 For example, if you take 10 trades risking $100 each with a 1:2 R:R:
Win 4 = $800 gain
Lose 6 = $600 loss
Net Profit = $200 despite winning less than half.
2. The Power of Journaling
Trading without a journal is like flying blind. Your memory fades, but data doesn’t lie. A trading journal helps you:
🧠 Improve strategy by analyzing what works (symbols, timeframes, setups)
📉 Spot patterns in losses — overtrading? wrong R:R? bad timing?
📈 Stay disciplined — journaling enforces accountability
📒 Capture emotions — was it fear or FOMO? A journal tracks mindset too.
In my experience, journaling alone can boost a trader’s edge more than tweaking indicators. It turns experience into insight.
🎯 Final Word
The market rewards preparation, not prediction. A solid risk-to-reward framework keeps you in the game. Journaling turns your trades into tuition. Together, they compound your growth.
Happy Trading
GBP/JPY Low Risk BUYS - SWINGLOW RISK TRADE
If you prefer not to swing you can scalp buys on the pullbacks throughout the week ahead.
GBP/JPY - BULLISH ENGULFING CONFIRMED
A+ SETUP since it has touched
and respected our area of interest.
SL - 185.599
TP1 - 190
TP2 - 192.799
TP3 - 194.681

Mastering Risk Management: The Trader’s Real EdgeYou’ve all heard it,
“Cut your losses and let your winners run.”
Simple words — but living by them is what separates survivors from blown accounts.
Here’s some tips on how to approach risk management when trading:
☑️ Risk is always predefined: Before I click Buy or Sell, I know exactly how much I’m willing to lose. If you don’t define risk upfront, the market will do it for you.
☑️ Position sizing: Never risk more than 1–2% of your account per trade. Small losses mean you can keep taking high‑probability setups without fear.
☑️ Always use a stop‑loss: No stop? You’re not trading — you’re gambling.
☑️ Stop‑loss discipline: Place stops where the market proves you wrong — not where it “feels comfortable.” Then leave them alone.
☑️ Focus on risk/reward, not win rate: A 40% win rate can still be profitable if your average reward outweighs your risk.
☑️ Risk/reward ratio: Only take trades with at least a 2:1 or 3:1 potential. You don’t need to win every trade — your winners should pay for your losers (and more).
Remember:
“It’s not about being right all the time. It’s about not losing big when you’re wrong.”
Risk management won’t make your trades perfect — but it will keep you trading tomorrow.
And in this game, staying in the game is everything.
💭 How do you handle risk in your trading? Drop your strategy or tip in the comments — let’s share and learn together! 👇
Thanks again for all the likes/boosts, we appreciate the support!
All the best for a good week ahead. Trade safe.
BluetonaFX

SPX Is Pure RiskAbsolutely insane for people to be saying things like "a new bull market" when it never ended. All of the risk is to the downside. If markets ran another 10% to the upside that gives investors a chance to determine if they want to buy a correction to see new highs or not. But to say that a bull market is coming is the antithesis of thinking when current risk is all downside.
This is risk management 101:
Lets say you have a SP:SPX target of 10,000, would you rather buy it at 6,500 where you know your downside is 7-8% or right here at 6300 with a potential downside of 22%+?
Who in the market is long right now? Everyone because all the short sellers are stopped out, and the dumbest of money the guys who just got promoted to the rank of captain in the branch of hindsight bought the "breakout."
The retracement to the highs has been one of the most hated rallies off of a bounce ever seen and why? Because it required a large amount of vibes and to a degree stupidity to buy where it bounced but it paid off. So if it was borderline stupid to do that, what does it mean to lever up at the top?
The correct method is to either be short here or be patient for a breakout with volume and a successful retest. There you can limit your downside and have nearly unlimited upside if it plays out that way.

Risk and Probability in Trading — Why Risk Assessment MattersRisk and Probability in Trading — Why Risk Assessment Matters More Than Chasing the “Holy Grail”
In trading, most participants and analysts are focused on finding the so-called “Holy Grail” — the perfect entry point where the price moves in the desired direction and yields profit. However, few actually assess the risks involved, as if success is possible without factoring them in. Market reviews are often filled with levels, forecasts, and price directions, but rarely include probability estimates or potential losses.
In my view, the real Holy Grail isn't a guaranteed profitable entry, but a scenario where the market offers a position with minimal risk relative to historical context. To identify such setups, we need a risk scale based on historical data — how favorable the current risk-to-reward ratio is compared to the past.
It’s also crucial to understand that no one can predict price direction with certainty. The key to opening a position is not hope, but evaluating all possible scenarios — upward, downward, or sideways — and knowing the outcome in each case. Risk management is more than just placing a stop-loss; it’s a structured approach that should be central to any trading strategy.
What Are Minimal Risks?
“Minimal risk” is a relative concept — it only makes sense when measured against a defined scale. Building such a scale requires historical statistics: what were the maximum and minimum losses and profits for similar positions in the past?
Profit-to-Loss Ratio
The idea behind the search for the “Holy Grail” is to find moments when the market offers the best possible profit-to-risk ratio. For example, if the current ratio is 10, and historically it has ranged from 0 (low risk) to 100 (high risk), then 10 may be a good entry point. If the ratio approaches 80–90, it signals that the position is extremely risky.
Why Are Probability and Risk Assessment Important?
Market reviews often talk about resistance levels, volatility, and price direction — but rarely address the risks of different scenarios. No expert can predict market movements with certainty — if they could, they’d be billionaires. Opening positions without accounting for risks and scenario probabilities is extremely dangerous.
How to Factor in Risks When Entering a Position
The key question is: what will the profit-to-loss ratio be after entering a position, depending on whether the price goes up, down, or stays flat? It’s important to understand the consequences of each case and make decisions based on risk assessment.
Risk Management Must Account for the Inability to React Instantly
Conventional tools like stop-losses and limit orders often fail to protect capital effectively during sudden price spikes. These tools are particularly vulnerable when market makers or high-frequency algorithms trigger stop levels en masse.
This highlights the need for more resilient risk management instruments — ones that can respond to volatility instantly and automatically. Options are one such tool, capable of limiting losses regardless of market dynamics.
Without robust risk management, long-term profitability becomes statistically unlikely. Sooner or later, the market will present a scenario that can wipe out your capital — unless you’re properly protected.
Important note: this is not an endorsement of options or any specific broker. It’s simply a conclusion based on the logic of building effective capital protection. If a broker only provides access to linear instruments (futures, spot, stocks) without the ability to hedge, it will inevitably lead to capital erosion — even for systematic traders.
And if this article gets more than 100 rockets, I’ll continue sharing specific examples of low-risk trading assessments.

Crude Oil Prices Rocketing amid geopolitical risks
NYMEX:CL1! NYMEX:MCL1! NYMEX:BZ1!
Macro:
Geopolitical tensions remain high and markets are now likely to price in our scenario discussing ongoing air and missile war, given one-off intervention from the US thus far. According to Reuters, the U.S. now assesses that Iranian retaliation could occur within the next two days.What happens next is anybody’s guess but as traders, it is important to navigate these uncertainties with scenario planning and/or reduce risk to account for increased volatility.
We also get Services and Manufacturing PMI data today and PCE Price Index on Friday. Chair Powell is set to testify on Tuesday 9am CT.
Key levels:
Jan 2025 High: 76.57
2025 High: 78.40
2025 CVAH(Composite Value Area High): 75.68
Key LIS zone: 73.50-73.15
We anticipate the following scenarios in crude oil:
Scenario 1:
Prices remain elevated as tensions remain high, despite limited retaliation, however, the situation overall now escalated beyond return to diplomacy.
Scenario 2:
Any push towards de-escalation, unlikely in our analysis, but given the headline risk, crude prices may remain volatile and come off the highs.
Given our key LIS (Line in Sand) zone above, we favor longs above this and shorts below this zone.

S&P 500 Daily Chart Analysis For Week of June 20, 2025Technical Analysis and Outlook:
The S&P 500 Index has primarily exhibited downward trends during this week’s abbreviated trading session, narrowly failing to reach the targeted Mean Support level of 5940, as outlined in the previous Daily Chart Analysis. Currently, the index exhibits a bearish trend, suggesting a potential direction toward the Mean Support level of 5940, with an additional critical support level identified at 5888.
Contrariwise, there exists a substantial likelihood that following the accomplishment of hitting the Mean Support of 5940, the index may experience recovery and ascend toward the Mean Resistance level of 6046. This upward movement could facilitate a resilient rally, ultimately topping in the completion of the Outer Index Rally at 6073, thereby enabling the index to address the Key Resistance level situated at 6150.

EUR/USD Daily Chart Analysis For Week of June 20, 2025Technical Analysis and Outlook:
During this week's trading session, the Eurodollar has encountered a significant decline, dipping below the Mean Support level of 1.149; however, it exhibited a modest recovery on Friday. Recent analyses indicate that the Euro is likely to decrease further to the Mean Support level of 1.148, with the potential for extending its bearish trend to reach 1.140. Nevertheless, there remains a possibility that the current recovery will persist, which could result in price movements targeting the Key Resistance level at 1.158 and potentially leading to a retest of the Outer Currency Rally's 1.163 mark.

Bitcoin(BTC/USD) Daily Chart Analysis For Week of June 20, 2025Technical Analysis and Outlook:
In the recent trading session, Bitcoin exhibited an upward trend; however, it subsequently experienced a significant decline from the established Mean Resistance level at 110300. On Friday, Bitcoin exhibited notable price action, characterized by a pump-and-dump scenario. At this juncture, Bitcoin is retracing downwards as it seeks to approach the Mean Support level at 101500 and the ultimate Inner Coin Dip at 96500. It is essential to acknowledge the potential for an upward rally from the Mean Support levels of $101500 and/or the Inner Coin Dip at $96500. Such a rally could culminate in a retest of the Mean Resistance level at $107000.

Rising Geopolitical Tension (Iran Conflict) Signals Market RiskMoving Partially to Cash (VEA, QQQ, TQQQ, SPY, TECL, SOXL)
The global market is entering a high-risk environment. Geopolitical escalation, particularly the growing threat of direct US involvement in a military conflict with Iran, is pushing global uncertainty to new highs. Tensions in the Middle East, rising oil and gold volatility, and increased friction between major world powers all point toward a potential market breakdown. On the chart, VEA ETF is showing signs of topping out within a rising wedge pattern. Meanwhile, institutional funds are starting to reduce exposure to high-risk assets. I'm taking partial profits and shifting to cash across VEA, QQQ, TQQQ, SPY, SOXL, and TECL to preserve gains. Buy-back zones are set around 53.00, 48.00, and 44.00. In an environment of global escalation and rapid risk-off sentiment, active portfolio defense is more important than passive hope.

WTI on high time frame , price reach 60$?
"Hello friends, focusing on WTI, the price is currently in a bullish trend on the daily time frame. During the last NY session, the price swept liquidity in the $66 zone and faced a strong rejection. Considering both technical analysis and fundamental news, I believe the price is gearing up for a decline, with the initial target likely around $60."
If you need further clarification or have more details to discuss, feel free to share!
