How to Stop Overcomplicating It ? Become Master of One KickHey whats up traders. Trading is not easy, but today I want to show you how it can be easier. First we need to ask questions. What is the goal of the trader ?
You probably answered - to make money. Yes I get it.
But money is the result of something which is much more important - Discipline , Following the system, Trading plan, Your routines , Risk management etc..
📌 I would lay it down this way:
The goal of the trader is to create a system with narrowed criteria for the each element of the trade and following it no matter what. Then money comes and trading is easier.
📌 Trading System
When you approach you chart differently every time, then you cant have consistent system but just overfitting what you see on chart to the patterns, that just fits in to it right now - Butterfly, Head&Shoulders, Crab, Triangle, Wedge, Channel, Cup&Handle.
Im not saying you cant make profits by trading these pattens. But how can traders who are has different pattern on each chart have consistent results and be consistently improving over time ?
Im also not saying that one of mentioned patterns is bad. None of the strategy is superior to other. Who makes it powerful is trader himself by mastering it.
📌 I would refer to the master Bruce Lee - 1 Kick - 10 000 times.
Whatever is your trading pattern stick to the one and become master. Know it upside down in every market conditions and learn market context and key levels. Know its weakness and when it is powerful. 👊One Kick 10 000 times will help you will make you confident master/b] 👇
- No more subjective decisions
- Not pattern guessing and fitting to price action
- Not overthinking - Still doing same setup, you ,know it works
- Fixed SL and TP, RR - No guesswork
- Can be practiced - Backtested
- Become Confident - Knowing your Win rate
- Eliminate - Fear, Greed, Over Trading
- Repetitiveness builds - Confidence and Clarity
- Confidence and Clarity leads to Improvements
- Improvements leads to the Mastery
🧠 I came to trading for the money. But it gave me presence, spirituality, discipline, resilience and peace in the chaos. Everything changed for me when I stopped looking for better strategy, but started to focus on my self and my daily routines and process to make everything more mechanical. And mainly journaled and described every process step by step. Strategy is 20% of success 80% is your mind.
🧪If you don't have you strategy or want inspiration here I described my mechanical Trading approach. 🔗 Click the picture below to learn more. 👇https://www.tradingview.com/chart/BTCUSDT.P/PkQJvVm4-Complete-system-for-Day-Swing-Traders/ Adapt what you find useful and reject useless what works for me is might not for you.
‼️ Pattern is trade setup. Not a strategy. You need to define the following.
- Market context - When and Where your pattern occurs
- Key Level - On what key levels you will be trying your pattern
- Trade Setup - Thats your pattern - H&S, Pinbar, Range, Butterfly ...
- Trade Plan - Describe the process, when and how
- Daily Routine - Describe how you will work day by day
- Risk Management Rules - What is your targets, Max loss
- Trading Journal - What data sets you will be collecting about trades
🧩 Market Context
you pattern can occur in a different market phases but only some will be profitable, you need to filter out the low probability conditions. So Im never looking for the setup if there is no pullback at least 50% from high of the swing. Because this can happen hence trade setup entry must always occur from a key level after the 50% pullback. How to do it I describde in the post previous trying view post. 🔗 Click the picture below to learn more. 👇 🧩 Key Level
as I described it higher , if not trading reversal. Im never buying without a 50% pullback hence Im looking for my key levels placed after a 50% pullbacksIm never buying in the premium prices. Always want a pullback to the discount. For me works best Order block. In other words SD zone. Strong areas of the institutional activity that created imbalances. Here are the key points for high probability order block key level as you see on the picture above order block must occur in the liquidity zone. I have described it in the this post. 🔗 Click the picture below to learn more. 👇https://www.tradingview.com/chart/GBPUSD/FyBT0H1q-Liquidity-in-Trading-The-Basics-
🧩Trade Setup
now this is the pattern. Whatever is your pattern it can be consistency working only if you have defined Market context and Key Levels. There you want have your pattern to occur, for me its range manipulation and then Im following these two entry methods.
📌 Bullish continuation setups
Model 1 - Entry after manipulation - 50% target
Model 2 - Entry on pullback on level between 61.8 - 80% pullback 📌 Bearish Continuation setups
Model 1 - Entry after manipulation - 50% target
Model 2 - Entry on pullback on level between 61.8 - 80% pullback 🧩 Trade Plan
in a trade plan you should describe your process how you gonna do step by step approach of the market context , key level trade setup and how you make it all working. Also knowing when not to trade is might most important. And column for your recent mistakes is vital, because by reminding your mistakes every day is a first step to eliminate them next time.
Im reading it every time before going to trade and constantly improve it.
🧩 Daily Routine
as a trader you want to trade systematically and you want to eliminate all possible distraction that comes from the online world and mainly you want to specify your times when you gonna trade and when you close charts and go back to the live. This is important otherwise trading obsession and sitting by charts 12 hours a day will destroy not only your account, but also your live. Here is my simple list:
- Don't open any social media, and turn off all notifications that could distract your focus,
- Check economic calendar for high-impact news
- Update charts, Levels, Ranges and market context as a first thing on Tradingview
- Go thru your pairs, identify HTF order flow and Liquidity and ranges
- Mark out valid higher time frame Order blocks
- Mark out valid ranges , Setup alarms
- Wait for the range manipulation and execute
- If Price action is not clear don't force a trade, skipping a trading session without hesitation is a level of maturity
As a day trader you should focus only to one trading session. London or New York. Here I described how to approach London session Click the picture below to learn more. 👇https://www.tradingview.com/chart/BTCUSDT.P/XxzXz7Ll-High-probability-strategies-for-the-London-Session/ 🧩 Risk Management Rules
now Im not talking about a risk per trade, but knowing your targets. And not having that you must reach them every month. But having them as your stop and prevention from overtrading. There is nothing more frustrating than having a great week and destroy all work at Friday. Hence:
- Daily Target - 3R - 0.5% risk = 1% // 1% = 2%
- Weekly Target - 6R - 0.5% risk = 2% // 1% = 4%
- Monthly Target - 20R - 0.5% risk = 8% // 1% = 16%
- Stop trading for the day when >3R is locked,
Stop trading for the week when >6R is locked don't stop analyzing, but take only A+ setup, backtest, and journal... 6R is amazing profit in a week you dont need more, if you not making the living with 6R weekly gain, you need more capital - use prop firms.
🧩 Journal is key to the consistent grown as a trader
decide what data sets about your strategy you will be collecting in order to improve it.
Always do screenshot when entering and add all information it will also keep you from overtrading and clicking to often. Make sure you have in your journal formula to measure your average win rate, profitability for days of the week. Also monitor your emotions and try to describe them so you know where you are whats need to be eliminated.
So to summarize trading is not easy and if thumbnail with easy way to trade catches your attention I hope you are not disappointed, because it's not about a strategy but about you. How organized and prepared you are then you can be disciplined and successful.
Hope you get some inspiration - Adapt useful , Reject useless, become master of 1 kick.
David Perk aka Dave Fx Hunter
Risk Management
How to Set a Stop Loss in Price Action Trading Forex Explained
Wrong stop loss is one of the main reasons why newbie traders lose money.
I will share with you a proven stop loss strategy for price action trading Forex.
I will explain how to identify a safe stop loss level for any chart part, trend line and a breakout that you trade.
Learn how to set a safe stop loss easily on any time frame and no matter whether you are day trading, scalping or swing trading.
To correctly put a stop loss for trading price action in forex market, first, let's discuss 2 major types of price action patterns that you should know.
Trend line based patterns
The first type of patterns is called trend line based patterns.
In this category, we put all the patterns where trend lines are used as entries or confirmations.
Here is the list of these patterns:
Rising/falling parallel channels,
Rising/falling wedges,
Rising/falling expanding wedges/channels.
For example, in a rising parallel channel, its support is a strong vertical structure. It provides a safe place to buy the market from.
Alternatively, its breakout will provide a strong confirmation to sell.
Horizontal neckline based patterns
The second type of patterns is called neckline based patterns.
In this category, we include all chart patterns that lie on a horizontal neckline.
A signal that we rely on to trade these patterns is a breakout of their necklines.
Here is the list of these patterns:
Double top/bottom,
Head and shoulders and inverted one,
Ascending/descending triangle,
Cup and handle and inverted one.
Here is how we set a stop loss in trend line based patterns.
If we buy the market from a support line of a wedge or a channel, expecting a growth, we will need to the last bearish movement from the high of the pattern to the point where it touches a support line - our entry.
Our safe stop loss will be 1.272 fibonacci extension (from its high to low) of this movement.
If we sell the market after a breakout of a support line of a wedge or a channel, we will take the last bearish movement from the high of the pattern to the low of a breakout candle.
Our safe stop loss will be 1.272 fibonacci extension (from its low to high) of this movement.
Look how it works in practice:
If we sell the market from a resistance line of a wedge or a channel,
we will take the last bullish movement from the low of the pattern to the point where it touched a resistance line.
Our safe stop loss will be 1.272 fibonacii extension (from its low to high) of this movement.
Look how it works in practice:
Here is a safe stop loss for selling USDJPY forex pair from a resistance of a falling wedge.
If we buy a bullish breakout of a resistance line of a wedge or a channel, we will take a bullish movement from the low of the pattern to a high of the breakout candle.
Our safe stop loss will be 1.272 fibonacci extension (from its high to its low) of this movement.
Here is how easily we can set a stop loss, using this strategy, buying a breakout of a resistance line of a falling channel on NZDUSD forex pair.
And here is how we set stop loss for neckline based patterns.
If we see a breakout of a neckline of a bearish pattern, and we want to sell, we will need to find a pattern range: a low of the neckline of the pattern and highest high of the pattern.
Based on that, we will draw fibonacci extension (from its lows to high).
Our safe stop loss will be 1.272 extension.
That is how we put a stop loss, using this method on EURUSD, trading head & shoulders.
If we buy a breakout of a neckline of a bullish pattern, our safe stop loss will be based on 1.272 extention (from high to low) of the range of the pattern - the highest high of the neckline and the lowest low of the pattern.
That is how a safe stop loss for a cup & handle pattern on EURUSD looks. I drew fib.extension from the neckline's high to pattern's low.
This simple method will help you to always put a safe stop loss.
Integrate that in your trading plan and avoid losses, trading price action.
❤️Please, support my work with like, thank you!❤️
I am part of Trade Nation's Influencer program and receive a monthly fee for using their TradingView charts in my analysis.
Position Sizing and Risk ManagementThere are multiple ways to approach position sizing. The most suitable method depends on the trader’s objectives, timeframe, and account structure. For example, a long-term investor managing a portfolio will operate differently than a short-term trader running a high-frequency system. This chapter will not attempt to cover all possible methods, but will focus on the framework most relevant to the active trader.
Equalized Risk
The most practical method for position sizing is known as equalized risk per trade. This model ensures that each trade risks the same monetary amount, regardless of the stop loss distance. The position size will be calculated based on the distance between the entry price and the stop loss, which means a closer stop equals more size, where a wider stop equals less size. This allows for a more structured and consistent risk control across various events.
Position Size = Dollar Risk / (Entry Price − Stop Price)
Position Size = Dollar Risk / (Entry Price × Stop in %)
For example, an account size of $100,000 and risk amount of 1% will be equivalent to $1,000. In the scenario of a $100 stock price, the table below provides a visual representation of how the position size adapts to different stop loss placements, to maintain an equalized risk per trade. This process can be integrated into order execution on some trading platforms.
The amount risked per trade should be based on a fixed percentage of the current account size. As the account grows, the dollar amount risked increases, allowing for compounding. If the account shrinks, the dollar risk decreases, which helps reduce the impact of continued losses. This approach smooths out the effect of random sequences. A percentage-based model limits downside exposure while preserving upside potential.
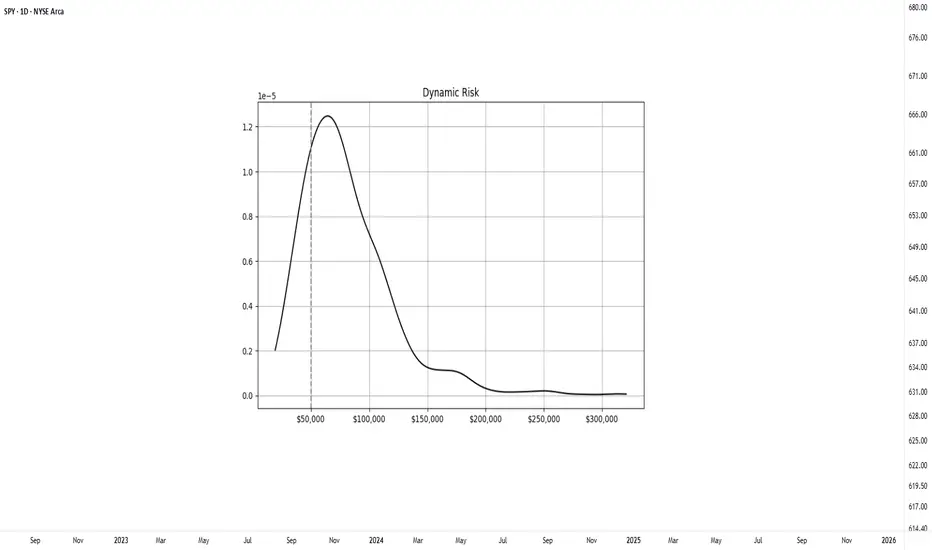
To better illustrate how position sizing affects long-term outcomes, a controlled simulation was conducted. The experiment modeled a system with a 50% win rate and a 1.1 to 1 average reward-to-risk ratio. Starting with a $50,000 account, the system executed 500 trades across 1000 separate runs. Two position sizing methods were compared: a fixed dollar risk of $1000 per trade and a dynamic model risking 2% of the current account balance.
Fixed-Risk Model
In the fixed-risk model, position size remained constant throughout the simulation. The final outcomes formed a relatively tight, symmetrical distribution centered around the expected value, which corresponds to consistent variance.
Dynamic-Risk Model
The dynamic-risk model produced a wider and more skewed distribution. Profitable runs experienced accelerated increase through compounding, while losing runs saw smaller drawdowns due to self-limiting trade size. Although dynamic risk introduces greater dispersion in final outcomes, it allows scalable growth over time. This compounding effect is what makes a dynamic model effective for achieving exponential returns.
A common question is what percentage to use. A range between 1–3% of the account is generally considered reasonable. Too much risk per trade can quickly become destructive, consider that even profitable systems may experience a streak of losses. For instance, a series of five consecutive losses at 10% risk per trade would cut the account by roughly 41%, requiring over a 70% return to recover. In case catastrophic events occur; large position sizing makes them irreversible. However, keeping position size and risk too small can make the entire effort unproductive. There is no such thing as a free trade, meaningful reward requires exposure to risk.
Risk Definition and Stop Placement
Risk in trading represents uncertainty in both the direction and magnitude of outcomes. It can be thought of as the potential result of an event, multiplied by the likelihood of that event occurring. This concept can be formulated as:
Risk = Outcome × Probability of Outcome
This challenges a common assumption that using a closer stop placement equals reduced risk. This is a common misconception. A tighter stop increases the chance of being triggered by normal price fluctuations, which can result in a higher frequency of losses even when the trade idea is valid.
Wide stop placements reduce the likelihood of premature exit, but they also require price to travel further to reach the target, which can slow down the trade and distort the reward-to-risk profile. An effective stop should reflect the volatility of the instrument while remaining consistent with the structure of the setup. A practical guideline is to place stops within 1–3 times the ATR, which allows room for price movement without compromising the reward-risk profile.
When a stop is defined, the distance from entry to stop becomes the risk unit, commonly referred to as R. A target placed at the same distance above the entry is considered 1R, while a target twice as far is 2R, and so on. Thinking in terms of R-multiples standardizes evaluation across different instruments and account sizes. It also helps track expectancy, maintain consistency, and compare trading performance.
In summary, risk is best understood as uncertainty, where the outcome is shaped by both the possible result and the probability of it occurring. The preferred approach for the active trader is equalized risk per trade, where a consistent percentage of the account, typically 1–3%, is risked on each position regardless of the stop distance. This allows the account to develop through compounding. It also reinforces the importance of thinking in terms of sample size. Individual trades are random, but consistent risk control allows statistical edge to develop over time.
Practical Application
To simplify this process, the Risk Module has been developed. The indicator provides a visual reference for position sizing, stop placement, and target definition directly on the chart. It calculates equalized risk per trade and helps maintain consistent exposure.
The Comeback Urge - When a Loss Feels PersonalNOTE – This is a post on mindset and emotion. It is not a trade idea or strategy designed to make you money. My intention is to help you preserve your capital, focus, and composure so you can trade your own system with clarity and confidence.
We saw some very deep sell offs towards the end of last week.
Imagine this if you will.
You’ve just taken a loss.
This one is not catastrophic, but it stings.
You replay it in your head.
What you could’ve done differently.
Where you should’ve cut.
What you should’ve seen.
And before the dust even settles, there’s an urge .
To get back in.
To “come back strong.”
To show the market and yourself that you’ve still got it.
At first, it feels like determination.
But look closer.
That energy coursing through your body isn’t calm focus.
It’s agitation.
Your jaw tightens.
Your breath shortens.
Your shoulders inch forward toward the screen.
Your system has just taken a hit not just financially, but emotionally.
Your identity as a capable, disciplined trader feels threatened.
And the impulse to trade again isn’t about opportunity.
It’s about redemption.
You’re not trying to win the market back.
You’re trying to win yourself back.
What’s really happening:
After a loss, your mind scrambles to restore equilibrium.
It wants to prove you’re still competent, still in control.
But trading from that place rarely ends well
Because the next trade becomes about repairing ego, not executing process.
It’s subtle, but powerful:
You’re no longer trading the chart.
You’re trading your self-image .
How to shift it:
Pause.
Acknowledge the emotional hit - not with judgment, but awareness.
Let the nervous energy move through your system without acting on it.
Remind yourself: “This is biology, not skill decay.”
You haven’t lost your edge, you’ve just been knocked off-center.
When you can sit in that discomfort without needing to erase it
That’s when emotional maturity starts replacing emotional reactivity.
And that’s not just psychology - it’s edge .
Because trading well doesn’t just depend on your system. It depends on your state .
Ask yourself:
When I rush to make it back,
What part of me am I really trying to fix?
The moment you can see that the need to prove, to redeem, to make it right is coming from ‘make back’
You stop trading from the wound and start trading from awareness.
And that’s where consistent performance begins
If this resonated, please check out my post on FOMO. H'ere's the link:

Why I Didn’t Buy Gold in the Last Few WeeksI’ve been bullish on gold since the beginning of the year — expecting it to reach $3000, and in a very optimistic scenario, maybe even $3500. My previous posts are proof of that.
But I definitely wasn’t expecting $4000, and certainly not $4200, for one simple reason:
Some time ago, my crystal ball broke, and since then I’ve been trying to base my trades on technical analysis and what I’ve actually seen happen in the past — not on wishful thinking.
________________________________________
When Price Doesn’t Correct, But You Still Profit Selling
Ever since gold hit the $3700–$3800 zone, I’ve been expecting a correction.
It never came.
Even so, I still made money selling against the trend — something I usually avoid and definitely don’t recommend anyone to do.
But this post isn’t about my trades. It’s about why I didn’t buy gold in the last two or three weeks.
And the answer is right there — on the chart.
________________________________________
The Chart Tells the Truth
If you look closely, you’ll see yellow rectangles highlighting the sharp drops that happened during this period.
It’s easy to look at the chart after the fact and say:
“I should’ve bought there.”
But imagine you don’t see the right side of the chart.
You’re sitting in front of your screen, looking at the current price, trying to decide what to do.
And then — within minutes — gold drops 700-800 pips out of nowhere.
No signal. No alert on WhatsApp. No warning.
Where do you put your stop?
Do you trade without one?
Just because you know it will bounce?
And what if it doesn’t?
What if it drops another 1000 pips — the same way it just did — without even breathing?
That’s not trading. That’s hope disguised as confidence.
________________________________________
This Is an Exercise in Honesty
This is an exercise in honesty with yourself — not after you’ve seen the chart.
How many of you would’ve stayed in a position that’s -500 pips, just because you “know” it will turn around?
Even now, right after I finished recording the video, it dropped another 500+ pips like it was nothing.
I’ve explained this a thousand times:
1. If a trade is not there, it’s not there. Period.
I don’t force it. I don’t FOMO.
2. A trade must have a clear entry, stop, target — and most importantly, a reason.
“Gold is rising, can’t you see?” is not a reason. It’s FOMO.
________________________________________
If You Want to Be a Real Trader, Remember This
1. The market has two directions, even when it looks like it only has one.
2. In aggressive trends, even my cat becomes a great trader.
3. Every trade must have a clear reason. If it doesn’t, and you enter just because “it’s going up”, that’s FOMO — and we all saw what happened to crypto in 2021. People are still waiting for the mythical altcoin season, while some are still 70- 90% down on the bag
4. We’re all geniuses after seeing the chart: “should’ve bought there, closed there…”
5. The only real truth is in your equity — and mine is higher, even though I’ve been selling.
6. I can guarantee there are gold bulls reading this right now who lost money on long positions over the past month.
7. In the end, it all comes down to money management and timing.
________________________________________
Conclusion:
Trading isn’t about being bullish or bearish.
It’s about being disciplined, timing and money management; the rest is can-can, and "I told you so"
P.S. Once again, I’m looking to sell — and if it works out like my last five trades, that’s perfectly fine with me.
At the club, they don’t ask whether I paid for my champagne with profits from buying or selling gold. 🍾

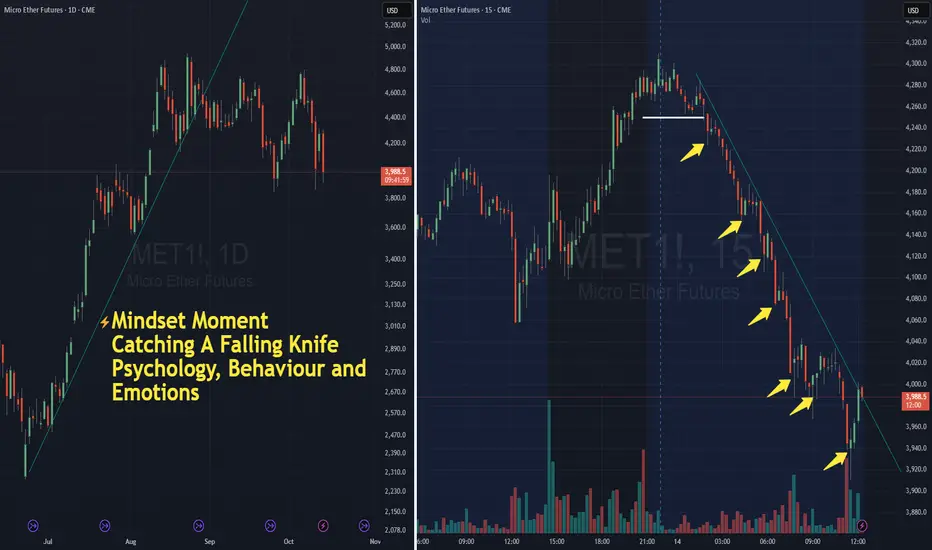
Catching a Falling Knife - The Illusion of OpportunityNOTE – This is a post on mindset and emotion. It is NOT a trade idea or system designed to make you money. My intention is to help you preserve capital, energy, and focus — so you can execute your own trading system with calm and confidence.
A sharp selloff.
Price is plunging.
The chart looks like it’s gone too far .
Your eye zooms in on that last swing low - “It has to bounce here.”
You tell yourself you’re being brave… opportunistic… disciplined even.
Beneath the surface, something else is driving the impulse.
A need to get involved and capitalize on opportunity
A need to relieve tension and fomo
A belief that there’s value here.
A sense of excitement. Things are moving.
A chance to make back all that I’ve lost before - plus more.
When markets fall fast, the nervous system reacts.
Adrenaline spikes.
The body wants to do something - to turn impulse into action.
To buy the bottom feels like you’ve beaten the market. That you’ve proven that you can do this and that you’re really really clever.
But every time you step in too soon, the same pattern repeats:
You’re not trading your process
You’re trading your emotions, your sense of self worth and lets be honest
Face it. You’ve been hijacked.
Body cues:
Eyes darting across screens, scanning for reversal signals.
Shoulders tense, leaning closer to the monitor.
A restless tapping of fingers or bouncing knee as you wait for confirmation.
Breath shortening, shallow and quick.
Underlying belief:
“If I can catch this, I’ll prove that I’m right”
How to shift it:
When you feel that urge to step in early, force a pause.
Name what’s really happening: “My mind wants action, and it wants to be right ”. Ask the question
“Do I want to be right or do I want to make money?”
Then redirect that energy toward process - not action.
Waiting doesn’t make you passive.
It’s an act of discipline and power.
Remember Eddie Murphy and Dan Ackroyd in Trading Places.
The art of waiting for the moment, and then engaging is the mark of a disciplined professional trader.
Stay safe out there and live to trade another day
For another related post, check out this one on buying the dip
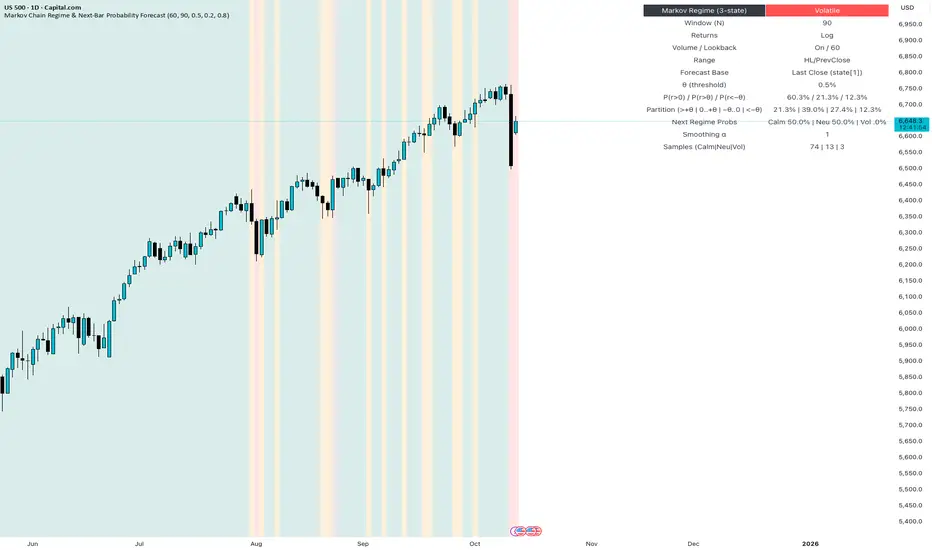
HOW-TO: Forecast Next-Bar Odds with Markov ProbCast🎯 Goal
In 5 minutes, you’ll add Markov ProbCast to a chart, calibrate the “big-move” threshold θ for your instrument/timeframe, and learn how to read the next-bar probabilities and regime signals
(🟩 Calm | 🟧 Neutral | 🟥 Volatile).
🧩 Add & basic setup
Open any chart and timeframe you trade.
Add Markov ProbCast — P(next-bar) Forecast Panel from the Public Library (search “Markov ProbCast”).
Inputs (recommended starting point):
• Returns: Log
• Include Volume (z-score): On (Lookback = 60)
• Include Range (HL/PrevClose): On
• Rolling window N (transitions): 90
• θ as percent: start at 0.5% (we’ll calibrate next)
• Freeze forecast at last close: On (stable readings)
• Display: leave plots/partition/samples On
📏 Calibrate θ (2-minute method)
Pick θ so the “>+θ” bucket truly flags meaningful bars for your market & timeframe. Try:
• If intraday majors / large caps: θ ≈ 0.2%–0.6% on 1–5m; 0.3%–0.8% on 15–60m.
• If high-vol crypto / small caps: θ ≈ 0.5%–1.5% on 1–5m; 0.8%–2.0% on 15–60m.
Then watch the Partition row for a day: if the “>+θ” bucket is almost never triggered, lower θ a bit; if it’s firing constantly, raise θ. Aim so “>+θ” captures move sizes you actually care about.
📖 Read the panel (what the numbers mean)
• P(next r > 0) : Directional tilt for the very next candle.
• P(next r > +θ) : Odds of a “big” upside move beyond your θ.
• P(next r < −θ) : Odds of a “big” downside move.
• Partition (>+θ | 0..+θ | −θ..0 | <−θ): Four buckets that ≈ sum to 100%.
• Next Regime Probs : Chance the market flips to 🟩 Calm / 🟧 Neutral / 🟥 Volatile next bar.
• Samples : How many historical next-bar examples fed each next-state estimate (confidence cue).
Note: Heavy calculations update on confirmed bars; with “Freeze” on, values won’t flicker intrabar.
📚 Two practical playbooks
Breakout prep
• Watch P(next r > +θ) trending up and staying elevated (e.g., > 25–35%).
• A rising Next Regime: Volatile probability supports expansion context.
• Combine with your trigger (structure break, session open, liquidity sweep).
Mean-reversion defense
• If already long and P(next r < −θ) lifts while Volatile odds rise, consider trimming size, widening stops, or waiting for a better setup.
• Mirror the logic for shorts when P(next r > +θ) lifts.
⚙️ Tuning & tips
• N=90 balances adaptivity and stability. For very fast regimes, try 60; for slower instruments, 120.
• Keep Freeze at close on for cleaner alerts/decisions.
• If Samples are small and values look jumpy, give it time (more bars) or increase N slightly.
🧠 Why this works (the math, briefly)
We learn a 3-state regime and its transition matrix A (A = P(Sₜ₊₁=j | Sₜ=i)), estimate next-bar event odds conditioned on the next state (e.g., q_gt(j)=P(rₜ₊₁>+θ | Sₜ₊₁=j)), then forecast by mixing:
P(event) = Σⱼ A · q(event | next=j).
Laplace/Beta smoothing, per-state sample gating, and unconditional fallbacks keep estimates robust.
❓FAQ
• Why do probabilities change across instruments/timeframes? Different volatility structure → different transitions and conditional odds.
• Why do I sometimes see “…” or NA? Not enough recent samples for a next-state; the tool falls back until data accumulate.
• Can I use it standalone? It’s a context/forecast panel—pair it with your entry/exit rules and risk management.
📣 Want more?
If you’d like an edition with alerts , σ-based θ, quantile regime cutoffs, and a compact ribbon—or a full strategy that uses these probabilities for entries, filters, and sizing—please Like this post and comment “Pro” or “Strategy”. Your feedback decides what we release next.
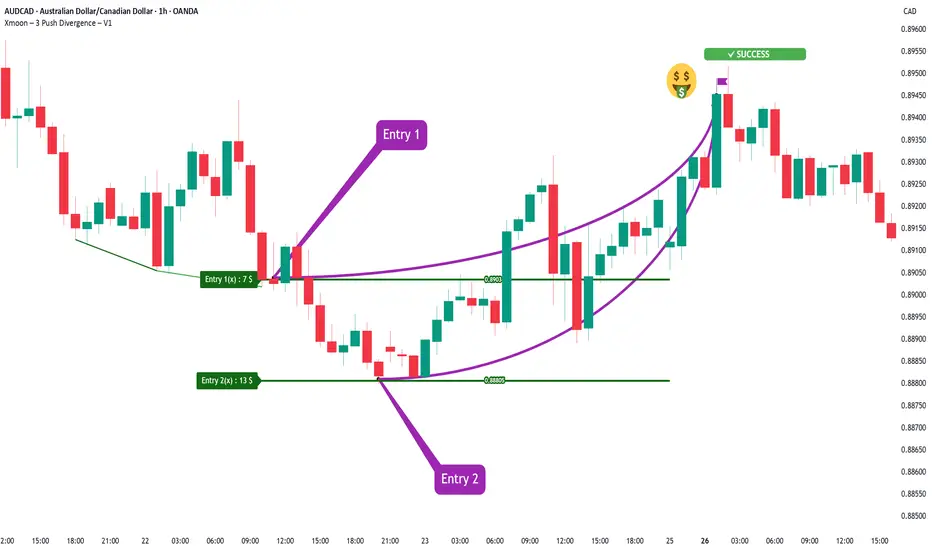
Xmoon Indicator Tutorial – Part 3 – Step Entry (DCA Entry)📘 Xmoon Indicator Tutorial – Part 3
🎯 Step Entry (DCA Entry)
Step-by-step entry, also known as DCA (Dollar Cost Averaging), is one of the key parts of the Xmoon – 3 Push Divergence strategy.
🔹 Why is it important?
After a 3 Push Divergence pattern appears, the market usually doesn’t reverse immediately.
It often moves a bit further in the same direction before turning back.
If we put all our capital in at once, the risk of liquidation increases.
🔹 The solution
We split the capital into several parts and enter the market step by step:
✦ If the market doesn’t reverse from Entry 1 , the chance of reversal at Entry 2 is higher
✦ If it doesn’t reverse from Entry 2, the chance at Entry 3 increases even more
✦ And so on — with each new step, the probability of reversal grows
Benefits of step entries:
✅ Lower overall risk
✅ Higher win rate
✅ Positions reach the Risk Free point faster
📣 If you have any questions or need guidance, feel free to ask us. We’d be happy to help.
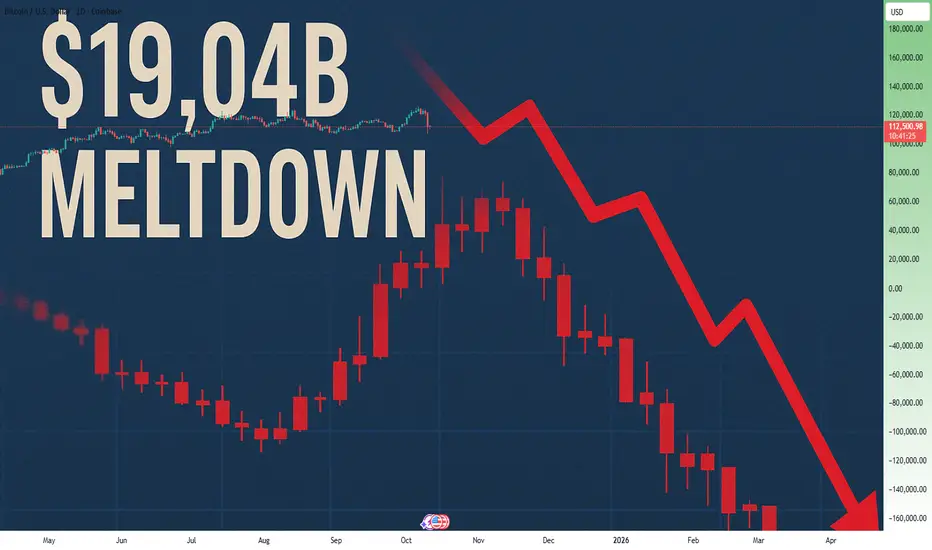
The Crypto Crash: A Brutal Reminder of What MattersLast night, the crypto market went through one of its ugliest moments in history — a true bloodbath.
What began as a reaction to Trump’s tariff announcement quickly turned into a historic liquidation cascade that wiped out over $19 billion in leveraged positions within few hours.
More than 1.6 million traders were liquidated. Bitcoin dropped over 10%, Ethereum and Solana fell even harder, and many small altcoins collapsed by 40–50%, some even more.
It wasn’t just volatility — it was destruction.
Was It Manipulation? Probably.
Everyone was long.
Everyone expected a rally.
Then, as often happens in overleveraged markets, someone pulled the plug. Prices were smashed down violently, liquidations fed liquidations, and what followed looked less like a correction and more like a coordinated sweep.
I’m not the one to shout “manipulation” at every dip — but let’s be honest: this one felt orchestrated.
Still, as they say, all’s fair in love and war . And markets are war . Which means you can’t complain — you have to adapt.
The Real Lesson: Survive First, Profit Later
If there’s one thing this crash reminds us of, how risky leverage is.
Used wisely, it amplifies returns.
Used recklessly, it destroys accounts — fast.
Most traders didn’t got liquidated because they were wrong about direction.
They got liquidated because they were overexposed.
When a 10% drop in Bitcoin wipes out your entire account, the problem isn’t the market — it’s your risk management.
How to Trade Like a Professional
1. Trade with controlled risk.
Never risk more than a small percentage per trade. If you don’t know your stop-loss level before you enter, you’re gambling, not trading.
2. Have a plan.
Every position must have an entry, a target, and an exit plan for when you’re wrong. A trader without a plan becomes prey when the market turns.
3. Avoid leverage on small altcoins.
Alts move fast, lack liquidity, and often get manipulated. Using leverage on them is financial suicide. Stick to spot.
4. Stay realistic.
The market doesn’t owe you a 10x move. Take profits, manage downside, and avoid getting caught in collective optimism.
5. Focus on survival.
Capital preservation is victory in itself. If you can stay in the game after a crash like this, you’ve already beaten 80% of the crowd.
Final Thoughts
Yes, my portfolio is down too. But I’m not panicking — because I wasn’t leveraged, and I had a plan.
Those who treat trading like war — disciplined, strategic, prepared — survive.
Those who treat it like a casino, don’t.
So let this $19B liquidation serve as a brutal reminder:
Don’t trade based on hope, hype, or herd behavior.
Trade with control, clarity, and courage.
Because in markets, like in war — survival always comes before victory.
Why traders are losing money? Position Size PurposeWhy traders are losing money
Most traders do not lose because the market is hostile or because entries are bad. They lose because the size of each position is out of sync with account size, with volatility, and with a realistic pain threshold. They also stack correlated exposure until a normal downswing becomes a career ending drawdown. The fix is a repeatable sizing process that keeps losses small, keeps risk per trade constant across regimes, and caps total open risk across the book.
Root causes of loss clustering
Risk per trade that is too large for the real account balance that is available for trading
Stops that ignore volatility so a quiet week and a fast week carry the same unit count while loss size swings wildly
Portfolio heat that compounds across correlated positions in the same theme or factor
Inconsistent exits so a written stop is moved or ignored after the position is open
Scaling rules that add size before the trade earns the right to carry more risk
A review loop that tracks money rather than R so results are not comparable across instruments
One principle to anchor the lesson
Risk lives in the distance between entry and stop. Size lives in how much money you are willing to risk on that distance. Everything else is detail. When you fix these two elements the account stops bleeding from one mistake and the equity curve starts to respect your personal pain limits.
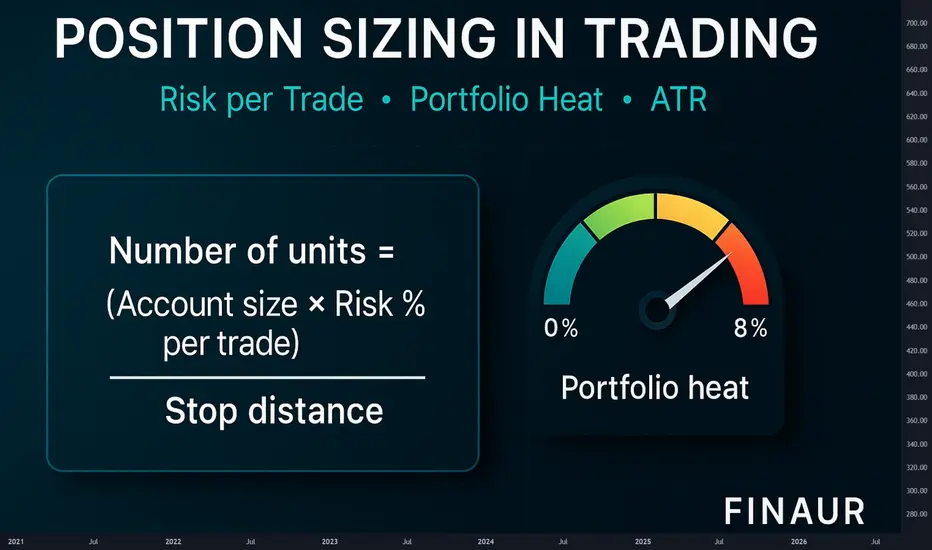
The unit formula in plain words
Units equals Account times Risk percent divided by Stop distance
Stop distance equals Entry minus Stop in price units
For futures or forex convert the distance to money with tick or pip value before you divide
Round the result to the venue step size
Percent risk formula and worked example
Set a realistic risk percent
Pick a range between zero point two five and one point zero percent of account per trade
If you are new stay closer to zero point two five
If you are experienced and you follow rules under pressure stay near zero point five to one point zero
Use only capital that is truly available for trading
Define the stop with intent
You can define a stop by price structure or by volatility. Structure is a level that invalidates the setup. Volatility is a multiple of the average true range. Both work if you keep the rule stable. The aim is not to predict a perfect level. The aim is to measure distance so you can compute size with precision and keep loss per trade constant in money terms.
Volatility aware sizing
When the average true range doubles you must expect larger swings. If you keep the same unit count the same entry to stop distance will cost twice as much. A simple way to neutralise this effect is to tie the stop to a multiple of the average true range and then let the unit count float. When volatility rises the unit count shrinks. When volatility calms the unit count grows. Risk per trade stays constant.
Practice example
Risk money equals one hundred
Stop distance equals three point zero in a calm regime
Units equals one hundred divided by three which is thirty three units rounded
If volatility doubles and the stop distance becomes six point zero the new unit count becomes sixteen units rounded
Loss per trade stays near one hundred in both regimes
Portfolio heat in clear numbers
Portfolio heat is the sum of risk money across all open trades as a percent of account. If you allow the sum to balloon during correlated trends you are betting the entire account on one theme. A simple cap keeps you in business.
Set a heat cap between four and eight percent of account
Count correlated positions as one theme for heat
If a new trade would push heat above the cap you must reduce size or defer the trade
Keep a cash buffer for slippage and gap risk
Heat includes correlated risk. Keep combined open risk under your limit
R multiple as the common unit
R is the unit that equals your risk per trade. If you risk one hundred then one R is one hundred. A two R gain is two hundred. A one R loss is one hundred. Because R normalises money across instruments and timeframes you can compare strategies without confusion. When you review your trades in R the mind stops obsessing about price and starts focusing on process.
Expectancy in words and numbers
Expectancy is the average R result per trade. It depends on win rate and payoff ratio. You do not need equations to grasp it. You can compute it with simple mental math.
Practice example A
Win rate equals forty five percent
Average win equals two point two R
Average loss equals one point zero R
For every ten trades wins contribute nine point nine R and losses subtract five point five R
Expectancy equals four point four R per ten trades or zero point four four R per trade before fees
Practice example B
Win rate equals thirty five percent
Average win equals three point zero R
Average loss equals one point zero R
For every ten trades wins contribute ten point five R and losses subtract six point five R
Expectancy equals four point zero R per ten trades or zero point four R per trade before fees
The shape of expectancy changes when volatility changes. If you keep risk per trade constant and let the unit count respond to stop distance expectancy measured in R will be more stable across regimes. That stability translates into better position control and calmer decision making.
Why money management fails in practice
Traders set a risk percent but do not compute units from entry and stop before the order
They move the stop after position entry and invalidate the size calculation
They add to losers because the entry feels almost right and average down risk with no plan
They never reduce size after a loss streak so the book enters a feedback loop where a normal downswing becomes a spiral
They treat wins as proof of skill and losses as anomalies rather than counting both in R and accepting variance
A position sizing workflow you can follow every time
Write the setup and the trigger in one line
Define the stop with a structure rule or with a multiple of the average true range
Measure the stop distance in price units
Select the risk percent that fits your current equity and your mental state
Convert the stop distance to money if the instrument uses ticks or pips
Compute units as Account times Risk percent divided by Stop distance
Round to the venue step size and check that the notional fits practical constraints
Place the order only after the number of units is in the ticket and the stop is written
Scaling with intent
Scaling is not a trick to force a trade to work. Scaling is a way to stage risk through time. The rule is simple. Add size only after the trade earns the right to carry more risk. Reduce risk when momentum fades or when volatility rises.
One simple scale plan
Enter half size when volatility is rising or when the theme is crowded
Add the second half only after the trade moves one R in your favour
Move the stop to reduce open risk when the second half is added
Do not exceed the heat cap across the book after the add
Compute size. Check heat. Execute only if rules align
Comparator versus buy and hold
Buy and hold does not respect a personal pain limit. It lets drawdown float with price. A sized trade fixes the maximum loss in money terms at the start. The difference is not ideology. The difference is the choice to survive.
Practice scenario
Price falls ten percent after entry in a fast regime
A buy and hold position shows a ten percent account drawdown if one position equals the entire account
A sized trade with one percent risk shows a one percent account drawdown by design
The sized trade can take many attempts because capital is preserved for the next signal
Kelly fraction and optimal f cautions
Kelly and optimal f are powerful in theory. They aim to maximise growth for a known edge. Real trading edges drift and sample sizes are small. Full Kelly creates deep drawdowns and can trigger a behavioural spiral. If you decide to use these methods treat the fraction as a ceiling rather than a target and remain near half Kelly or less. Always measure drawdown in R and reduce size after a loss streak.
Loss streak protocol
Loss streaks are part of variance. A simple protocol keeps them from damaging your decision cycle.
After four consecutive losses reduce risk per trade by half
Freeze adds and focus on clean entries only
Review the last ten trades in R and tag any rule violations
Return to the base risk percent only after a new equity high or after a full week of clean execution
Heat management across themes
The book is a living system. A theme can be a sector a factor a style or a macro driver. If four positions express the same theme treat them as one for heat. The market does not care that the tickers differ. Correlation in stress is the rule. The heat cap is your defence against that correlation.
Fees and slippage discipline
Small edges die from friction. If your average win is near one R and your average loss is near one R you must protect that edge by keeping fees and slippage small. Choose venues with adequate liquidity. Avoid market orders during news bursts. Use limit orders to control entry and exit where practical. Assume a realistic round trip fee in your backtests so that live results match expectations.
Journaling that actually helps
Your journal should capture rules and numbers rather than emotions alone. Use a compact template.
Setup name and trigger
Entry price and stop price
Risk money and unit count
Reason for the stop placement
Exit reason and realized R
Any deviation from the plan
Practice drills to build fluency
Speed matters during live markets. These drills train your sizing reflexes.
Drill one. Percent risk to units
Account equals twenty thousand
Risk equals one percent which is two hundred
Stop distance equals zero point eight
Units equals two hundred divided by zero point eight which is two hundred fifty units
Drill two. Volatility step change
Risk equals one hundred fifty
Stop at two average true range equals three point two which gives forty six units rounded
If the average true range rises by fifty percent the stop becomes four point eight and units become thirty one rounded
Loss per trade remains near one hundred fifty
Drill three. Futures or forex conversion
Risk equals three hundred
Stop equals twenty ticks
Tick value equals twelve point five
Stop distance in money equals two hundred fifty
Contracts equals three hundred divided by two hundred fifty which is one contract with a small buffer for slippage
Drill four. Heat check
Four open trades at one percent risk each looks like four percent heat
If three of them are the same theme treat them as one for heat
Effective heat is closer to three percent and a new trade in that theme should be deferred
Checklist before every order
Is the setup valid according to the written rule
Is the stop defined by structure or by a multiple of the average true range
Have you measured the stop distance correctly
Is the risk percent chosen and written on the ticket
Are units computed from Account times Risk percent divided by Stop distance
Does the book stay under the heat cap after this order
Are you in a loss streak that requires reduced size
Common myths to retire
Myth. Bigger size proves conviction. Reality. Bigger size proves you have abandoned process
Myth. A tight stop is always better. Reality. A stop that ignores volatility will be hit by noise
Myth. Averaging down improves price. Reality. Averaging down expands risk without proof that the idea is valid
Myth. A few big winners will save the month. Reality. A few big losers can end the year
How to adapt across timeframes
The rules above are timeframe agnostic. Shorter timeframes require tighter execution and more attention to fees. Longer timeframes require more patience and a wider cash buffer for gaps. In both cases the math does not change. You measure distance. You set risk money. You compute units. You respect the heat cap. You review in R.
Edge drift and regime change
Edges do not vanish overnight. They drift when the crowd learns the pattern or when macro drivers shift. Your sizing process makes you resilient to drift. Because risk per trade is fixed a flat or negative edge bleeds slowly and gives you time to notice and step back. If you see expectancy in R slide over a thirty or fifty trade sample reduce size and review the rule set before you push the gas again.
Putting it all together
A trader who sizes by feel can enjoy a series of quick gains and then give it back in one week. A trader who sizes by rule can be wrong half the time and still grow steadily. The difference is not superior prediction. The difference is the choice to define loss before entry to respect volatility and to cap heat so a cluster of normal losers does not become a personal crisis.
A compact template you can copy
Setup name and timeframe
Entry trigger in one sentence
Stop rule. Structure or two average true range or another clearly written rule
Account and risk percent
Stop distance in price units and in money
Units computed and rounded to step size
Heat check across the book and across the theme
Planned targets in R and exit rules
Bottom line
Risk per trade must be small and stable
Stops must respect volatility
Portfolio heat must remain inside a hard cap
Review results in R and adjust size after loss streaks
Let the unit count float with volatility so risk money per trade remains constant
Education
Education and analytics only. Not investment advice. Test every rule with historical data before risking capital. The lesson below is theory with practice drills you can apply to any liquid instrument and any timeframe.
Trading Psychology Bias Lesson: BTCUSD 1D ATR Position SizeSummary
Bias shifts judgment under stress and often decides outcomes before the order ticket. This idea converts trading psychology into rules you can apply on BTCUSD now. It uses fixed ATR stops, pre defined entries and exits, a written disconfirming note before any order, and decision grades based on rule adherence. The goal is tighter drawdowns and consistent execution across regimes.
Live context
Price 123,102
SMA 50 114,314
EMA 200 106,289
ATR 14 daily 2,882.52 which is 2.34% of price
Distance to SMA 50 is 8,788 which is 7.14%
Distance to EMA 200 is 16,813 which is 13.66%
2 x ATR equals 5,765.04 which is 4.68%
Why psychology decides the trade before entry
Real trading includes noise, limited attention, and emotion. The result is bias, a stable tendency that pulls choices away from the written rule. Bias creeps into 4 moments: setup definition, entry trigger, position size, exit and review. The fix is structure. Use 5 blocks: a 1 sentence setup, entry and stop and trail defined with ATR, a written disconfirming note, a higher timeframe check, and a post trade grade by rule adherence rather than outcome.
Theory. Core biases you must neutralize
Loss aversion . Loss pain exceeds gain pleasure and leads to widening stops or cutting winners early. Fix . Initial stop equals 2 x ATR. Trail equals 1 x ATR or a close through a moving reference. Never widen stops.
Confirmation bias . You search for evidence that agrees with your idea. Fix . Write 1 disconfirming fact before any order. Check the next higher timeframe. If it disagrees, cut size by 50% or skip.
Anchoring . You fixate on entry or a round level. Fix . Define exits on structure with ATR or a moving average close. Name the anchor in notes to reduce its pull.
Recency and availability . You overweight the last 1 to 3 candles. Fix . Use a 20 bar context rule and a weekly system review.
Overconfidence . After a win trade count and size increase without any change in edge. Fix . Cool down 2 minutes after every exit and halve next size after a large winner.
Herd and gambler’s fallacy . Late entries on wide candles and belief that streaks must continue or must reverse. Fix . Only take trades with projected reward to risk at least 2 to 1 at the planned stop and avoid high impact events.
Hindsight and outcome bias . You judge by result and rewrite rules after 1 loss. Fix . Save entry and exit screenshots and grade by rule adherence.
Status quo and endowment . You sit in positions you already own while better setups exist. Fix . Monthly retest of every holding against current rules.
Three guardrail rules for BTCUSD
Stop discipline. Initial stop equals 2 x ATR. Trail winners by 1 x ATR or by a daily close through SMA 50. Do not widen stops.
Decision hygiene. Before every order write 1 disconfirming fact and check the next higher timeframe. If the higher timeframe disagrees, cut size by 50% or skip.
Quality floor. Projected reward to risk is at least 2 to 1 at the initial stop distance.
BTCUSD 1D continuation plan with exact math
This plan assumes a breakout continuation and uses your live ATR 14. All digits are based on ATR 2,882.52 and a price above SMA 50 and EMA 200.
Setup in 1 sentence . Trend continuation long on a daily close above the recent swing with SMA 50 rising and 20 bar context bullish.
Entry trigger . Close above 124,200 confirms continuation.
Initial risk . 2 x ATR equals 5,765.04. Stop equals entry minus 5,765.04. For 124,200 the stop is 118,434.96.
Targets . 1R target equals entry plus 5,765.04 which is 129,965.04. 2R target equals entry plus 11,530.08 which is 135,730.08.
Sizing example . Equity 20,000. Risk per trade 1% equals 200. Position size equals risk divided by stop distance which is 200 ÷ 5,765.04 equals 0.0347 BTC. Notional at 124,200 is about 4,308.
Management . Trail by 1 x ATR which is 2,882.52. Move the stop only with the trail. Ignore the first single red candle to reduce recency effects.
Exit logic . Exit on a daily close below the 1 x ATR trail or use a time stop after 12 bars if 2R is not reached.
Journal cue . Before entry write 1 disconfirming fact. After exit save 2 screenshots and grade by rule adherence.
Why each step neutralizes bias in real time
Loss aversion is capped because the stop distance is fixed by ATR and never widened. The trail is mechanical.
Confirmation is checked by the written disconfirming fact and the higher timeframe review that can force a skip or a 50% position cut.
Anchoring is reduced because exits reference ATR and structure instead of entry or round numbers.
Recency is filtered by the 20 bar rule and by a weekly system review that ignores single outcomes.
Overconfidence is constrained by a 2 minute cool down and 50% next size after a large winner.
Mean reversion companion inside an uptrend
Use this only while SMA 50 and EMA 200 slope up and price trades above both averages.
Context . Pullback forms inside the 20 bar range toward short term support while SMA 50 rises above EMA 200.
Entry . Bullish rejection from a prior swing zone or a daily close back above the intraday pivot after a 2 to 3 day pause.
Risk . Initial stop equals 1.5 x ATR which is 4,323.78.
Sizing . Risk per trade 1%. Position size equals risk divided by 4,323.78. With equity 20,000 and risk 200 the size equals 0.0463 BTC.
Exit . First scale at 1.5 R. Stop to break even only after a daily close above SMA 50. Final exit at 2 R or on a daily close back into the pullback range.
Bias note . Write 1 anchor you feel and 1 disconfirming fact that would cancel the setup.
Decision checklist to paste into chart notes
Setup in 1 sentence written before entry
Entry level, initial stop, trail method defined
1 disconfirming fact written and verified
Higher timeframe checked and size adjusted if needed
Projected reward to risk is at least 2 to 1
Screenshots saved at entry and exit
Decision grade recorded by rule adherence
Position size rule you can audit weekly
Account equity E. Risk per trade equals 1% of E by default.
Stop distance equals the ATR multiple from the plan.
Position size equals risk divided by stop distance. If required size is not tradable, skip the trade.
Bias symptoms you will see on the BTCUSD chart and the fix
Loss aversion . Stops drift lower while price falls. Winners are cut early. Fix . 2 x ATR hard stop and 1 x ATR trail.
Confirmation . Indicators are added until they agree with your view. Fix . 1 written disconfirming note and a higher timeframe check.
Anchoring . Waiting to exit when price returns to entry or to a round level. Fix . Structure based exits and naming the anchor in notes.
Recency . Judgment based on the last 2 candles. Fix . 20 bar context rule and a weekly system review.
Overconfidence . Trade count jumps after a win. Fix . 2 minute cool down and 50% next size after a large winner.
Herd and gambler’s fallacy . Late entries on wide candles and streak thinking. Fix . 2 to 1 minimum reward to risk and a news ban during known high impact windows.
Hindsight and outcome bias . Rewriting rules after 1 result. Fix . Grade by rule adherence and keep entry plus exit screenshots.
Status quo and endowment . Sitting in flat positions you already own. Fix . Monthly retest of every holding against current rules.
Worked example with our numbers
Assuming a daily close above 124,200 triggers the continuation. Initial stop equals 2 x ATR which is 5,765.04. Stop equals 118,434.96. 1R target equals 129,965.04. 2R target equals 135,730.08. Equity equals 20,000. Risk equals 200. Position size equals 0.0347 BTC. As price advances you trail by 1 x ATR which is 2,882.52 and you move the stop only when the trail shifts. If the trail is hit you exit. If 12 bars pass without the 2R target you exit on time and log the decision. You do not widen the stop. You do not add size after a win. You grade the decision by rule adherence.
If momentum stalls
If a daily close rotates down toward 121,000 to 121,500 and momentum weakens, shift to neutral. Wait for a fresh setup that passes the 2 to 1 test at the planned stop.
Do not react to a single candle. The plan lives on the daily chart.
Comparator and scorecard
Use simple Buy and Hold on BTCUSD as the baseline. Score the plan by Return divided by Drawdown, Max Drawdown, and percent of trades executed exactly as written. A smaller drawdown with steady execution beats a higher raw return with poor adherence. Your best forward indicator is the discipline metric you log each week.
Education and analytics only. Not investment advice. Test any rule with historical data before risking capital.

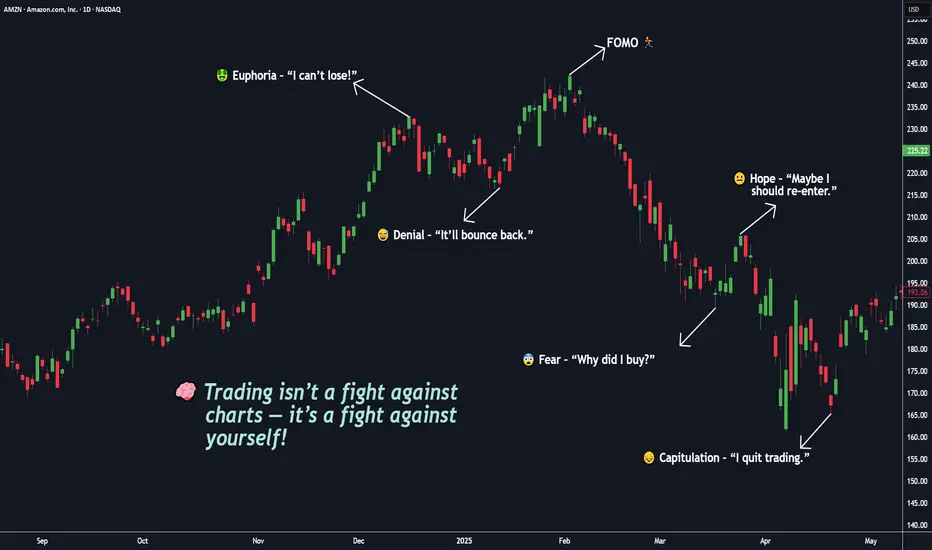
You’re Not Competing With the Market, You’re Competing With Self🧠 Trading isn’t a fight against charts — it’s a fight against yourself.
If you’ve ever told yourself “I’ll just take one more trade”, you already know this battle.
But in truth — the real battle happens inside your mind.
You start your day with discipline: BITSTAMP:BTCUSD , NASDAQ:AMZN , OANDA:XAUUSD , NASDAQ:META
📋 “ Two setups max. 1% risk. No emotions. ”
But then the market shows you something that looks perfect.
Price moves fast. Your pulse jumps. You click “BUY BUY BUY.”
Seconds later , the candle reverses — and suddenly, you chase a candle, break a rule, or move your stop just to “ give it a little more space ,” you’re not losing to the market my friend, You’re losing to your own impulses. ⚔️
You’re not trading the chart anymore — you’re trading your hope. And that’s what makes trading beautiful — it’s not a test of intelligence, it’s a mirror of your self-awareness.
That’s when the market does what it always does: it punishes emotional decisions and rewards patient ones.
💭 Emotionally! You start bargaining with yourself:
“It’ll come back.” ( When you’re greedy → it exposes it. )
“I’ll just move my stop a little.” ( When you’re fearful → it magnifies it. )
“Let me add to average out.” ( When you’re calm → it rewards it. )
The market doesn’t care if you win or lose. It simply amplifies your inner state.
You Digest it or not!, the truth most don’t want to accept:
You can’t control the market.
You can’t control news, indicators, or price spikes.
But you can control your reactions.
The moment you stop reacting and start observing — your trading transforms.
Clarity comes only when emotion leaves. 💎
⚡ Trading isn’t about predicting moves — it’s about managing yourself during those moves.
🎯 Real-Life Example:
Think back to the last time you made money on a random FOMO entry. It felt good, right?
That “instant win” wired your brain to believe impulsiveness works.
But the next time, that same instinct cost you twice as much.
That’s recency bias — one of trading’s silent killers.
Your brain craves the last emotion it felt, not the right decision.
💎 True mastery begins when you stop asking:
“Why did the market do that?”
and start asking:
“Why did I react like that?” ( 👉 “ Am I reacting, or am I responding ?” )
The market has no emotions . It’s just reflecting yours back at you — amplified, delayed, and multiplied by leverage. ⚔️
🧩 Here’s the mindset shift, that changes everything:
You don’t need to win every trade. You need to trade as if you already know yourself.
You don’t need a better indicator. You need a clearer mirror.
The edge isn’t on the screen — it’s inside your head.
When you realize that, trading becomes peaceful and You stop chasing, You start choosing.
Master that single question, and you’ll outperform 90% of traders who never will.
💬 What’s one emotion you think costs you the most trades —
👉 Fear 😨
👉 Greed 🤑
👉 Impatience ⚡
🧩 Drop it below 👇 and let’s talk about how to overcome it — build awareness together as traders, not competitors.
If this Idea gave you a value information then please, Boost it, share your thoughts in comments, and follow for more practical trading!
Happy Trading & Investing!
Team @TradeWithKeshhav
Giving Back Profits - The Trap of 'Just One More'NOTE : This is a post on Mindset and emotion. It is NOT a Trade idea or strategy designed to make you money. If anything, I’m posting this to help you preserve your capital, energy and will so you can execute your own trading system with calm, patience and confidence.
The trouble doesn’t start with the win.
It’s what happens after the win that sets the course for the unwind.
Take this scenario as an example.
You finish the morning well in the green.
You are focused, composed in flow
And then the thought creeps in:
“Just one more”
“I’m on fire.”
“Let's make it count”.
That’s when strong sessions turn into regret.
What’s really happening inside you:
Thoughts: “If I’d sized bigger earlier, I’d have more.” “Stopping now is leaving money on the table.”
Feelings: Euphoria, Invincibility. Subtle disbelief that this winning streak could end.
Behaviours: Taking marginal setups, holding too long, over-sizing.
Body cues: Elevated energy, buzzing restlessness, almost addictive “high.”
Trigger: A profitable trade or session - the buzz of winning.
This isn’t opportunity. It’s the discomfort of stopping.
Your brain has just been flooded with dopamine - the chemical of reward and anticipation.
When you stop, that rush fades fast.
The body doesn’t like the drop, so it urges you to keep going.
It’s not greed - it’s biology.
Your system is craving the stimulation that came with the win.
The mind interprets that craving as “one more setup.”
But what it’s really chasing… is the feeling of being alive in the action.
Learning to sit with that energy, without acting on it is emotional mastery.
Mastery isn’t about cutting winners it’s about knowing the difference between pressing your edge and chasing the feeling.
One comes from clarity and alignment with your plan.
The other comes from chemistry and compulsion.
Both feel powerful in the moment but only one keeps you in the game.
Once you can see that impulse for what it is a chemical pull, not true opportunity the next step is learning how to regain control before it takes you off plan.
How to shift it:
Define the finish line: set a daily stop time or target and honour it. End when you said you would. Winning traders know when to walk away.
Reframe the win: Booked profits aren’t ‘missed opportunity’. They’re proof that you’ve followed your process and protected your edge.
Closure ritual: write: “Today I protected my edge.” Train your body and mind to link stopping with success, balance and composure.
👉 The market always offers “just one more.” The pros know: the real edge is keeping what you’ve earned.
Highlighting once again the post on Non Farm for anyone that missed it. The announcement is currently rescheduled for Friday 10th (due to the US Government Shut Down). Link below:

Stop Guessing Risk — Start Measuring It Like a QuantStop deciding risk based on emotion or setup. Do what quants do. Measure volatility and let it define your risk.
Most traders size positions emotionally:
• "This setup looks strong, I’ll double size."
• "I’m not sure, so I’ll go small."
→ Both are inconsistent and lead to unstable performance.
Professionals and systematic traders use a simple principle:
Risk is not a feeling, it’s a function of volatility.
⚙️ The concept
Markets breathe in volatility cycles. When volatility expands, risk should contract.
When volatility contracts, risk can expand.
Your position size should adapt automatically to those cycles.
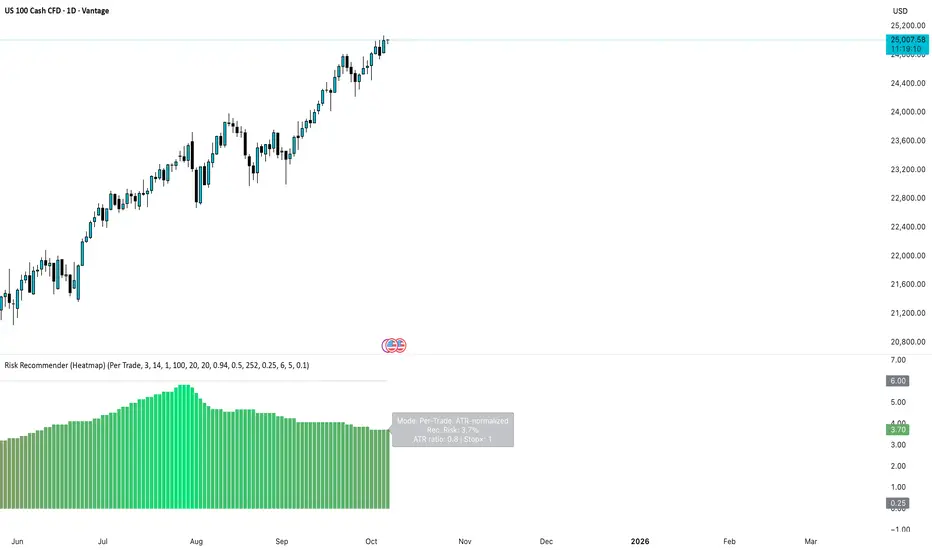
This Idea demonstrates the logic behind the new 📊 Risk Recommender — (Heatmap) indicator, a tool that quantifies how much of your equity to risk at any time.
🧮 How it works
The indicator offers two complementary modes:
1️⃣ Per-Trade (ATR-based)
• Compares current volatility (ATR) to a long-term baseline.
• When market noise increases, it suggests smaller risk per trade.
• When conditions are quiet, it recommends scaling up—within your own floor and ceiling limits.
2️⃣ Annualized (Volatility Targeting)
• Computes realized and forecast volatility (EWMA-style).
• Adjusts your base risk so your overall exposure stays near a target annualized volatility (e.g., 20%).
• The same math used in institutional risk models and CTA frameworks.
🎨 Visual interpretation
The heatmap column acts as a “risk thermometer”:
• 🟥 Red = High volatility → scale down
• 🟩 Green = Low volatility → scale up
• Smoothed and bounded between your chosen floor and ceiling risk levels.
• The label shows current mode, recommended risk %, and volatility context.
💡 Why this matters
Risk should *never* depend on how confident you feel about a trade.
It should depend on how loud or quiet the market is.
Volatility is the market’s volume knob and this indicator helps you tune your exposure to the same frequency.
📈 Example use case
• NASDAQ volatility spikes → recommended risk drops from 3.0% → 1.2%
• SPX volatility compresses → risk rises gradually → 4.5%
You stay consistent while others overreact.
🚀 Automating it
My invite-only strategy applies this logic automatically to manage exposure in real time.
Combine it with the Risk Recommender indicator for full transparency and adaptive position sizing.
🎯 Summary
✅ Stop guessing risk size.
✅ Let volatility guide you.
✅ Keep risk constant, results consistent.
That’s how quants survive. That’s how traders evolve.
#RiskManagement #Volatility #ATR #PositionSizing #Quant #TradingStrategy #AlgorithmicTrading #SystematicTrading #Portfolio #EWMA #RiskControl
Stop Losses: The Good, The Bad and The UglyLet’s be honest — few things trigger more emotion in trading than a stop loss being hit.
But not all stop losses are created equal.
Even though the title says “The Good, the Bad, and the Ugly”, let’s start with the Bad — because that’s where most traders get stuck.
________________________________________
🚫 The Bad Stop Loss
The bad stop loss is the arbitrary one.
You know the type:
“I trade with a 50-pip stop loss.”
“My stop is always 1% below entry.”
No matter what the chart looks like.
No matter what the volatility of the asset is.
No matter if you’re trading Gold, EurUsd, or Nasdaq.
This kind of stop loss doesn’t respect market structure or context — it’s just a random number.
You might get lucky a few times, but over the long run, it’s a losing game.
If your stop loss doesn’t make sense on the chart, then it doesn’t make sense in the market either.
There’s no nuance here — it’s bad, period.
________________________________________
✅ The Good Stop Loss
The good stop loss is strategic.
It’s placed based on structure, volatility, and logic — not habit or emotion.
You define it after you’ve studied:
• Where invalidation occurs on your idea
• The volatility range of the asset
• The natural “breathing room” of the market
When this kind of stop loss is hit, it’s not a tragedy.
It’s information.
It means your prediction was wrong.
You expected the market to go up, but it went down — simple as that.
No panic. No revenge trading.
You step away, clear your mind, and wait until the next day.
Then, you redo your analysis without bias.
If the new structure confirms that the market has truly flipped direction — then, and only then, you can trade the opposite way.
That’s professionalism.
That’s how you stay consistent.
________________________________________
😬 The Ugly Stop Loss
Now, this one hurts.
The ugly stop loss is the good stop loss that gets hit… and then the market reverses immediately.
You were right — but your stop was just a little too tight.
That’s the emotional pain every trader knows.
But here’s the key:
This situation only counts as ugly if your original stop loss was good — meaning, logical and based on structure.
If it was arbitrary, then it’s not ugly — it’s just bad.
So, what do we do when a good stop loss turns ugly?
We do exactly the same thing:
• Wait until the next day.
• Reanalyze the chart with fresh eyes.
• If the setup is still valid, re-enter in the original direction.
It’s rare for both the first and second stop to be “hunted.”
Patience gives you clarity — and clarity gives you edge.
________________________________________
💭 Final Thoughts
Stop losses aren’t just a risk tool — they’re a psychological mirror.
They reveal whether you trade with emotion or with structure.
The bad stop loss shows a lack of respect for the market.
The good stop loss shows discipline and logic.
The ugly one shows that even good decisions can lead to short-term pain.
But pain is not failure — it’s feedback.
So the next time your stop gets hit, don’t see it as punishment.
See it as a test of your ability to stay rational when the market challenges you.
Because in the long run, consistency doesn’t come from winning every trade.
It comes from handling the losing ones correctly. ⚖️

Non-Farm Payrolls: Do You Trade the Print or Let It Pass?NOTE – This is a post on Mindset and emotion. It is NOT a Trade idea or strategy designed to make you money. If anything, I’m posting this to help you preserve your capital, energy and will so you can execute your own trading system with calm, patience and confidence.
Every first Friday, the market braces for NFP.
For some, it’s a chance to catch a big move.
For others, it’s a day to protect capital and energy.
The real question isn’t just what’s the number?
It’s: What’s your process around events like this?
Here’s the work to do before Friday:
1. Define your approach
Are you trading the release, fading the first spike, or waiting until the dust settles? Write it down before the event - don’t decide in the heat of the moment.
2. Check what’s pulling you in
Is it part of your tested edge, or are you driven by FOMO, the rush of adrenaline, or the feeling that you “should” trade it?
3. Notice your body’s signals Faster breathing or shallow breaths
Shoulders tightening
Heart rate climbing
Narrowed focus on the screen
Fingers itching to click
These are not just “nerves” they are signals. Use them as feedback, not fuel.
4. Review the impact afterwards
Did trading the news leave you calm, in control and aligned with your plan?
Or did it drain your energy, push you into overtrading, or spark regret?
The point isn’t whether NFP is an opportunity or a trap . It can be either.
The edge comes from knowing yourself, deciding ahead of time and sticking to a process that matches both your system and your psychology.
So before the number drops, get clear:
- Do you have a defined playbook?
- Or are you letting the market and your body pull you into one?
If you’re contemplating trading at any point around the NFP number you might want to check out @JeffBoccaccio’s posts on ES range expectations around the release for some idea on how he frames the news event. Start here but check out the linked video post for a walk-through explanation:

Trading: The Most Relative Profession in the WorldIntroduction
Most professions operate within clear boundaries of right and wrong, success and failure. A doctor either saves the patient or doesn’t. An engineer either builds a stable bridge or one that collapses. But trading doesn’t work like that.
In trading, “being right” and “being wrong” are relative. Two traders can look at the exact same market, take opposite positions, and both can be right. At the same time, they can both be wrong. This relativity is what makes trading not only fascinating, but also psychologically challenging.
________________________________________
Why “Being Right” Is an Illusion in Trading
Many traders fall into the trap of needing to be right. They celebrate when their forecast matches the price action, and they criticize others when opinions diverge. But trading isn’t about intellectual debates — it’s about execution, timing, and money management.
You can make the perfect call, but if you enter at the wrong time or exit poorly, you still lose. Conversely, you can be “wrong” in your forecast, yet still make money because you managed your trade correctly.
________________________________________
A Real Example: Gold’s Price Action Yesterday
Take gold, for instance:
• Trader A says: “Gold will rise.”
• Trader B says: “Gold will fall.”
Who is right? The answer is not straightforward.
• Gold made a new all-time high during the day — Trader A can claim victory.
• Gold sold off after — Trader B can also claim victory.
But here’s the twist:
• Trader A was wrong if he bought at the very top before the selloff.
• Trader B was wrong if he sold too early at 3860 before the new ATH.
This example shows how trading doesn’t operate in absolutes. The market gives both validation and punishment, depending not only on the direction, but also on timing and execution.
________________________________________
Timeframe Relativity: Scalper vs. Swing Trader
This relativity becomes even more visible when we compare a scalper with a swing trader — in fact, this is where it shows itself most clearly.
Consider this scenario:
• The scalper buys against the larger trend, catching a quick 50-pip bounce from intraday volatility.
• The swing trader sells with the dominant trend, holding for several days and capturing 300 pips once the broader move unfolds.
At first glance, their positions contradict each other. One is long, the other is short. Yet both can be right — and both can make money — simply because they operate on different timeframes, with different objectives and risk tolerances.
Don’t believe me? Here’s a real and concrete example: back in 2022, I shorted BTC heavily and made strong profits. At the same time, a good friend of mine kept buying into weakness and applying a DCA strategy.
Who was right?
The answer, again, is relative. I was right in the medium term — profiting from the bearish momentum. My friend was right in the long term — building a position that paid off when the market eventually recovered.
This is the purest example of relativity in trading: the same market, moving in both directions, rewarding two very different strategies.
________________________________________
The Key Lesson
Trading is not about proving a point. It’s not about winning an argument on social media or showing that your market call was correct. It’s about managing trades in a way that consistently extracts profits, regardless of who “guessed” the move better.
The market doesn’t reward opinions. It rewards discipline and risk control. Always remember:
• Entries are relative.
• Exits define success.
• Risk is king. A “right” prediction with poor risk management can still end in disaster.
In other words: you don’t get paid for being right — you get paid for good execution and risk management.
________________________________________
Why Relativity Matters
Understanding the relativity of trading helps in three ways:
1. It kills the ego. You stop caring about being right and start caring about making money.
2. It reduces conflicts. Another trader’s opposite view doesn’t threaten yours; both can co-exist.
3. It shifts focus. The conversation moves from “Was I right?” to “Was my trade profitable?”
________________________________________
Conclusion
Trading is the most relative profession in the world because “truth” in markets is never absolute. Two traders can both be right, both be wrong, or both at once.
What separates successful traders from the rest is not their ability to “predict,” but their ability to trade with discipline, adapt to changing conditions, and manage risk.
In the end, the scoreboard is your trading account — not your pride in being right. 🚀

Why Most Traders Lose and How to Flip the Script
It’s no secret: most retail traders lose money.
Not because the markets are “rigged,” but because trading is a game of probabilities, discipline, and psychology.
Let’s break down why losses happen, the psychology behind them, and how to build a better plan to stay in the game long-term.
1. Why Most Traders Lose
There are a handful of mistakes that account for the majority of blown accounts:
🔸 Overleveraging – Using too much size turns small moves against you into catastrophic losses.
🔸 Lack of risk management – Without stop-losses, max drawdown rules, or position sizing, one bad trade can erase weeks of gains.
🔸 Chasing trades – Entering late after a big move due to FOMO, only to sell at the bottom.
🔸 No system – Random entries and exits with no strategy mean your results are left entirely to chance.
🔸 Emotional trading – Anger, revenge trades, and greed lead to impulsive decisions that sabotage even good setups.
Most traders know these mistakes on paper, but knowledge alone doesn’t prevent them. The real enemy is psychology.
2. The Psychology Behind Losing
When most people think about why traders lose, they picture bad entries or poor technical skills. But the truth is, the biggest battles aren’t fought on the charts—they’re fought in the mind. Understanding the psychology behind losing is critical, because it explains why traders keep repeating the same mistakes even when they “know better.”
Loss Aversion
Psychologists have proven that humans feel the pain of losing about twice as strongly as the pleasure of winning. In trading, this shows up in two destructive ways: holding onto losing positions far longer than we should, and selling winning positions far too early. A trader might watch a loss grow from -5% to -20% because closing the trade would mean admitting they were wrong. On the flip side, the moment a trade turns green, they take profit too quickly, just to escape the fear of it slipping back to red. Over time, this creates an inverted risk/reward profile—small wins and big losses—the exact opposite of what successful trading requires.
Confirmation Bias
Once a trader enters a position, the human brain naturally looks for reasons to justify it. They’ll scroll through charts, social media, or news feeds, paying attention only to the information that supports their trade, while ignoring anything that contradicts it. This tunnel vision can be deadly, because markets don’t care about opinions—they reward objectivity. A good trader must learn to question their own bias constantly, asking not “why am I right?” but “what would prove me wrong?”
Ego and Revenge Trading
Every trader knows the sting of a losing trade. But what comes next separates amateurs from professionals. The inexperienced trader often lets ego take over. Instead of stepping back, they try to immediately “win back” what was lost, usually by doubling their position size, rushing into another setup, or abandoning their strategy entirely. This revenge trading spiral often leads to much larger losses. The market punishes desperation, and it rewards patience. The ability to walk away after a loss and reset emotionally is one of the hardest but most valuable skills to develop.
The Illusion of Control
Many traders believe that the more time they spend staring at charts or the more trades they take, the better their results will be. This illusion of control often leads to overtrading, which drains both capital and emotional energy. In reality, trading is about probabilities, not control. No amount of screen time can eliminate uncertainty. The edge lies in preparation, discipline, and executing a plan—not in micromanaging every tick of price action. Paradoxically, the less you feel the need to control the market, the more control you gain over your own decisions.
3. How to Prevent Frequent Losses
The good news: most of these pitfalls can be managed with structure and discipline.
✔️ Risk Per Trade – Never risk more than 1–2% of your total capital on a single position.
✔️ Predefine Rules – Before you click buy/sell, know your entry, stop, and target.
✔️ Accept Losses – Treat them as the “cost of doing business.” Even pros lose 40–50% of trades.
✔️ Quality > Quantity – Fewer, higher-probability trades often outperform constant scalping or chasing.
✔️ Journal Every Trade – Write down why you entered, why you exited, and what you felt. This exposes patterns in your behavior.
4. Building a Better Plan
Trading without a plan is gambling. Building a system gives you consistency.
Define Your Edge: What makes your trade valid? Is it a technical setup, a market structure, or a specific confluence of signals?
Backtest Your Strategy: Test your rules on historical data before risking real money.
Stick to Probabilities: No setup wins 100%. Focus on consistency over a large sample size.
Emotional Control Routine: Walk away after a big loss, set daily limits, and never trade tired or stressed.
Takeaway
Most traders lose not because they’re “bad” but because they don’t treat trading like a business.
By mastering psychology, defining risk, and following a plan, you stop thinking in terms of single trades → and start thinking in terms of long-term probabilities.
Trading isn’t about being right every time.
It’s about surviving long enough for your edge to play out.
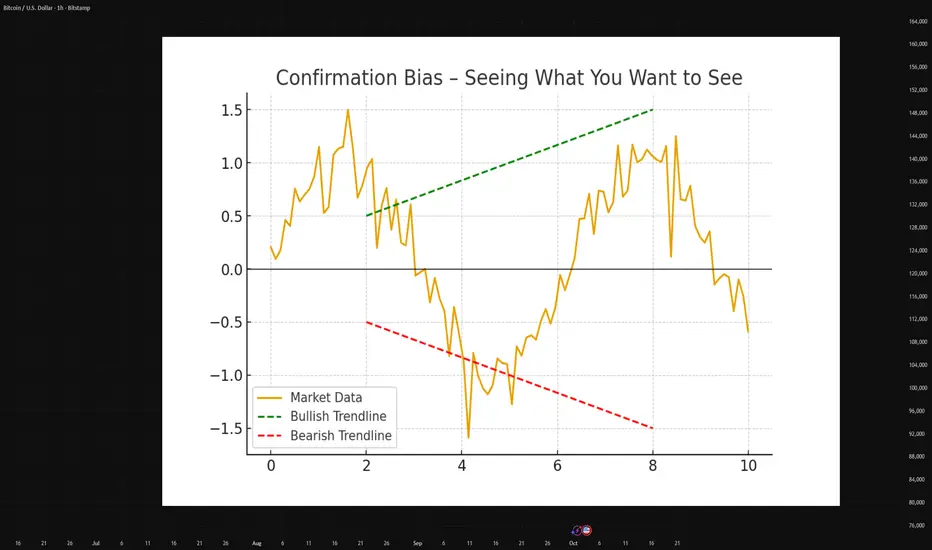
Exit Psychology – Reflections On The SeriesNOTE – This is a post on Mindset and emotion. It is NOT a Trade idea or strategy designed to make you money. If anything, I’m taking the time here to post as an effort to help you preserve your capital, energy and will so that you are able to execute your own trading system as best you can from a place of calm, patience and confidence.
Over the last few posts we’ve walked through the psychology behind many exits. Here on this chart, you can see how they all might have played out on a single trade.
One trade, four different exits. Whichever you choose to implement isn’t just a technical decision - it’s a psychological mirror.
Taking each in turn:
The initial stop: the line where you admit, “The trade idea didn’t work”
The break-even stop: the comfort of “I can’t lose now.”
The trailing stop: the wrestle between protecting gains and letting them run.
The profit target: the choice between certainty and potential.
Put them all on the same chart and you’ll notice something: none of them are just about price. Each is a reflection of the trader making the call.
What we’ve uncovered in this series:
The initial stop tests whether you can accept being wrong on a trade idea without making it personal.
The break-even stop shows how much discomfort you’re willing to tolerate before reaching for relief.
The trailing stop mirrors your balance between fear of giving back and trust in your process.
The profit target surfaces your relationship with certainty versus possibility.
And tight vs. loose? That isn’t just a preference. It begins with trader type: your personality, values and beliefs set a natural baseline. It’s shaped further by how well your strategy fits that style. And in the moment, emotion (fear or hope) nudges you tighter or looser than planned.
The bigger reflection:
Exits reveal more than entries. They show how you handle:
Loss and regret.
Control and uncertainty.
Trust and identity.
Comfort and growth.
But reflection alone isn’t enough. To turn insight into progress, you need practical ways to anchor behaviour:
Pre-commit in writing: Note where you’ll exit before you enter, it closes the door to mid-trade negotiation.
Separate outcomes from emotions: Journal not just where you exited, but how you felt in the moment. Patterns emerge quickly.
Differentiate protecting vs. controlling: Ask yourself, “Am I moving this stop to protect the plan, or because I’m uncomfortable right now?”
Train the nervous system: Notice the physical urge to act and how it shows up in the body (ex: shallow breath, tense shoulders). Pause before execution and breathe. Slow down the ‘urge’ and re-train self trust.
These small practices are how you build the consistency to stay aligned with both your system and your psychology.
Closing thought:
The market doesn’t care where you exit. But your mindset does - and so does your account.
Clarity in those decisions is where growth begins and where your odds of staying in the game increase.
In the end, your edge isn’t only your system. It’s your state of mind - before, during and after engaging with the market.
I hope you’ve enjoyed this series. If so would love to hear in the comments.
Here’s a recap of the entire Psychology of Exits series in case you’d like to check out the details of each:
Exit Psychology 1/5 : The Initial Stop
Exit Psychology 2/5 : The Break-Even Stop - Comfort or Illusion?
Exit Psychology 3/5: The Trailing Stop – Patience vs Protection
Exit Psychology 4/5 : The Profit Target – Certainty vs. Potential
Exit Psychology 5/5: Tight vs. Loose
And finally here is the link to the original article by TradingView that inspired this series as promised:
p.s. Apols if anything is odd in this post, I have had to repost it.
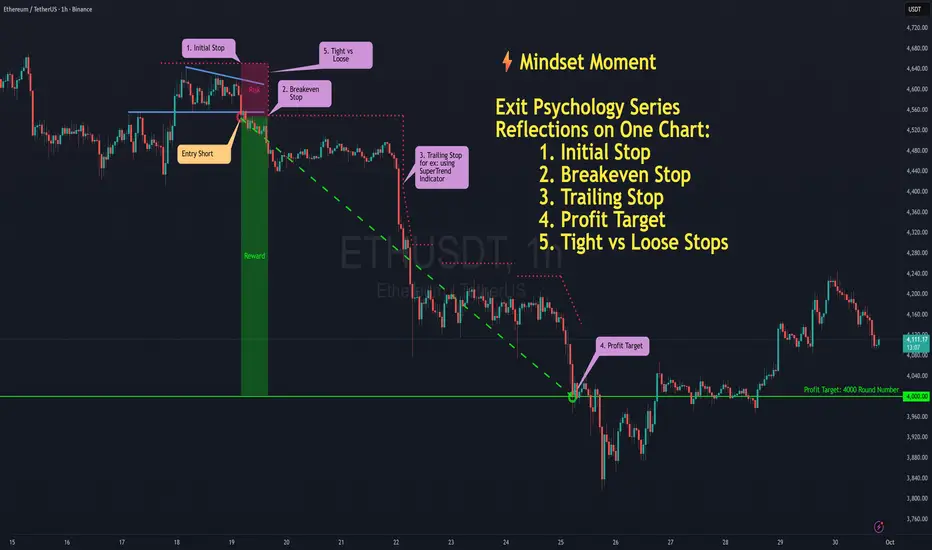
Exit Psychology 5/5: Tight vs. LooseNOTE – This is a post on Mindset and emotion. It is NOT a Trade idea or strategy designed to make you money. If anything, I’m taking the time here to post as an effort to help you preserve your capital, energy and will so that you are able to execute your own trading system as best you can from a place of calm, patience and confidence.
This 5-part series on the Psychology of Exits is inspired by TradingView’s recent post “The Stop-Loss Dilemma.” Link to the original post at the end of this article.
Here’s a scenario:
Two traders, same setup. One uses a tight stop. One sets it loose.
The first gets stopped out quickly - several scratches in a row. Frustration builds: “The market keeps hunting me.”
The second holds through the noise, but watches a small loss balloon. Self-talk creeps in: “If I’d cut it sooner, I’d be fine.”
Same market. Different styles. Each trader convinced the other way might be better.
How behaviour shows up with tight vs. loose stops:
Tight stops: Often chosen by traders who value precision and control. The mindset is “I’d rather be wrong small and often than wrong big.” The cost? A series of small cuts that can erode confidence.
Loose stops: Favoured by traders who value patience and the bigger picture. The mindset is “give the trade room to breathe.” The cost? Larger drawdowns and the risk of turning manageable losses into emotional ones.
Neither is inherently better. The choice often begins with trader type - your personality, values and beliefs shape a natural preference for precision (tight) or patience (loose). The trap isn’t in the preference itself it’s when short-term emotions hijack that baseline.
The psychology underneath:
Your baseline style comes from deeper beliefs and tendencies:
Tight stop traders often believe:
“If I’m precise, I can avoid being wrong.”
“Smaller losses hurt less.”
“Control comes from minimising risk quickly.”
Loose stop traders often believe:
“The market needs space to prove me right.”
“One big win will pay for the rest.”
“Patience will protect me from being shaken out.”
But when stress or excitement kicks in, those baseline tendencies can distort:
Tight traders over-tighten - cutting winners short out of fear.
Loose traders loosen further - holding too long out of hope.
The key is to know the difference between what reflects your style and what reflects an emotional trigger.
Why context matters:
Timeframe: Scalpers naturally need tighter stops; swing traders can afford looser ones.
Volatility: Calm markets tolerate precision; wild ones punish it.
Strategy: Breakout systems often need wider buffers; mean reversion thrives on tight control.
Your stop isn’t just about the chart. It’s about who you are, the system you run and the market you’re in.
Practical tips … the How:
Notice your natural bias: Do you lean toward safety through control (tight) or safety through space (loose)? Awareness matters more than labels.
Align your stop style with both your timeframe and your temperament. A system that grinds against your personality will drain your energy.
Review your data: Do tight stops cut you out too soon? Do loose stops bleed too much? Your history holds the clues.
Separate outcome from process: A stop-out isn’t failure - it’s feedback. Tight or loose, consistency beats reaction.
Reframe:
It’s not about tight versus loose. It’s about congruence, between your strategy, the market context and your personality. When those three line up, stops become less about fear and more about discipline.
Closing thought:
Every stop: initial, break-even, trailing, or profit target is really a mirror. It reflects not only your strategy, but also your relationship with uncertainty, control and trust in yourself.
The market doesn’t care how you exit. But your mindset does… as does your account.
Every adjustment, every shift of a stop, every decision to hold or cut, carries both a financial cost and an emotional cost. Learning to see those decisions clearly, is where growth begins and where your odds of staying in the game increase.
A link to Exit Psychology 4/5 : The Profit Target – Certainty vs. Potential
A link to the original article as promised:
This is Part 5 of the Psychology of Exits series.
👉 Thanks for following along ... and for those who have stayed the course with me, there's a bonus wrap up that I'll be writing up today and releasing tomorrow. Stay tuned.
p.s. Apologies if the chart on this post is a little odd. I had to repost this.

Exit Psychology 4/5: The Profit Target - Certainty vs. PotentialNOTE – This is a post on Mindset and emotion. It is NOT a Trade idea or strategy designed to make you money. If anything, I’m taking the time here to post as an effort to help you preserve your capital, energy and will so that you are able to execute your own trading system as best you can from a place of calm, patience and confidence.
This 5-part series on the Psychology of Exits is inspired by TradingView’s recent post “The Stop-Loss Dilemma.” Link to the original post at the end of this article.
A familiar scenario:
Price is moving your way. You’re edging closer to your profit target. An internal debate begins:
“Should I book it now? What if it turns?” . Your pulse quickens. Thoughts circle:
“What if it turns now?”
“Should I take it here? It’s good enough…”
“But what if I exit and it keeps running?”
One voice says “bank it before it disappears.” Another whispers “hold, the real move is still ahead.”
You exit early, relief for a moment - until you watch the chart run far beyond where you got out. Next time, you hold on longer… only to see your winner evaporate.
Most traders know this dance. It’s not about charts. It’s about the pull between certainty and potential.
How behaviour shows up with profit targets:
The way we take profits tells us more about our beliefs than about the market itself. :
Cutting trades too early: The belief that profit can vanish at any moment, so you must grab it while it’s there.
Holding too long: Rooted in the hope that “one big trade will make the month.” or erase prior losses.
Moving targets mid-trade: Reflects the belief that adjusting = control, even if it means inconsistency.
Ignoring targets entirely: Suggests discomfort with closure - “If I don’t exit, I haven’t missed out yet.”
The psychology underneath:
What looks like “profit management” is often emotional management in disguise:
Loss aversion in reverse: Protecting unrealised gains feels safer than risking them for more.
Regret aversion: The fear of “what if”- too soon or too late - shapes every decision.
Scarcity belief: “Opportunities are rare - I must squeeze every drop.”
Over-attachment: Treating one trade as if it carries all the weight, rather than one of many in a series.
Identity layer: For some, banking profit = validation; missing the bigger move = failure.
At the heart of it is this tension: Do you seek the certainty of closing now, or the potential of holding on? And which one do you believe defines your worth as a trader?
Why traders use profit targets:
Pre-defined targets do have value.
They provides clarity, structure and reduce decision fatigue.
Locks in gains and avoids paralysis at turning points.
They allow for consistent risk-reward planning.
But the challenge is sticking to those targets without rewriting them mid-trade based on emotion. That’s where the psychology is tested.
Practical tips … the How:
The aim is to separate strategy-based exits from emotion-based exits, namely to exit in line with your plan, while conserving psychological capital for the next trade: A few ways traders manage this:
Define profit targets in advance - structure, measured move, or R-multiple and write them down before entry so you are not improvising mid-trade.
Consider scaling out: partial profits banked, partial profits to satisfy the need for certainty, while leaving a portion to capture potential.
Journal post-trade: Did you exit where planned, or did emotion intervene? Track the pattern across multiple trades.
Build awareness: notice the urge to “grab it” or “stretch it.” Pause and label the feeling (fear/greed/doubt) before acting on it. Naming the emotion can reduce its grip on you.
Reframe:
A profit target isn’t a ceiling. It’s a decision point. The skill isn’t in guessing the high it’s in exiting consistently in line with your plan, while protecting your psychological capital for the next trade.
Closing thought:
Every profit exit is a mirror. It reflects not only what the market offered, but also how you relate to certainty, potential, and trust in your own process.
A link to Exit Psychology 3/5 : The Trailing Stop – Patience vs. Protection
A link to the original article as promised:
This is Part 4 of the Psychology of Exits series .
👉 Follow and stay tuned for Part 5: Tight vs. Loose - Personality, Context, and the Real Trap.

XAUUSD 2025: Recalibrate Your Thinking or You Won’t SurviveThesis: If you don’t recalibrate your volatility expectations for Gold, you won’t survive this market. What felt like a “big move” in 2021 is just noise in 2025.
________________________________________
1) Context: What Actually Happened (2020 → 2025)
• 2020–2023: Gold largely oscillated in a broad range around the $1,700–$2,000 handles (with occasional spikes beyond). Many traders anchored their risk and target expectations to this regime.
• March–April 2024: A decisive breakout to fresh all-time highs shifted the regime from compression to expansion.
• Late August 2025: Price broke out of a symmetrical triangle around the ~3330 zone and then advanced near-vertically into late September, ushering in a burst of exceptional volatility.
Bottom line: The market transitioned from a four-year consolidation into a powerful expansion phase. Your playbook must evolve accordingly.
________________________________________
2) Volatility Math: Same %, Bigger Dollars → Bigger “Pips”
Many retail platforms quote XAUUSD so that 1 pip ≈ $0.10. Using that convention:
• In the $1,900–$2,000 environment, a 2% move ≈ $38–$40 → 380–400 pips.
• At $3,300–$3,800, the same 2% ≈ $66–$76 → 660–760 pips.
So those “300–400 pip moves” you treated as significant in 2021 or2022 are structurally too small for 2025.
In expansion phases, 1,000+ pip swings are perfectly normal.
Key takeaway: If price doubles, absolute fluctuations for the same percentage move roughly double too. Stop using yesterday’s pip yardstick.
________________________________________
3) Why Recalibration Matters
The market is not static. Traders who survive across cycles are those who adapt to new volatility regimes. Anchoring to outdated benchmarks—whether in pips, percentage moves, or psychological comfort zones—leads to poor decisions.
It is not enough to have a strategy. You need the right frame of reference for volatility, risk, and expectations.
A system built for a $1,800 gold market cannot simply be copied and pasted into a $3,500 gold market without adjustment.
________________________________________
4) The Psychological Shift
Recalibration is not only technical but also mental:
• Old anchors: What once felt like a big move is now an intraday fluctuation.
• Risk perception: A number that once signaled danger may now be just routine volatility.
• Flexibility: The willingness to redefine “normal” is the mark of a trader who lasts.
This is not abstract theory. For example, I started writing this article when Gold was trading at 3860. By the time I reached this paragraph, price had already dropped to 3815, after making a low at 3810—an almost 700-pip drop from today’s all-time high in just three hours.
By the time you read this, it may be trading at a completely different level. That’s the reality of expansion volatility.
And here’s the perspective shift: these days, being happy about booking 100 pips on Gold is like being happy for 10 pips on EURUSD. It’s not that 100 pips don’t matter—it’s that the scale of the game has changed, and your mindset must change with it.
________________________________________
5) Moving Forward
Your survival depends on continuous mental updates. Understand that volatility is relative to price, that regimes change, and that clinging to old measures is a recipe for losses. General principles—risk discipline, patience, and adaptability—remain constant, but their practical application shifts with the environment.
Recalibrate, or the market will do it for you.

Cryptocurrency : The New Normal & The World of Leverage Trading.📌 Cryptocurrency: The New Normal & The World of Leverage Trading ⚔️ ( A Sweet Killer! )
🌍 Why Are Traders Shifting to Crypto? COINBASE:BTCUSD BITSTAMP:ETHUSD COINBASE:SOLUSD
✔️ Lower capital required compared to stocks
✔️ Fewer gaps (24/7 market = no overnight gap-up/down shockers)
✔️ High leverage opportunities (control bigger trades with smaller margin)
✔️ Global accessibility (Binance, Bybit, OKX, CoinDCX, Mudrex etc.)
📊 Types of Trading in Crypto
💠 **Spot Trading** → In India, 30% tax on capital gains ( check according to your country ).
💠 **Options & Futures** → Taxed as *Business Income* ( like F&O in stocks ). No flat % rule.
⚡ What is Leverage?
👉 Leverage means using *small capital* to control a *large trade size* , because the exchange lends you money.
Think of it like **margin trading** in stocks — but much more aggressive.
🔹 Example 1 : Normal Trade style ( No Leverage )
suppose you have 💰 Capital = $10,000
Bought BTC at Price = $10,000,000
* You can buy 0.001 BTC ( 10000 ➗ 10,000,000 ).
* If BTC rises 10% → Profit = $1,000 (+10%)
* If BTC falls 10% → Loss = $1,000 (-10%)
👉 Risk & reward move in proportion to your capital.
🔹 Example 2 : Leverage Trade style ( 10x Leverage )
suppose you have 💰 Capital = $10,000
opted Leverage = 10x
New Trade Size ( margin ) = $1,00,000 ( you can now utilize this margin amount for trading )
* You can buy 0.01 BTC ( 10000 ➗ 10,000,000 ).
* If BTC rises 10% → Profit = $10,000 (+100% return)
* If BTC falls 10% → Loss = FULL $10,000 ( Liquidation 🚨 )
👉 A 10% move = your account will be blown.
🔹 Example 3:
suppose you have 💰 Capital = $10,000
opted Leverage = 50x (Extreme ⚠️)
New Trade Size ( margin ) = $5,00,000 ( you can now utilize this margin amount for trading )
* You can buy 0.05 BTC ( 50000 ➗ 10,000,000 ).
* If BTC rises just 2% → Profit = $10,000 (+100% return)
* If BTC falls just 2% → FULL $10,000 loss ( Liquidation 🚨 )
* If BTC rises just 10% → Profit = $50,000 (+500% return)
* If BTC falls just 10% → FULL $10,000 loss ( Liquidation 🚨 )
👉 Tiny moves in high volatile asset class = jackpot or wipeout/blown.
⚔️ Key Takeaways :
1️⃣ Leverage multiplies profits 💸 but also multiplies losses too💀 ( a sweet killer! )
2️⃣ Crypto is *highly volatile* (10–20% daily moves are common) → High leverage is extremely risky, if not managed well.
3️⃣ Beginners should **never use more than 2x–3x leverage**
👉 In simple words: **Leverage is a double-edged sword ⚔️**
Used wisely → You’re a king 👑
Used recklessly → You’re broke 🥀
---
🚘 Liquidation Explained ( ex: Car Analogy )
Imagine you pay $10,000 ( as a security ) to rent a car worth $1,00,000. (That’s 10x leverage).
* The car is in your hands, but $90,000 still belongs to the owner of car (exchange).
* If the damage goes beyond your $10,000 margin → the owner takes back the car immediately.
👉 That’s liquidation: when your loss = your margin.
🔹 Case 1: Normal Trade style ( No Leverage )
Margin = $10,000 → Buy BTC.
If BTC drops 10% → Loss = $1,000.
You still have $9,000 left.
✅ No liquidation. Just a normal loss.
🔹 Case 2: 10x Leverage Trade style
Margin = $10,000
New Trade Size ( margin ) = $1,00,000
* BTC rises 10% → Profit = $10,000 (+100%)
* BTC falls 10% → Margin wiped = Liquidation 🚨
🔹 Case 3: 20x Leverage Trade style
Margin = $10,000
New Trade Size = $2,00,000 ( margin )
* BTC rises 5% → Profit = $10,000 (+100% return)
* BTC falls 5% → Margin wiped = Liquidation 🚨
👉 Just 5% against you = Account gone.
🔹 Case 4: 50x Leverage Trade style (High-Risk Zone ⚠️)
Margin = $10,000
New Trade Size = $5,00,000 ( margin )
* BTC rises 2% → Profit = $10,000 (+100% return)
* BTC falls 2% → FULL $10,000 loss = Liquidation 🚨
👉 Just 2% against you = Blown account = Game over.
🎯 Final Word
Leverage = Power ⚡
But in crypto’s volatile world, it’s also a **trap for the impatient**.
* Liquidation is directly proportionate to Leverage.
* Smart traders use small leverage.
* Impulsive traders burn out with high leverage.
💬 Question for you: What’s the **highest leverage** you’ve ever used in a trade? Drop it below 👇 (Be honest—we’ve all been tempted!)
If this Idea gave you a value information then please, Boost it, share your thoughts in comments, and follow for more practical trading!
Happy Trading & Investing!
@TradeWithKeshhav and team