What is a Sortino Ratio?The sortino ratio is a way of gauging the performance of a portfolio relative to the amount of risk taken. The sortino ratio is a variation of the sharpe ratio, but only penalises the downside volatility, not total volatility (like a sharpe does).
To properly understand the sortino ratio we first need to understand the sharpe ratio.
📌 What is the Sharpe Ratio?
The Sharpe ratio is a performance metric that measures how much excess return an investment generates for each unit of total risk taken.
📍 The sharpe ratio looks like this: (AvgReturn - MAR) / StDev
It is calculated by subtracting the MAR (Minimum acceptable return) which is usually 0 or a risk free rate (A percent you can make without risking anything (usually a government bond)) from the portfolio’s average return and dividing the result by the portfolio’s standard deviation, which represents volatility and fluctuations of profit.
A higher Sharpe ratio indicates that returns are being achieved more efficiently relative to the amount of risk, while a lower ratio suggests that returns may be driven more by volatility than by any skill or edge.
📌 What is the Sortino Ratio?
The Sortino ratio is very similar but refines the sharpe by focusing exclusively on downside risk rather than total volatility. Instead of using standard deviation, it replaces it with downside deviation, which measures only the volatility of returns that fall below the minimum acceptable return. By doing so, the Sortino ratio penalizes harmful volatility while ignoring upside fluctuations, making it particularly useful for evaluating strategies that exhibit asymmetric return profiles or frequent positive volatility.
📍 What is downside deviation?
Downside deviation measures how much returns fall below your minimum acceptable return. You calculate it by looking only at the periods where performance is worse than your target, squaring those shortfalls, averaging them, and then taking the square root. Any return above the target is ignored, because it does not represent risk from a downside perspective.
📌 The Sharpe ratio is used more to evaluate low-volatility investment portfolios, and the Sortino variation is used more to evaluate high-volatility portfolios.
Overall, the Sharpe ratio measures risk-adjusted returns using total volatility, while the Sortino ratio focuses only on downside risk, ignoring upside swings. Together, they provide complementary insights, with Sharpe giving a broad view of efficiency and Sortino highlighting potential losses relative to a target return.
Riskmanagementstrategy

Microsoft (MSFT) - Context after a pullback | 1DThis chart is not about predicting the next move.
It’s about understanding where the market currently is in its process .
After a strong multi-month uptrend, MSFT entered a corrective phase that brought price back toward its long-term mean. Instead of continuing lower, price began to stabilize and compress , forming a base rather than accelerating to the downside.
Notably, this same price area previously acted as a zone of accumulation , where downside pressure faded and longer-term positioning started to build before the next leg higher. The current behavior shows similar characteristics: reduced volatility, overlapping ranges, and diminishing downside follow-through.
This does not imply an immediate continuation or guarantee higher prices.
What it does suggest is a shift from directional movement into a context-building phase , where risk conditions differ from both trend expansion and panic-driven selloffs.
At this stage, the key question is not “how high can it go?”
It’s “is downside risk still expanding, or has it begun to compress?”
Recognizing that transition helps avoid emotional decisions and premature entries during consolidation.
Context first. Decisions later.

AI Trading Fundamentals: The Trinity of Success
Most Traders Obsess Over Strategy - and Ignore the Two Things That Actually Save Them
In the AI trading era, it's easy to get lost in models, indicators, and signal quality.
But beneath every durable trading approach — manual or automated — there are only three pillars:
Edge – a real, testable reason your trades make money over time
Risk – how much you lose when you're wrong
Execution – how consistently you follow the plan
Remove any one, and the entire structure collapses.
Pillar 1: EDGE – Why This Should Work at All
In a world of AI‑generated strategies and infinite backtests, edge has to mean more than "the curve looks nice".
Ask your system:
What market behavior is this exploiting?
Why should that behavior continue ?
What market conditions break this logic?
If your only explanation is "the bot backtested well", you don't have an edge. You have a story.
Pillar 2: RISK – How You Survive Your Own Edge
Even a strong edge comes with:
Losing trades
Losing streaks
Drawdowns that feel worse live than on paper
In the AI era, risk decisions include:
Position sizing rules for each strategy
Portfolio‑level exposure caps across multiple bots/systems
Maximum drawdown and daily loss limits that auto‑trigger when hit
Edge without risk is just leverage pointed at a wall.
Pillar 3: EXECUTION – Where Most Traders Quietly Lose
Execution is simply: Did you do what your plan said, when it said to do it?
With AI tools, this becomes:
Did you take every valid signal, or did you cherry‑pick?
Did you change parameters mid‑drawdown "to feel safer"?
Did you override bots based on fear or FOMO?
AI is excellent at pure execution. Humans are not. The hack is to let algorithms handle the rules - and keep humans in charge of designing those rules and managing risk.
Putting It Together in the AI Era
When you review your trading or systems, don't just ask "Did I make money?". Ask:
Edge: Do I still understand why this works? Has the market changed?
Risk: Are my size, drawdown limits, and kill switches clear and enforced?
Execution: How often did I actually follow the plan?
For most traders, the weakest pillar isn't edge - it's risk or execution.

Your Trading Algorithm's Report Card: The Year-End Review
Forget New Year’s Resolutions — Give Your Trading a Real Audit
At the end of the year, most traders do one of two things:
Celebrate if they made money
Blame the market if they didn't
Neither of those changes anything.
In the AI era — where your tools can track every trade, every decision, every bot run — there's no excuse not to sit down once a year and ask: "What actually happened here?"
Why a Year‑End Audit Matters More With AI
When you're using AI tools or bots, you aren't just grading yourself. You're grading:
Your systems (manual or automated)
Your risk framework
Your behavior around those systems
Without an audit, it's easy to:
Blame the bot for what was actually poor risk management
Assume an edge that only worked in one regime
Miss the fact that overrides did more harm than good
Four Lenses for Your Year‑End Review
Performance – cold, hard numbers
Total return vs a simple benchmark ( AMEX:SPY , $CRYPTO:BTC, etc.).
Maximum drawdown — did it match what you thought you could handle?
Expectancy per trade and per system.
Process – did you do what you said you would?
How often did you follow your rules exactly?
How often did you override AI or system signals?
Did you journal or track reasons for trades?
Strategy – did your ideas actually have edge?
Which strategies carried the year?
Which consistently bled capital?
Did you unknowingly just ride a bull market?
Behavior – how you handled stress, FOMO, and drawdowns
Did you stick to size limits during losing streaks?
Did you revenge trade after losses?
Did you turn bots off or on based on feelings instead of rules?
Turning Reflection Into an Actual Plan
After the audit, write down three lists:
STOP – behaviors, markets, or strategies that clearly don't work for you.
START – habits you know would have helped (journaling, monthly reviews, better risk checks).
KEEP – strengths you want to double down on.
Then convert them into specific goals:
"Reduce discretionary overrides to <5% of total trades"
"Run walk‑forward tests on any new AI strategy before going live"
"Review performance on the first weekend of every month"
In the End, Data > Stories
The point of a year‑end audit isn't to beat yourself up.
It's to replace:
"I think I did okay this year"
with:
"My systems returned X%, max drawdown was Y%, my biggest leak was Z, and here’s exactly what I’m changing."
In a world where AI can track every detail of your trading, the traders who win are the ones willing to look at those details honestly.

Backtesting AI Strategies: The Complete Framework
Your Backtest Showing 1,000% Returns Is Probably Lying to You
In the age of AI tools and instant backtests, it's never been easier to generate beautiful equity curves.
It's also never been easier to fool yourself.
Backtesting isn't about proving your genius. It's about trying as hard as possible to break your idea before the market does.
What Backtesting Is Really For
Backtesting should answer boring, critical questions:
Does this logic have any edge beyond randomness?
How ugly do the drawdowns get when things go wrong?
Does it survive different market regimes, or only one lucky period?
What happens after costs, slippage, and realistic execution?
In the AI era, you can run thousands of tests in minutes. That doesn't mean you should trust the first curve that looks good.
The Classic Sins (Supercharged by AI)
AI makes it easy to commit every backtesting error faster:
Overfitting – Adding parameters and filters until the past looks perfect.
Look‑ahead bias – Accidentally using data that wouldn't have been known at the time.
Ignoring costs – Forgetting that spreads, fees, and slippage eat high‑frequency edges alive.
Data snooping – Testing hundreds of variants and only remembering the winners.
Each mistake quietly turns your "edge" into noise dressed up as science.
A Clean, Honest Testing Framework
You don't need a PhD. You need structure.
Write the Hypothesis First
"I think momentum in high‑volume stocks persists for 5–20 days."
Document the why before you see the results.
Split Your Data
Training: where you rough in the idea.
Validation: where you tune it.
Test: a final, untouched slice you only use once.
Compare Against Baselines
Buy‑and‑hold.
Random entries with similar risk rules.
Walk Forward
Train on past → test on the next chunk → roll forward.
Mimic how you'd actually update the system in real time.
Stress It
High vol vs low vol.
Trends, ranges, crashes.
Key Metrics That Actually Matter
Skip the exotic stats. Focus on:
Max Drawdown – Can you survive it psychologically and financially?
Expectancy – Average profit per trade after costs.
Profit Factor – Gross profits / gross losses.
Win Rate + Win/Loss Size – How often you win, and how big wins vs losses are.
Monthly Consistency – How many months are red vs green.
These tell you if the system is tradable, not just impressive.
AI's Role: Helper, Not Judge
AI can:
Generate variations you wouldn't think of
Run large test grids quickly
Estimate parameter sensitivity
But you still have to:
Define what "good" looks like
Reject fragile, curve‑fit solutions
Decide when a system has truly failed and needs to be retired
In other words, AI gives you the lab. You still have to be the scientist.

The Psychology of Letting AI Trade for YouThe Hardest Part of AI Trading Isn't the Code - It's Letting Go
You can spend months building the perfect system.
You backtest it. Tweak it. Optimize it.
And then, the first time it takes three losses in a row, you override it.
In the era of AI and automation, the battlefield has shifted. The challenge is no longer just "Can I build a system?" — it's "Can I trust it enough to let it work?"
The New Psychological Game: Humans vs Their Own Bots
We tell ourselves we want robots to remove emotion.
What actually happens is more subtle:
We stop being emotional about individual trades
We start being emotional about the system itself
Instead of:
"Should I exit this trade?"
you think:
"Is the bot broken?"
"Should I turn it off?"
"Why did it take this trade? I wouldn't have."
The emotions don't vanish. They just move up a level.
The 5 Stages of AI Trading Psychology
Euphoria – Early wins, "this thing is a money printer."
Doubt – First real drawdown, "maybe it's not as good as I thought."
Intervention – You start skipping signals, closing early, or adding your own trades.
Confusion – You can no longer tell if results are from the system or from your meddling.
Integration (or Abandonment) – Either you learn your role vs the system… or you conclude "AI doesn't work" and go back to pure manual trading.
Most traders get stuck between stages 2–4. The goal is to move to stage 5 with eyes open .
Calibrated Trust: Between Blind Faith and Total Control
Two extremes kill AI trading:
Blind Trust – "The bot knows best, I'll never question it."
Zero Trust – "I'll override whenever I feel like it."
You want calibrated trust :
You understand how the system makes decisions
You know its expected win rate, drawdown, and losing streaks
You have written rules for when you will and won't intervene
Think of it as a partnership: the AI follows the rules; you manage the environment and the risk.
Designing Your Role Before You Turn the Bot On
Before you ever hit "start", write down:
Which signals you will take without second‑guessing
Which situations require human review (major news, tech issues, extreme volatility)
Your hard stop conditions:
Max daily loss
Max drawdown
Max number of consecutive losses
Your review schedule (weekly, monthly) for performance and logic
If your rules only live in your head, your emotions will rewrite them in real time.
Emotional Hacks for the AI Era
Trade Smaller Than You Think You Should
If you can't sleep, size is too big. No psychology trick beats position sizing.
Check Less Often
Every peek at P&L triggers a reaction.
Schedule times to review, rather than watching every tick.
Journal Your Urges, Not Just Your Trades
Write down: "Wanted to stop the bot after 3 losses, didn't."
Or: "Overrode this signal, why?"
Separate Process From Outcome
Good process + bad short‑term outcome is still a win .
Bad process + good short‑term outcome is a landmine.
Your Mind Is Still the Edge
AI can:
Scan faster
Execute cleaner
Track more variables than you ever could
But only you can decide:
What risk you are truly willing to take
When a drawdown is "normal" vs unacceptable
Whether the system still makes sense in the current regime
In the AI trading era, the real edge is a calm, knowledgeable person who knows when to trust the system - and when to step back.

How AI is Revolutionizing Risk ManagementIn a world where bots can fire off hundreds of orders in the time it takes you to sip your coffee, risk management isn't a checkbox at the end of your plan it's the core operating system.
AI has given traders incredible leverage:
Faster execution than any human
Exposure to more markets and instruments
Complex position structures that would be impossible to manage manually
But that same leverage cuts both ways. When something breaks, it doesn't trickle it cascades.
The traders who survive this era won't be the ones with the most aggressive models. They'll be the ones whose risk frameworks are built to handle both human mistakes and machine speed.
Why Old-School Risk Rules Aren't Enough Anymore
For years, the standard advice looked like this:
"Never risk more than 1–2% per trade"
"Always use a stop loss"
"Diversify across assets"
Those principles still matter so much. But AI and automation helped improve and changed the landscape:
Orders can hit the market in microseconds your "mental stop" is useless
Correlations spike during stress what looked diversified suddenly moves as one
Multiple bots can unintentionally stack risk in the same direction
Feedback loops between algos can turn a normal move into a cascade
In other words: the classic rules are the starting point , not the full playbook.
How AI Supercharges Risk Management (If You Let It)
Used well, AI doesn't just place trades it monitors and defends your account in ways a human never could.
Dynamic Position Sizing
Instead of risking a flat 1% on every trade, AI can adjust size based on:
Current volatility
Recent strategy performance
Correlation with existing positions
Market regime (trend, range, chaos)
When conditions are favorable, size can step up modestly.
When conditions are hostile, size automatically steps down.
The goal isn't to swing for home runs.
It's to press when the wind is at your back, and survive when it's in your face.
Smarter Stop Placement
Fixed stops at round numbers are magnets for liquidity hunts.
AI can analyze:
ATR-based volatility bands
Clusters of swing highs/lows
Liquidity pockets in the book
Option levels where hedging flows are likely
Stops get placed where the idea is broken, not where noise usually spikes.
Portfolio-Level Heat Monitoring
Most traders think in single trades. AI thinks in portfolios.
It can continuously measure:
Total percentage of equity at risk right now
Sector and theme concentration
Correlation clusters (everything tied to the same macro factor)
Worst-case scenarios under shock moves
If your "independent" trades are all secretly the same bet, a good risk engine will tell you.
The 4-Layer Risk Stack for AI Traders
Think of your protection as layered armor:
Trade Level
Clear stop loss
Defined target or exit logic
Position size tied to account risk, not feelings
Strategy Level
Max number of open positions per strategy
Daily loss limit per system
"Three strikes" rules after consecutive losing days
Portfolio Level
Total open risk cap (for example: no more than 2% at risk at once)
Limits by asset class, sector, and narrative
Rules to prevent over concentration in one theme (AI stocks, crypto, etc.)
Account Level
Maximum drawdown you're willing to tolerate
Hard kill switch when that line is crossed
Recovery plan (size reductions, pause period, review process)
AI can monitor all four layers at once every position, every second and trigger actions the moment a rule is violated.
Kelly, Edge, and Why "More" Is Not Always Better
The Kelly Criterion is a famous formula that tells you how much of your account you could risk to maximize long‑term growth.
Kelly % = W - ((1 - W) / R)
Where:
W = Win probability
R = Average Win / Average Loss
Example:
Win rate (W) = 60%
Average win is 1.5× average loss (R = 1.5)
Kelly = 0.60 - (0.40 / 1.5) ≈ 0.33 → 33%
On paper, that says "risk 33% of your account each trade." In reality, that's a fast path to a margin call.
Serious traders and any sane AI risk engine treat Kelly as the ceiling , then scale it down:
Half‑Kelly (≈ 16%)
Quarter‑Kelly (≈ 8%)
Or even less, depending on volatility and confidence
AI can recompute W and R as fresh trades come in, adjusting risk when your edge is hot and cutting risk when your edge is questionable.
Designing Your AI‑Era Risk Framework
You don't need hedge‑fund infrastructure to think like a pro. Start with five questions:
What is my absolute pain threshold?
At what drawdown (%) would I stop trading entirely?
Write that number down. Build backwards from it.
How many consecutive losses can I survive?
If you want to survive 10 straight losses at 20% max drawdown, your per‑trade risk must be ~2% or less.
How will I shrink risk when volatility spikes?
Tie your size to ATR, VIX‑style measures, or your own volatility index.
What are my circuit breakers?
Daily loss limit
Weekly loss review trigger
Conditions where all bots shut down automatically
Is everything written down?
If it's not in rules, it's just a wish.
Rules should be clear enough that a bot could follow them.
Four AI Risk Mistakes That Blow Accounts Quietly
Over‑optimization - Training models until the backtest is perfect… and live trading is a disaster.
Ignoring tail risk - Assuming the future will look like the backtest, and underestimating rare events.
No true kill switch - Letting a "temporary" drawdown turn into permanent damage.
Blind trust in the model - Assuming "the bot knows best" without understanding its logic.
AI should be treated like a high‑performance car: powerful, fast, and absolutely deadly if you drive it without brakes.
Discussion
How are you handling risk in the age of automation?
Do you size positions dynamically or use fixed percentages?
Do you cap total portfolio risk, or just think trade by trade?
Do your bots or strategies have clear kill switches?
Drop your thoughts and your best risk rules in the comments. In the future of trading AI will be the one watching your back.....

Spot + Hedge — The Fundamental Framework for Investors Who TradeYou don’t have to treat holding and trading as two separate worlds. The most effective market participants combine both. They anchor their strategy in long-term conviction while using short-term tools to manage volatility and protect capital. This balance allows them to participate in structural growth without exposing their portfolio to unnecessary drawdowns.
Spot holdings are the foundation. A well-built spot position compounds through cycles, absorbs volatility, and benefits from every wave of adoption that pushes the market forward. Staking adds an additional layer by generating yield during periods of consolidation. For traders who think in cycles rather than days, spot is the engine that keeps building value in the background.
A hedge position serves a different purpose. It is not designed for aggressive speculation. It is a tactical layer that reduces exposure when conditions become unstable. Futures shorts, when sized properly, act as a defensive tool that preserves the value of your long-term assets without forcing you to sell them. This approach keeps you invested while giving you room to breathe during sharp corrections.
When hedging makes sense:
– After a strong rally pushing into major resistance levels.
– When funding rates are extremely positive and the market is crowded with leveraged longs.
– When macro data shifts, liquidity tightens, or a regulatory event increases uncertainty.
– When your portfolio has grown significantly and you want to lock in part of that increase without taking profits.
The purpose of the hedge is stability. You are not aiming to turn the short into a profit engine. You are using it as portfolio insurance. A well-timed hedge limits the damage during pullbacks and keeps you positioned for the next leg of the cycle.
Simple implementation example: assume you hold $20,000 of ETH spot as your long-term allocation. To hedge, you short 25–30 percent of the position using ETH perpetual contracts. If ETH drops 10 percent, the hedge cushions the downside by generating gains on the short. If ETH continues rising, your spot position captures the upside and the hedge becomes the cost of protection, similar to an insurance premium.
This framework helps traders stay in the market, avoid emotional exits, and preserve capital during volatile periods. It combines conviction with discipline and gives long-term holders a practical way to navigate uncertainty without breaking their overall strategy.

GOLD TESTING CRITICAL $4,000 SUPPORT!🚨 ALERT - CRITICAL SITUATION!
Gold is in DANGEROUS TERRITORY! The market is testing the psychologically critical $4,000 level after a sharp decline. This is a make-or-break moment!
What's Happening:
❗ Price Expected to DECLINE Today - Analysts forecast further downside
❗ $4,000 Psychological Support - Being tested RIGHT NOW
❗ DXY Strengthening - Dollar at key support (99.50), pressuring gold
❗ Bearish Momentum Active - Third consecutive day of decline
❗ Triangle Breakdown Risk - Pattern suggests more downside
📊 TECHNICAL ANALYSIS
Market Structure: BEARISH 🔴🔴🔴
Gold has broken down from consolidation triangle and is now testing the crucial $4,000-$4,040 support zone. This is buyers' LAST STAND!
Current Battle: Bulls defending $4,000-$4,040 vs Bears pushing for breakdown
CRITICAL Support Levels (Must Hold!) 🔵
Support 1: $4,020 - $4,040 (Current fight zone - CRITICAL!)
Support 2: $4,000 - $4,008 (Psychological - LINE IN SAND!)
Support 3: $3,987 - $4,002 (November open - Major)
Support 4: $3,930 (Bullish invalidation - DANGER!)
Support 5: $3,886 - $3,900 (Previous lows)
Key Resistance Levels (Recovery barriers) 🔴
Resistance 1: $4,090 - $4,100 (KEY - Daily pivot)
Resistance 2: $4,110 - $4,120 (Strong ceiling)
Resistance 3: $4,150 - $4,155 (Major barrier)
Resistance 4: $4,187 - $4,200 (Last week's high)
📈 TECHNICAL INDICATORS
RSI (14): 45-48 (Bearish momentum) 📉
RSI (1H): 52 (Neutral equilibrium - Dormant)
MACD: Bearish crossover confirmed ❌
Stochastic: Near oversold - Bounce potential soon ✅
Moving Averages:
Price BELOW 20-day EMA 🔴
Testing 50-day SMA support ⚠️
100-day MA holding (Long-term) ✅
Bollinger Bands: Contraction mode - Big move coming
Volume: Above average - Institutional activity present
🎯 TODAY'S TRADING STRATEGIES
SCENARIO 1: FURTHER DECLINE 🔴 (55% Probability)
On November 18, 2025, price of XAU/USD expected to decline
IF Gold Breaks Below $4,000:
This opens door for significant correction!
SHORT Setup (Aggressive):
Entry: Break below $3,995-$4,000 with volume
Targets:
TP1: $3,987 📍 (-15 pips from $4,000)
TP2: $3,930 📍 (-70 pips)
TP3: $3,886 📍 (-114 pips - October low)
Stop Loss: $4,032 (Above consolidation)
⚠️ WARNING: This is WITH the trend now - but use caution!
SCENARIO 2: SUPPORT BOUNCE 🟢 (35% Probability)
IF Gold Holds Above $4,006-$4,020:
Buyers defending $4,000-$4,040 support zone - Wyckoff spring confirmation possible
LONG Setup (Counter-trend):
Entry: $4,006-$4,012 (if bounce confirmed)
Targets:
TP1: $4,065 📍 (+55 pips)
TP2: $4,090 - $4,100 📍 (+90 pips)
TP3: $4,120 📍 (+110 pips)
Stop Loss: $3,998 (Below $4,000)
Risk/Reward: Good 1:2.5+ ratio ✅
SCENARIO 3: RANGE TRADING ⚪ (10% Probability)
IF Gold Consolidates Between $4,020-$4,090:
Scalping Strategy:
Buy: $4,020-$4,030
Sell: $4,080-$4,090
Targets: 30-40 pips
SL: Very tight (20 pips)
💎 BEST TRADE SETUPS FOR TODAY
CONSERVATIVE APPROACH (Highly Recommended!) 🎯
WAIT FOR CLEAR SIGNAL! This is a dangerous zone.
Setup A - Buy the $4,000 Bounce (Preferred):
Wait for price to TOUCH $4,000-$4,008
Look for strong bullish candle (rejection)
Entry: $4,010-$4,015 (after confirmation)
Target: $4,065 → $4,100
SL: $3,990
Why: Psychological level + High R:R
Setup B - Breakdown Short:
Wait for CLEAR break below $3,995
Entry: $3,990-$3,995 (after retest)
Target: $3,950 → $3,930
SL: $4,020
⚠️ DO NOT TRADE between $4,030-$4,070! No man's land!
🌍 FUNDAMENTAL ANALYSIS
WHY GOLD IS FALLING 📉
DXY Recovering - Dollar found support at 99.50 (61.8% Fib), bouncing back
Fed Hawkish Tone - Officials signaling cautious approach to rate cuts
Risk-On Sentiment - Equities rising, reducing safe-haven demand
Government Reopened - Uncertainty removed
Profit Taking - After 7% rally two weeks ago
BULLISH FACTORS (Long-term) ⬆️
✅ Analysts still predict gold may reach $4,456-$4,509 by end November
✅ Central banks purchased 634 tonnes YTD (Targeting 750-900)
✅ ETF holdings grew 619 tonnes ($64B) in 2025
✅ Geopolitical tensions persist
✅ Fed rate cut still possible December (though less certain)
BEARISH RISKS (Short-term) ⬇️
⚠️ DXY Strength - Dollar bouncing from support
⚠️ Technical Breakdown - Triangle pattern failed
⚠️ Momentum Bearish - MACD crossed down
⚠️ $4,000 Break - Would trigger stop losses
⚠️ FOMC Minutes This Week - Could show hawkish Fed
🔥 MARKET SENTIMENT: BEARISH SHORT-TERM
Analyst Views:
Today (Nov 18):
Expected to trade $4,000-$4,100 with DOWNSIDE bias
This Week:
Critical week - FOMC minutes could determine direction
Watch $4,000 level - break = $3,930 target
Month End:
IF $4,000 holds → Recovery to $4,200-$4,300 possible
IF $4,000 breaks → Drop to $3,886-$3,930 likely
💡 PROFESSIONAL GAME PLAN
For DAY TRADERS:
⚡ HIGH RISK Day!
$4,000 is THE level - trade the bounce or breakdown
Use VERY tight stops (15-20 pips)
Take quick profits (don't be greedy)
Best time: Wait for NY session clarity
For SWING TRADERS:
📊 Critical Decision Point
IF $4,000 holds with strong bounce → GO LONG (3-5 day hold)
IF $4,000 breaks cleanly → GO SHORT to $3,930
Don't trade in the middle!
For LONG-TERM INVESTORS:
💎 Patience Required
This could be THE dip to buy
Target: $3,950-$4,000 for accumulation
Vision: $4,500+ by 2026
Strategy: Dollar-cost average (don't go all-in yet!)
📅 KEY EVENTS THIS WEEK
Today (Tuesday):
Watch $4,000 level reaction
DXY movement crucial
Nvidia earnings (affects risk sentiment)
Wednesday:
FOMC Minutes Release (CRITICAL!)
Fed speakers
Thursday-Friday:
Economic data
Weekly close direction important
🎬 BOTTOM LINE (TL;DR)
Price: $4,024-$4,080 (Bearish)
Bias: 🔴 BEARISH (Short-term danger zone)
Key Level: $4,000 (Break = Big drop | Hold = Bounce)
Best Action: WAIT for $4,000 test, then act
Risk Level: EXTREME (Highest of the week!)
🔔 THE $4,000 LEVEL - MAKE OR BREAK!
IF GOLD HOLDS ABOVE $4,000:
✅ Bulls still alive
✅ Target recovery to $4,090-$4,120
✅ Buy the dip opportunity
IF GOLD BREAKS BELOW $4,000:
❌ Bears take full control
❌ Target $3,987 → $3,930 → $3,886
❌ Sell rallies strategy
BETWEEN $4,000-$4,090:
⚪ Indecision zone
⚪ Choppy price action
⚪ Wait for breakout!
📊 TECHNICAL OUTLOOK
Trend: ⚠️ BULLISH (Long-term) but BEARISH (Short-term)
Momentum: WEAK - Sellers in control 🔴
Support: TESTING at $4,000-$4,040 🚧
Resistance: STRONG at $4,090-$4,100 🔒
Pattern: Descending triangle breakdown / Bear flag
Next Move: Break $4,000 = DROP | Hold $4,000 = BOUNCE
⚠️ RISK MANAGEMENT - CRITICAL!
✅ Tiny Positions - Risk MAX 0.5-1% (Market dangerous!)
✅ Wide Stops - Give trades room (30-40 pips minimum)
✅ Quick Exits - Lock profits FAST if you get them
✅ Respect $4,000 - This is THE most important level
✅ No Revenge Trading - If stopped out, STEP AWAY
🎯 SWING TRADE SETUPS
Setup A - Support Bounce (High Risk/Reward):
Entry: $4,000-$4,015 (AFTER bounce confirmation)
Target 1: $4,090 (Hold 2-3 days)
Target 2: $4,150 (Hold 5-7 days if breaks $4,090)
Stop Loss: $3,985 (TIGHT!)
Setup B - Breakdown Trade:
Entry: $3,985-$3,995 (after confirmed break)
Target 1: $3,950 (Hold 1-2 days)
Target 2: $3,930 (Hold 3-5 days)
Target 3: $3,886 (Hold 1 week)
Stop Loss: $4,025
🏆 PROFESSIONAL ANALYSIS SUMMARY
Gold is at the MOST CRITICAL JUNCTURE this month. The $4,000 psychological level is being tested after:
3 consecutive days of decline
Triangle pattern breakdown
DXY finding support and bouncing
The Setup:
Price trading at $4,023.83 as of 18.11.2025
Expected trading range: $4,000-$4,100
Analysts expecting DECLINE today
Most Likely Scenarios:
Scenario 1 (55%):
Test $4,000 → Break below → Drop to $3,930-$3,950
Scenario 2 (35%):
Test $4,000 → Strong bounce → Rally to $4,090-$4,120
Scenario 3 (10%):
Chop between $4,020-$4,090 for 1-2 days
The Big Picture:
This is a CORRECTION within a long-term BULL MARKET. If $4,000 holds, this becomes a great buying opportunity for the move to $4,456-$4,509 by month-end.
💪 TRADING PSYCHOLOGY WARNING
THIS IS THE SCARIEST MOMENT!
When price tests psychological levels like $4,000, emotions run HIGH
Fear makes traders sell at the bottom
Greed makes traders buy too early
WAIT for confirmation! Don't predict, REACT!
🎓 LESSON: PSYCHOLOGICAL LEVELS
Why $4,000 is SO important:
Round Number - Easy to remember = many orders cluster here
Stop Loss Magnet - Bulls have stops just below it
Buy Order Pile - Bulls waiting to buy the dip here
Media Attention - "Gold below $4,000!" headlines create action
Trading Strategy:
Don't trade BEFORE it hits $4,000
Watch HOW it reacts AT $4,000
Trade the REACTION, not the prediction!
🔮 FORECAST
Today: Test $4,000 - Reaction determines next move
Tomorrow: If $4,000 holds → bounce | If breaks → $3,950
Wednesday: FOMC minutes = BIG volatility
End of Week: $4,100+ OR $3,930 (no middle ground likely)
Month End: Recovery to $4,200-$4,300 if $4,000 holds
🚨 CRITICAL WARNINGS
⚠️ $4,000 = NUCLEAR LEVEL - Massive volatility expected
⚠️ False Breaks Common - Wait for confirmation
⚠️ Stop Hunt Risk - Price may spike below then recover
⚠️ FOMC Wednesday - Save powder for that volatility
⚠️ Don't Catch Knife - Wait for clear signals
📊 SUPPORT/RESISTANCE SUMMARY
Critical Support: $4,000 (EVERYTHING depends on this!)
Strong Support: $3,987, $3,930, $3,886
Weak Resistance: $4,065, $4,080
Strong Resistance: $4,090-$4,100, $4,120, $4,150
Breakdown Level: $3,995 (Game over for bulls short-term)
Breakout Level: $4,100 (Bulls regain control)
📈 DXY CORRELATION
Important: DXY found support at 99.50 and is bouncing!
DXY up = Gold pressure ✅ (Happening now!)
If DXY breaks above 100.30 = More gold downside
If DXY fails at 100 = Gold relief rally
Watch DXY closely today!
⚠️ FINAL DISCLAIMER
This is the most dangerous trading day this week. Gold at $4,000 support is extremely volatile and unpredictable. This analysis is for educational purposes only. Never risk more than 0.5-1% on any trade today. Use stop losses religiously. False breakouts are common at psychological levels. Wait for clear confirmation before entering trades. The market can remain irrational longer than you can stay solvent. Past performance does not guarantee future results. Consult a licensed financial advisor before trading.
📱 Today is CRITICAL!
💬 Watch $4,000 like a hawk!
🔔 Extreme volatility incoming
⚡ Follow updates throughout the day
🙏 Trade safe, not big!
#Gold #XAUUSD #ForexTrading #TechnicalAnalysis #4000Support #CriticalLevel #RiskManagement #FOMC #DayTrading #SwingTrading #MarketAnalysis #PsychologicalLevel #Volatility

TRADING LEVERAGE | How to Manage RISK vs REWARDFor today's post, we're diving into the concept " Risk-Reward Ratio "
We'll take a look at practical examples and including other relevant scenarios of managing your risk. What is considered a good risk to reward ratio and where can you see it ? This applies to all markets, and during these volatile times it is an excellent idea to take a good look at your strategy and refine your risk management.
You've all noticed the really helpful tool " long setup " or " short setup " on the left-hand column. This clearly identifies the area of profit (in green), the area for a stop-loss (in red) and your entry (the borderline). It also shows the percentage of your increases or decreases at the top and bottom. It looks like this :
💭Something to remember; It is entirely up to you where you decided to take profit and where you decide to put your stop loss. The IDEAL anticipated targets are given, but the price may not necessarily reach these points. You have that entire zone to choose from and you can even have two or three take profits points in a position.
Now, what is the Risk Reward Ratio expressed in the center as a number.number ?
The risk to reward ration is exactly as the word says : The amount you risk for the amount you could potentially gain. NOTE that your risk is indefinite, but your gains are not guaranteed. The risk/reward ratio measures the difference between the entry point to a stop-loss and a sell or take-profit point. Comparing these two provides the ratio of profit to loss, or reward to risk.
For example, if you're a gambler and you've played roulette, you know that the only way to win 10 chips is to risk 5 chips. Your risk here is expressed as 5:10 or 5.10 .You can spread these 5 chips out any way you like, but the goal of the risk is for a reward that is bigger than your initial investment. However, you could also lose your 5 and this will mean that you need to risk double as much in your next play to make up for your loss. Trading is no different, (except there is method to the madness other than sheer luck...)
Most market strategists and speculators agree that the ideal risk/reward ratio for their investments should not be less than 1:3, or three units of expected return for every one unit of additional risk. Take a look at this example: Here, you're risking the same amount that you could potentially gain. The Risk Reward ratio is 1, assuming you follow the exact prices for entry, TP and SL.
Can you see why this is not an ideal setup? If your risk/reward ratio is 1, it means you might as well not participate in the trade since your reward is the same as your risk. This is not an ideal trade setup. An ideal trade setup is a scenario where you can AT LEAST win 3x as much as what you are risking. For example:
Note that here, my ratio is now the ideal 2.59 (rounded off to 2.6 and then simplified it becomes 1:3). If you're wondering how I got to 1:3, I just divided 2.6 by 2, giving me 1 and 3.
Another way to express this visually:
In the first chart example I have a really large increase for the long position and you can't easily simplify 7.21 so; here's a visual to break down what that looks like:
If you are setting up your own trade, you can decide at what point you feel comfortable to set your stop loss. For example, you may feel that if the price drops by more than 10%, that's where you'll exit and try another trade. Or, you could decide that you'll take the odds and set your stop loss so that it only triggers if the price drops by 15%. The latter will naturally mean you are trading at higher risk because your risk of losing is much more. Seasoned analysts agree that you shouldn't have a value smaller than 5% for your stop loss, because this type of price action occurs often during a day. For crypto, I would say 10% because we all know that crypto markets are much more volatile than stock markets and even more so than commodity markets like Gold and Silver, which are the most stable.
Remember that your Risk/Reward ratio forms an important part of your trading strategy, which is only one of the steps in your risk management program. Dollar cost averaging is another helpfull way to further manage your risk. There are many more things to consider when thinking about risk management, but we'll dive into those in another post.

Risk Management 2.0: Moving Beyond Basic Stop Losses1. Introduction
If you ask most new traders how they manage risk, the answer is usually: “ I use a stop loss. ”
That’s a good start, but it’s far from enough.
Surviving in the markets is not about setting a stop and hoping for the best. It’s about knowing exactly how much you risk per trade, how your account survives losing streaks, and how you protect profits when the market moves in your favor.
Smart traders don’t aim for the biggest win. They aim to survive long enough for their edge to play out.
2. Why Fixed Lot Sizes Break Consistency
The simplest mistake in risk management is trading the same lot size on every trade, no matter the stop loss distance.
Here’s why this is flawed:
A trade with a wide stop risks far more money than intended.
A trade with a tight stop risks very little, but also reduces profit potential.
Over time, results become inconsistent. One loss can wipe out several wins.
Example: On a $10,000 account, a fixed lot might risk $500 on one trade and only $100 on another. Without realizing it, the trader’s statistics no longer add up.
Consistency comes from controlling risk per trade, not per lot size.
3. Position Sizing Models for Professionals
To fix this, professionals adjust their trade size based on account risk and stop loss distance. Three proven models are:
Percent Risk Model (most common)
Risk 1–2% of account equity per trade.
Position size changes depending on stop distance.
Ensures every trade risks the same portion of capital.
Volatility-Adjusted Model
Uses ATR (Average True Range) or market volatility to size positions.
High volatility = smaller positions. Low volatility = larger positions.
Kelly Criterion (advanced)
A formula that calculates optimal bet size based on win rate and reward/risk.
Often used at “half-Kelly” for practical application.
Useful for advanced traders but aggressive for beginners.
All three models serve the same purpose: normalize risk so one trade can’t destroy the account.
4. Trade Management: Beyond Entry Risk
Sizing risk correctly is step one. Step two is managing risk dynamically once a trade is open.
Taking Partial Profits
Scale out of part of your position at predefined levels (e.g., 50% at 1R).
Locks in gains and reduces stress, while keeping a runner for bigger moves.
Moving Stop Loss to Breakeven
After price moves in your favor (say +1R), shift your stop to entry.
Guarantees no loss on the remainder.
Avoid moving it too early or you’ll get shaken out.
Trailing Stops
Manually trail below swing lows/highs, or use ATR-based trailing stops.
Purpose: protect profits while letting the trend run.
5.Practical Rules for Risk 2.0
Here’s a simple framework you can apply today:
Decide your risk per trade (1–2%).
Always calculate position size based on stop loss distance.
Journal each trade with risk taken and whether rules were followed.
Apply a daily/weekly loss cap.
Use partials, breakeven stops, and trailing stops to secure profits.
When followed consistently, these rules transform risk management from theory into practice.

AUGUST 30TH Withdrawal executed this Sunday, Aug 30, as per strict monthly protocol. This isn't just about taking profits—it's about enforcing discipline, compounding growth responsibly, and adhering to a system that prioritizes long-term consistency over short-term emotion. The strategy continues.
NOTE ON PAST POSTS:
For clarity — if you’ve ever come across any of my hidden posts, they were strictly tied to an MT5 link shared to confirm analysis already posted on TradingView. Nothing more.
My focus has always been (and will always be) showcasing a real, working system — not on self-promotion or chasing attention.
Thank you for your continued understanding and support.

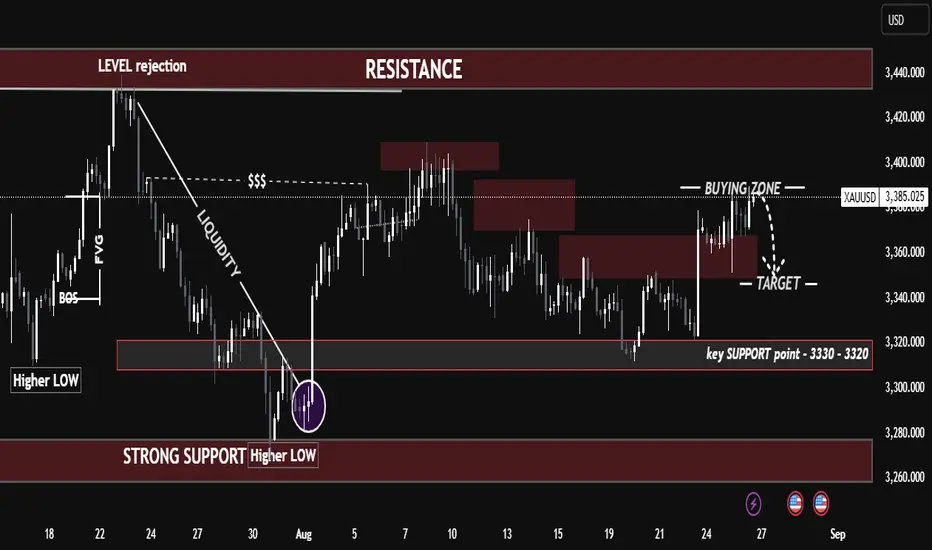
XAUUSD – Key Levels To Watch? What Happend Next🟡 XAUUSD – Key Levels To Watch 🔥 What Happend Next
Gold is currently trading inside a buying zone (3380 – 3400) but facing rejection. Market structure is still holding higher lows, which keeps the bigger trend bullish, but short-term price action suggests a possible retracement move.
Resistance Zone: 3420 – 3440 (strong supply, previous rejection)
Key Support: 3330 – 3320 (major demand, higher low base)
Immediate Target: 3340 – 3360 (if rejection continues)
📉 Short-term bias: bearish correction toward 3340 – 3360
📈 Swing bias: bullish as long as 3330 – 3320 holds
🔑 My View:
I’ll be watching how price reacts around 3330 – 3320. Holding this level could trigger the next bullish leg toward 3420 – 3440. Losing it opens the door for deeper downside into 3280.
Protect Capital First, Trade SecondIn the world of trading, mastering technical analysis or finding winning strategies is only part of the equation. One of the most overlooked but essential skills is money management. Even the best trading strategy can fail without a solid risk management plan.
Here’s a simple but powerful money management framework that helps you stay disciplined, protect your capital, and survive long enough to grow.
✅1. Risk Only 2% Per Trade
The 2% rule means you risk no more than 2% of your total capital on a single trade.
-Example: If your trading account has $10,000, your maximum loss per trade should not exceed $200.
-This protects you from large losses and gives you enough room to survive a losing streak without major damage.
A disciplined approach to risk keeps your emotions under control and prevents you from blowing your account.
✅2. Limit to 5 Trades at a Time
Keeping your number of open trades under control is essential to avoid overexposure and panic management.
-A maximum of 5 open trades allows you to monitor each position carefully.
-It also keeps your total account risk within acceptable limits (2% × 5 trades = 10% total exposure).
-This rule encourages you to be selective, focusing only on the highest quality setups.
Less is more. Focus on better trades, not more trades.
✅3. Use Minimum 1:2 or 1:3 Risk-Reward Ratio
Every trade must be worth the risk. The Risk-Reward Ratio (RRR) defines how much you stand to gain compared to how much you’re willing to lose.
-Minimum RRR: 1:2 or 1:3
Risk $100 to make $200 or $300
-This allows you to be profitable even with a win rate below 50%.
Example:
If you take 10 trades risking $100 per trade:
4 wins at $300 = $1,200
6 losses at $100 = $600
→ Net profit = $600, even with only 40% accuracy.
A poor RRR forces you to win frequently just to break even. A strong RRR gives you room for error and long-term consistency.
✅4. Stop and Review After 30% Drawdown
Drawdowns are a part of trading, but a 30% drawdown from your account's peak is a red alert.
When you hit this level:
-Stop trading immediately.
-Conduct a full review of your past trades:
-Were your losses due to poor strategy or poor execution?
-Did you follow your stop-loss and risk rules?
-Were there changes in the market that invalidated your setups?
You must identify the problem before you continue trading. Without review, you risk repeating the same mistakes and losing more.
This is not failure; it’s a checkpoint to reset and rebuild your edge.
Final Thoughts: Survive First, Thrive Later
In trading, capital protection is the first priority. Profits come after you've mastered control over risk. No trader wins all the time, but the ones who respect risk management survive the longest.
Here’s your survival framework:
📉 Risk max 2% per trade
🧠 Limit to 5 trades
⚖️ Maintain minimum 1:2 or 1:3 RRR
🛑 Pause and review after 30% drawdown
🧘 Avoid revenge trading and burnout
Follow these principles and you won't just trade, you'll trade with discipline, confidence, and longevity.
Cheers
Hexa
Mastering Risk Management: The Trader’s Real EdgeYou’ve all heard it,
“Cut your losses and let your winners run.”
Simple words — but living by them is what separates survivors from blown accounts.
Here’s some tips on how to approach risk management when trading:
☑️ Risk is always predefined: Before I click Buy or Sell, I know exactly how much I’m willing to lose. If you don’t define risk upfront, the market will do it for you.
☑️ Position sizing: Never risk more than 1–2% of your account per trade. Small losses mean you can keep taking high‑probability setups without fear.
☑️ Always use a stop‑loss: No stop? You’re not trading — you’re gambling.
☑️ Stop‑loss discipline: Place stops where the market proves you wrong — not where it “feels comfortable.” Then leave them alone.
☑️ Focus on risk/reward, not win rate: A 40% win rate can still be profitable if your average reward outweighs your risk.
☑️ Risk/reward ratio: Only take trades with at least a 2:1 or 3:1 potential. You don’t need to win every trade — your winners should pay for your losers (and more).
Remember:
“It’s not about being right all the time. It’s about not losing big when you’re wrong.”
Risk management won’t make your trades perfect — but it will keep you trading tomorrow.
And in this game, staying in the game is everything.
💭 How do you handle risk in your trading? Drop your strategy or tip in the comments — let’s share and learn together! 👇
Thanks again for all the likes/boosts, we appreciate the support!
All the best for a good week ahead. Trade safe.
BluetonaFX

AUD/USD: The Clearest Short Opportunity This WeekThis week, the macro and market landscape provides a rare alignment across all major models—making AUD/USD the standout short opportunity among G10 FX pairs.
Key Reasons for the Bearish AUD/USD Bias:
1. Commitment of Traders (COT):
Institutional positioning has turned decisively bearish on the Australian dollar, with net shorts increasing and sentiment remaining negative.
2. Z-Score & Positioning Extremes:
Z-Score indicators confirm a below-average long bias for AUD, highlighting that recent speculative flows are heavily skewed to the short side.
3. EXO/Score Model:
Our EXO (macro scoring) model gives AUD/USD a clear SHORT rating, with no offsetting bullish factors in the “core” or “risk/reward” signals.
4. Commodity Edge – Iron Ore:
Iron ore prices, a crucial driver for AUD, have sharply declined in recent weeks. This is a classic “canary in the coal mine” for AUD weakness historically, persistent iron ore declines precede broader AUD selloffs.
5. Sentiment & Risk Environment:
Despite global “risk-on” sentiment, AUD is unable to benefit, as both macro and market participants rotate away from commodity FX and into USD strength.
6. Endo (Fundamental) Model:
While Australia’s macro data still looks solid on a lagging basis, all faster models (positioning, flows, sentiment, commodities) point to an imminent shift typically, ENDO lags in catching turning points.
Conclusion & Tactical View:
SHORT AUD/USD is the highest conviction trade for this week, backed by full alignment of macro, positioning, sentiment, and real-economy factors.
Expect continued downside pressure while commodity markets and COT data remain bearish.
For active traders, the first 3–7 days following this setup historically provide the highest reward-to-risk moves.

Target hit Last post I talked about the bearish momentum which gbpusd had and how it will follow up the chart. I'm now done for the day, anticipate more sell till it reaches my buy zone
BTCUSDT: Pro Analysis, Major Swing Supports, Risk Focus__________________________________________________________________________________
Technical Overview – Summary Points
__________________________________________________________________________________
Momentum & Trends : Short-term consolidation (<1H frames), dominant uptrend 2H–1W. BTC market structure is “Up” across all higher timeframes.
Supports/Resistances :
Major supports: 100,300 – 101,600 USDT (1D/4H/2H pivots)
Resistances: 109,000 – 111,500 USDT (1D/W/12H pivots)
Volume : Recent bearish climax absorbed, back to normal volumes, no current excess.
Multi-TF Behavioral Read : Behavioral indicators (ISPD DIV) are neutral; no extreme sentiment. Risk On / Risk Off Indicator confirms structural buy-side.
__________________________________________________________________________________
Strategic Summary
__________________________________________________________________________________
Global Bias : Bullish trend on high TFs, technical consolidation short term.
Opportunities : Swing entries on return ≥101.6k, TP at 109k/111.5k. Manage position sizes actively before Fed.
Risk Zones : Invalidation <100.3k daily; key area to monitor. Short-term stop-loss below 99.9k.
Macro Catalysts : FOMC (June 17–18) = expected volatility, no major macro risk now. Watch Mideast tensions. Rising tensions in the Middle East (Israel/Iran): volatile climate, potential risk-off sentiment on certain assets, but no widespread panic; to be monitored in case of rapid escalation (possible increased BTC volatility).
Action Plan : Favor gradual entries on major supports, reduce leverage pre-macro events, active volatility and stops monitoring.
__________________________________________________________________________________
Multi-Timeframe Analysis
__________________________________________________________________________________
1D / 12H: Key support at 100.3k–101.6k, major resistance 109–111.5k. Repeated rejections at resistance, mature range. Normal volume, consolidating momentum.
6H / 4H: Strong lateral structure, ISPD/Volume neutral. Technical play around 101.6k, gradual profit-taking below 109k.
2H / 1H: Start of institutional reaction (moderate to high volumes). Bearish climax absorbed, possible short-term rebound at local support 99.9k–101.6k.
30min / 15min: Micro-range, short-term consolidation, some volume spikes on corrections. Downtrend confirmed on lower TFs, despite macro/swing bullish confluence.
ISPD & Risk On / Risk Off Indicator Summary:
ISPD DIV = Neutral across all timeframes.
Risk On / Risk Off Indicator = STRONG BUY on all horizons (US tech strong).
Cross-timeframe Synthesis : BTC market is accumulating on supports under favorable tech sector influence. Short-term consolidation seen as post-shakeout setup for potential resumed uptrend.
__________________________________________________________________________________
Final Synthesis & Operational Plan
__________________________________________________________________________________
BTC market remains in a dominant swing bullish bias, supported by tech sector momentum and on-chain inflows. Key support zones (100.3–101.6k) offer attractive technical swing entries, with targets at 109–111.5k. However, strict risk management is essential ahead of the upcoming FOMC, rising Middle East tensions (Israel/Iran), and the potential for sudden volatility spikes.
Strategy: Maintain bullish exposure with partial profit-taking and reduced leverage into macro/geopolitical events. Systematic stops remain below 99.9k.
__________________________________________________________________________________

Bitcoin Strong Momentum Below Key Resistance__________________________________________________________________________________
Technical Overview – Summary Points
__________________________________________________________________________________
Momentum: Strong bullish momentum across higher timeframes. Generalized “Up” alignment via MTFTI, strong leverage from the Risk On / Risk Off Indicator (Strong Buy on all timeframes except temporary 2H Down).
Supports / Resistances: Price evolving just below major resistances (107643.9, 109952.8, 111949) and holding above key defensive zones (104940/105287.8, then 100353/100335).
Volumes: Average on higher timeframes, very high/accelerating on 30min/15min (potential buying climax or local volatility spike).
Multi-TF/ISPD DIV Behaviour: ISPD mostly neutral, but “Sell” warning on 30min during volume peaks (risk of quick profit-taking or fake breakout).
__________________________________________________________________________________
Strategic Summary
__________________________________________________________________________________
Global Bias: Ultra-bullish. Momentum structure supported by technical/sectoral/on-chain convergence.
Opportunity: Buy on defended pullbacks (support 104940/105287.8) or daily confirmation > 107700. Extension toward 109950–111949 upon pivot breakouts.
Main Risk: Extreme volumes + ISPD Sell alerts (30min) = caution, speculative excess/whipsaw possible, quick profit-taking, lack of macro catalyst (weekend proximity).
Macro Catalysts: No urgent catalysts (macro stable, low exogenous risk).
Action Plan:
Tactical entry on defended pullbacks or validated daily signal > 107700.
Stop-loss below 104940 (pivot), swing validation below 100335/100353 (on-chain).
Active management of 107600–107700 zone (potential climax/local capitulation).
__________________________________________________________________________________
Multi-Timeframe Analysis
__________________________________________________________________________________
1D (Daily): Strong momentum, price just below pivots, no sell signal. Supports: 100300/93337.4.
12H: Similar structure, buyers in control, potential dip under 107600–109900.
6H/4H: Ongoing bullish impulse, test of the critical 107640–107644; no signs of weakness bar minor consolidation.
2H: Only TF Down, technical breakout underway, “Up” signal restoring (watch for fakeout below 107600).
1H: Strong Up momentum, breakout confirmed, next candle confirmation needed.
30min/15min: Record volumes, ISPD Sell at 30min: high “bull trap” risk. Microsctructure strongly bullish but high post-spike volatility risk.
Risk On / Risk Off Indicator: Strong Buy on all major timeframes.
Bullish Confluences:
Up alignment (all majors except 2H), breakouts, confirmed sectoral momentum.
Very high volumes = new trend or potential buying climax.
Short-term risks:
ISPD Sell + extreme volume 30min/15min = possible local exhaustion.
Critical zone: 107600–107700. Watch out for fake breakouts!
__________________________________________________________________________________
Strategic Bias – Pro Summary
__________________________________________________________________________________
Technical: Setups remain bullish. Pivot breaks “open” the target zone up to 109950–111949. Stops below 104940 (pivot), swing validation sub 100335/100353. Switch to active management on exhaustion signals (vol spike or ISPD Sell).
On-Chain: Mature distribution; upside limited without new catalyst, but 103700/104940 zone remains pivotal.
Macro: No bearish macro/news catalyst short-term, technical dominance prevails.
Operational Summary:
Tactical bullish stance.
Favor buying dips toward 104940–105287.8.
Partial profit-taking above 109950.
Switch defensive on daily break 104940/104000.
__________________________________________________________________________________

BTCUSDT Analysis – Pivot 103k/106k, strategy and key zones__________________________________________________________________________________
Technical Overview – Summary Points
__________________________________________________________________________________
Momentum : Bullish structure on 1D/12H (MTFTI “Up”), but short-term consolidation (1H-2H “Down”). Momentum exhaustion observed.
Key Supports/Resistances : Resistances: 105287.8 / 106743.9 / 109952.8 / 111949. Supports: 103033.3 / 100333.3 / 93337.4. Repeated rejections below 105-106k, active testing of 103-100k supports.
Volume : Normal or slightly elevated on all timeframes. No capitulation or euphoric extremes detected.
Multi-TF Behaviour : Strong sector leadership (Risk On / Risk Off Indicator = “Strong Buy” across all frames; growth stocks > market). No behavioural anomalies on ISPD DIV. High-cycle consolidation below resistance.
__________________________________________________________________________________
Strategic Summary
__________________________________________________________________________________
Overall Bias : Neutral/bullish as long as 103k/100k holds. Bullish momentum intact, but short-term caution warranted.
Opportunities : Defensive buys/technical pullbacks above 103k; scalp/range trading 103-106k.
Risk Zones : Confirmed breakdown below 100k or acceleration in LTH distribution.
Macro Catalysts : Next FOMC June 17-18; no major short-term events identified (recent neutral macro, FOMC is key for swings).
Action Plan : Prioritize strict stops (≥3%) near pivots, consistent monitoring of behaviour/volume. Avoid overexposure pre-FOMC.
__________________________________________________________________________________
Multi-Timeframe Analysis
__________________________________________________________________________________
1D : Structuring range below 109952.8-111949 resistances. Bullish HTF trend, but momentum pausing. Average volume. Risk On / Risk Off Indicator “Strong Buy”. No extreme ISPD signals (neutral).
12H – 6H : Consolidation; supports holding, no euphoric confirmation (normal volumes, ISPD DIV neutral). Sector leadership unchanged.
4H : Compression below 105287.8. Moderate volume. Defensive resumption on supports. MTFTI bullish. Dynamic risk: monitor for sell-side capitulation.
2H – 1H : Technical correction, active retest of 105k (range 103-105k). Absorption volume. MTFTI “Down”.
30min – 15min : Short-term positive bias above 103k. Risk of false break if volume remains low. Risk On / Risk Off Indicator “Buy”/“Strong Buy”.
Cross-Indicators : Market leadership confirmed: Risk On / Risk Off Indicator = Strong Buy on all frames >15min. No excess behaviour or significant divergences detected. Key ranges: 103k-105k. On-chain: heavy LTH profit-taking but no panic.
Summary : BTC market in post-cycle-high congestion phase, structurally robust, but momentum recalibrating with fewer “easy trades.”
__________________________________________________________________________________
Cross insights & on-chain summary
__________________________________________________________________________________
On-chain (Glassnode) : Top at $111.8k, correction to $103.2k by LTH profit-taking. Spot accumulation on $103.7k/$95.6k. Upside limited unless fresh buying flows return.
Macro events : Awaiting FOMC; no recent surprises. Price action and levels dominate short-term strategy.
Stops/invalidation : Swing long defended at 103k/100k (stop <100k H4). Partial short/sell below 106743.9/109952.8. Dynamic targets: 106-109.9k; extension: 111.8k if breakout on volume.
__________________________________________________________________________________
Conclusion & Actionable Plan
__________________________________________________________________________________
Market condition:
- High consolidation, ranging below major resistances.
- Long-term bullish, short-term momentum fading.
- Neutral/bullish if 100-103k holds.
- “No macro — only levels” until FOMC or volatility catalyst.
Tactical decision:
- Trade technically, stops ≥3% under supports.
- Defended buys at 103k (stop <100k), partial profit 106-109k.
- Continuous monitoring of volume/on-chain zone reaction.
- Aggressive exit/hedge below support, target 96k/83k.
__________________________________________________________________________________
100% analysis based on TradingView multi-TF, Glassnode on-chain, macro calendar and risk management.
__________________________________________________________________________________

BTC Tactical rebound or flush? Decision point at $103700 support__________________________________________________________________________________
Technical Overview – Summary Points
➤ Strong overall momentum across all swing/weekly timeframes, clear advantage to buyers.
➤ Key support at 103,700–104,000 USDT (chart/on-chain confluence, maximum visibility on all timeframes).
➤ Major technical resistance zone at 111,000–112,000 USDT (ATH + HTF pivots).
➤ Volumes normal to moderate, no directional climax or emotional excess in short and mid-term.
➤ Risk On / Risk Off Indicator remains strongly positive, indicating persistent sector outperformance.
➤ Only short-term weakness detected: temporary bearish trend on 2H/1H/30min/15min, typical of a short-term flush within a bullish structural context.
__________________________________________________________________________________
Strategic Summary
➤ Main bias: Bullish for swing approaches as long as $103,700 holds on closing.
➤ Opportunity: Buy on support on any retest 103,700–104,000 USDT with stop <102,000 USDT.
➤ Partial target: Take profits at 105–106k, then 111–112k.
➤ Risk zones: Confirmed break below 103,700 USDT with high volume = potential flush to 97–98k or even 95–96k.
➤ Catalysts: Quiet macro calendar until NFP (06/06) & FOMC (mid-June) — increased monitoring as these events approach.
➤ Action plan: Tactical intervention on support pullback, reduce exposure before major events.
__________________________________________________________________________________
Multi-Timeframe Analysis
1D/1W : Major structure fully bullish. No underlying reversal, stable volume, solid momentum. Risk On / Risk Off Indicator fully “On Risk”, no behavioral excess.
12H/6H: Sector momentum and volumes validate all swing-long entries on dips. Key supports 103,700–104,000 USDT consistently defended across timeframes.
4H/2H: Bullish bias maintained, healthy structure. Slight intraday weakness: 2H softens, moderately high volumes without extremes.
1H/30m/15m: Short-term bearish bias across all LTF — profit taking impact, typical technical flush on support. Bearish signals do NOT invalidate HTF bullish trend, but require tactical vigilance.
Risk Summary: A fast drop below 103,700 USDT with volume would validate a flash liquidation scenario to 97–98k. Pullback in mature bull phase, strongly defended at the key support: timing for “mean reversion” on volume reaction, else wait for lower setups.
Risk On / Risk Off Indicator: Still “On Risk”, strong tech/growth sector momentum on daily/swing.
ISPD: No behavioral excess, neutral/median histogram across timeframes.
Volumes: Normal/moderate, no exhaustion spike nor major selling.
On-chain: Mature distribution, LTH profit-taking; key supports at $103,700, $97,100, $95,600.
__________________________________________________________________________________
Strategic Synthesis & Bias
Market in mature bullish consolidation, HTF structure robust as long as 103,700 USDT holds.
Active opportunity window until NFP & FOMC: prioritize swing/mean-revert setups.
Required stop for any trade: strictly below $102,000.
Smart monitoring of volumes & sentiment: confirmed support break + volume = wait for lower rebound.
No excessive panic or exuberance signals: strong RR if re-entering the main range.
Actively manage exposure approaching macro events.
Operational summary:
• Buy at 103,700–104,000 USDT, stop <102,000.
• Partial profits at 105–106k, final offload at 111–112k.
• Reduce exposure ahead of NFP/FOMC.
• If break of 103,700 USDT: stop and wait for $97–98k or $95–96k.
__________________________________________________________________________________

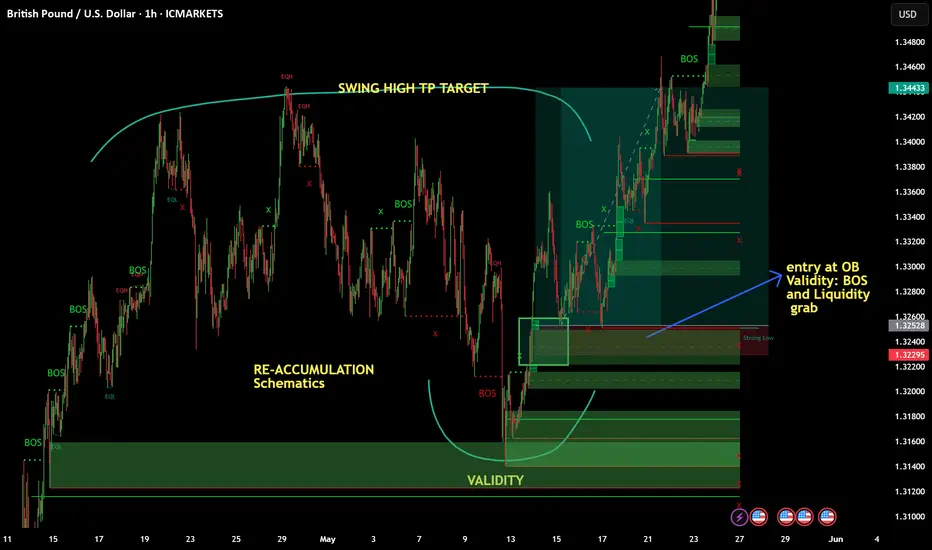
May 25 2025- BUY TRADE LIMIT order activated GBPUSDHi folks!
-Been busy lately so I dont consistently post. Attached here is the chart of GBPUSD, A classic re-accumulation in 1H timeframe. Before I got this trade It took me 1 week to monitor the schematics of this wyckoff re-accumulation. It came to fruition last Thursday so I monitor for buy Limit order entry within 1H to 15 min. charts. Validity here was the liquidity grab of re-accumulation ( check the image for clear caption).
TP: 8RR
Risk: 0.05% of Account
-Proprietary Trader
#wyckoff
#supplyanddemand
#refinement
Supply Zone Rejection & BOS Confirm Downtrend ContinuationAfter a clean shift in structure marked by a CHoCH and subsequent BOS, price retraced into a clear supply zone—offering a high-probability short setup. Here's how the setup unfolded:
🧠 Trade Rationale
Break of Structure (BOS): Price broke below a key higher low, confirming a bearish structure.
Change of Character (CHoCH): Signaled the end of bullish momentum earlier in the sequence.
Supply Zone: Price retraced into a well-defined supply area (aligned with imbalance and prior support turned resistance).
Entry: Short taken as price tapped into the supply and failed to make a new high—further confirmed by a lower timeframe CHoCH.
Target: Aiming for the next BOS level below, aligning with clean equal lows/liquidity draw.
🔍 Key Concepts Highlighted
Structure-based trading with CHoCH and BOS labeling.
Supply zone entries based on price action confirmation.
Risk-to-reward driven decision-making (tight SL above supply, TP near next demand).
💬 What do you think? Do you wait for confirmation within supply, or enter at touch?
Let’s discuss—drop your thoughts and feedback!
