Tesla - $250 Is Coming... Don't Lose Your Legs In the Bear Trap As I said in my previous call on Tesla, which was rather successful, I'm not a big fan of Elon Musk.
Tesla TSLA - The Bottom Is In, But It's Still Bearish
Especially as the post-Twitter acquisition has unfolded, I feel Musk rode the wave he could to do his "Twitter Files" thing and clawback some rightists/Conservatives that were alienated under the former Mastodon socialist leadership.
But the Twitter Files weren't really news to anyone who actually has been following COVID lockdown narrative or January 6 Capitol Riot censorship. And now Twitter is kind of the same as it's always been, but more shadowbanny, and will increasingly become more and more central to the coming globalist Central Bank Digital Currency/social credit system.
Musk, a transhumanist, has alluded to transforming Twitter into an "everything app" himself, all while lauding the communist regime in China's WeChat as if it were some kind of good thing.
CBDCs and social credit are, ultimately, the world outside of the Chinese Communist Party attempting to emulate and import the CCP's operational methodology and ways. This is a disaster for mankind, and should be opposed and challenged by everyone who wants a future.
A Warning on Red China
As always, my usual warning, especially for a company like Tesla that has a Gigafactory in Shanghai: you have to be very careful in bullish market conditions with the pandemic situation in China. Western media simply isn't reporting anything and the CCP keeps a very strict censorship regimen with a high degree of secrecy, so you'll be in the dark until it's too late to cry about your gap losses.
Xi Jinping and his Chinese Communist Party claims to have only suffered ~85,000 deaths since Wuhan Pneumonia began. That's 59 deaths per million people, and is literally a laughable claim that the epicenter of the pandemic and the world's (formerly) most populous country has suffered a factor of 10 or 60 times less magnitude of fatalities than the west that the regime exported the disease to.
In reality, this is obviously impossible. Moreover, the CCP covered up the 2003 SARS pandemic. A lot, a lot of people died during that pandemic, but the regime just told the world that everything was great.
Only a total fool believes anything that the CCP says.
The problem for a company like Tesla is a huge sum of both its supply and demand is tightly wed to China, and a pandemic situation that Xi can't keep under control and a weak Communist Party means the risk of black swan events hitting in the middle of the night when the US markets are closed is _extremely_ significant.
The Call
Now for price action, markets, especially NASDAQ and tech, all mooned in the wake and run up to FOMC. But this also came in the first two days of February, and we have a Jerome Powell speech on Feb. 7 and jobless claims on the 9th.
It's reasonable (and important) to anticipate that the low set at 10:30 AM on Feb.1 @ $169.95 is not going to be the low of the month.
It's also important to notice that the mania candle swept out the December high by 8 cents and was followed by a ~4% retrace, significant because it set up a double top pattern on the daily candles.
In my opinion, there's a very high chance that Tesla will dump rather aggressively to liquidate leveraged longs, raid long stops, and make weekly call options expire worthless, a move that will simultaneously serve as a bear trap.
$162 to $133 is a rather wide range, but it represents a combination of a weekly price displacement and a microgap. In combination with range equilibrium being $150, and $150 being a psychological operation number, a sweep all the way down to $145~ is something I anticipate.
Now, all that being said, what I would like to say is that Tesla has been so crazily bullish (almost doubling in under 30 trading sessions; this was still a $300 billion market cap company!), that range equilibrium may not be touched, and those gaps underneath it may be breakaway gaps.
So that being said, you have a hard choice if you want to go long on a dump. Because if you see $160, you really might not get better than $160 and Tesla doesn't like to stay low for long if it's going up. But if you buy $160 it can drop another 10 or maybe 15 percent, which means your calls turn (or expire if you're degen weekly) worthless.
This is a real game theory problem as the MMs, who know the schedule, use time as their greatest weapon. So perhaps a reasonable strategy is to go for the TSLL leveraged long ETF at $160 and just baghold/add if it drops more.
Bears talking about the gaps at $85 and lower, it's not that they're wrong... It's that Tesla already fell from $330~ to $100 in the course of a few months, and this was one of the world's largest companies by market cap. You really cannot afford to be so greedy to bottom short and bottom short and bottom short. You were already so lucky that you could bottom short and not get your head split for so long.
It's really very rare in equities to be able to do that.
The bounce has been so extreme that the market makers have thus made it clear that both two digit Tesla is not coming right now, and also that when you do see two digit Tesla, you can't buy it.
TL;DR, Tesla $250 is the next stop. If you get so lucky as to buy $150, I think that's pretty good, and you should even hold a portion of your position through $250.
RIVN

RIVN, 10d+/-40.25%falling cycle -40.25% more than 10 days.
==================================================================================================================================================================
This data is analyzed by robots. Analyze historical trends based on The Adam Theory of Markets (20 moving averages/60 moving averages/120 moving averages/240 moving averages) and estimate the trend in the next 10 days. The white line is the robot's expected price, and the upper and lower horizontal line stop loss and stop profit prices have no financial basis. The results are for reference only.

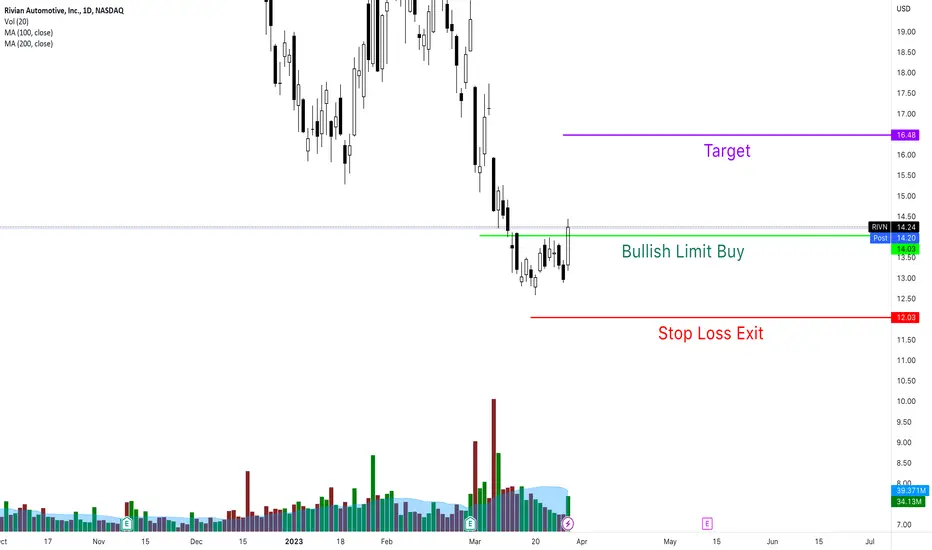
RIVN - A competitor for Tesla?Rivian Automotive (RIVN) stock has recently hit a new 52-week low due to various factors, making it a highly volatile investment. The company's lower-than-expected production output in 2023, cash burn rate, and intensifying EV truck market competition have contributed to this decline. RIVN's Q1'23 deliveries beat estimates, but its 9.39K quarterly production remains unimpressive compared to the 50K annual guidance for FY2023. Furthermore, the company's cash burn rate is unsustainable, with a reliance on debt and capital raises until it achieves positive cash flow.
Increased competition in the EV truck market is also a concern, with Ford and General Motors reporting success in their respective segments. Rivian's R1T has garnered positive reviews, but its price is significantly higher than competitors' base models. The stock remains suitable for investors with higher risk tolerances and a long-term investing trajectory. Despite recent recovery, RIVN's uncertain outlook combined with the macroeconomic environment makes the stock very unattractive.
From a technical perspective, we may see a move to the upside that reaches the pink area marked on the chart between $17 and $18 but the higher probability move is a continuation to the downside, either from here or from the target area.
We will keep you updated on any changes we see on the chart. In the meantime, please trade with care and stay safe!

RIVN swingtrade?Double bottom possibility.
I HAVE seen more and more of their trucks. And I won't lie = they are nice. Better than TSLA's...... ;) ;) ;). #rightnow... ?
RIVN RIPJust look at it. the stock is shit. This is a break and retest of support though back to the downside, seeing a lot of exhaustion here.

RIVN HAS NO IDEA...after the recent trendline break, I believe we could see this stock pushing further down into new territory. looking for a retest before entering a short position.

Watchlist 2023-01-30 #BIDU #JD #RIVN #LCIDSPY gapping below PD open, putting any Friday longs underwater. I think it tests the convergence of the balance are top and the descending trendline around 400 - 401.50. From there, look to see if pops are sold are if they hold, that will tell if we had enough fuel to continue higher or if we need a larger flush out before approaching the 410 area.
BIDU - launching an AI-power chatbot in March. Not only is this the hot topic right now like crypto in 2021, but BIDU is also gapping over a balance area with a prior day bullish hammer. A+ setup if we can hold over 139. No real resistance until 150, and with a 5.0 ATR range is possible this could go that far today if SPY heats up. However, no bias until price actions confirms thesis as other ADRs are gapping down today.
JD - panning to exit sales in exit Thailand and Indonesia market. Sitting on key support at 61. If this can't hold, 58.30 at the 200MA is the next target. To Improve risk reward, better to sell pops in this IMO as long as they fade after and don’t hold.
Watching other ADRs if weakness from PM continues: BEKE, BABA, PPD
RIVN - keeping this on watch over the high volume node at 20.30. Also, past the April 25 2022 key pivot resistance at 19.30. If LCID buyout bullishness continues, RIVN could have a support rally.

TSLA - Triple Bottom then Flat Top TriangleTSLA has had a long down trend from macro factors including China , a recession as well as a unique
situation tying it to Twitter and Musk liquidating large blocks of stock.
From the technical side of things a recent triple bottom has evolved to a flat top triangle pattern.
Both of these are bullish suggesting a reversal is real. The setup is for a breakout above
the flat top ( black line drawn on the chart) I will add TSLA back to the waitlist and watch
it also with a small position in leverged TSLL. Once it is above the breakout level of 124.75
call options with 2 weeks expiration strike of 130 will be entertained.

Get ready to buyDefault target atm is the 618
Two possible timeframes depending on the momentum.
I think the '24 time target makes more sense
After it bottoms around ~11.6, and makes its first high, we'll get a better reading.

RIVN 1WRivian Automotive, Inc. engages in the design, development, and manufacture of category-defining electric vehicles and accessories. The company was founded by Robert J. Scaringe in June 2009 and is headquartered in Irvine, CA.

RIVN crawling downRIVN seems to in a corrective wave down, possibly a wave C of a double three. Could revisit prior lows for support. Am looking here to see if it breaks this level or bounces off.

RIVN Rivian Recalls Its Vehicles Due to Loose FastenersRivian Recalls its Vehicles Due to Loose Fasteners improperly that could cause excess wheel tilt and a potential loss of steering control.
Buying a car from a new producer that doesn`t have experience in the market like the traditional ones, comes with a lot of risk involved, like the one mentioned above. I haven`t heard F Ford Motor Company, of which i`m bullish btw, to have such issues.
I expect a retracement to at least $26.50.
Looking forward to read your opinion about it.

RIVN DAILY WOLFE WAVE ACTIVEAnother daily wolfe wave setup was triggered post midterms. The chart for RIVN is closing in on the 200 day ma which will act as short term resistance. Typically the first attempt usually rejects which will be approx at 37.4. Mid term tgt is estimated at $54 May 2023. With tax losses and Christmas rally into end of year, we should see most of the small caps rally and accelerate into Feb 2023. Keep in mind there is an open gap at $140.

RIVN Rivian Automotive options Ahead of EarningsIf you haven`t sold RIVN Rivian after the bad news:
Then looking at the RIVN Rivian Automotive options chain ahead of earnings, i would buy the $30 strike price Puts with
2023-6-16 expiration date for about
$6.60 premium.
If the options turn out to be profitable Before the earnings release, i would sell at least 50%.
Looking forward to read your opinion about it.

Adios RIVNThe implosion of crypto markets impacts all other non-sensical trading and investment ideas. Not to say that some business models are faulty, but many are, shall we say, trading at rather inflated levels.
RIVN is a case in point. It found a lifeline in early October when 30.72 (RED) provided a nice bounce, but after today, we see that it is now a distant memory. Both 30.72 (RED) and 29.45 (ORANGE) were breached. Don't be a knife catcher.....that's not how you succeed in this business.

Rivian Overlook: Last week recapLast Week overview:
- It is important to find Gaps in the candesticks.
- Each gap WILL close eventually.
- In this example we see the gap closed with a smallest touch, but nonetheless it HAS been closed.
- Falling wedge followed by rising underlying asset.

$RIVN $40 PT | Triple top incoming?$RIVN is consolidating in this flag formation, I'll be watching for for a rally into $40 area which would put in a triple top while consolidating inside the flag formation.

RIVN - LONG SWING TRADE IDEARIVN could be a potential long trade for a few reasons:
First, it is forming a Buy Setup on the daily chart and it just put it a new higher low at an area of strong support
On entry, RIVN would be breaking out over three major daily moving averages (9 SMA (Purple), 21 SMA (Blue), 50 SMA (Yellow)) with room to correct to the 200 MA (Orange)
In support of the trade, RIVN has been stronger than the market during this recent move lower and it setting up to bounce with the market
Additionally, the 2:1 reward to risk is quite reasonable and could be exceeded if RIVN makes a strong move and breaks out of the double top at 41
A trailing stop loss is recommended as this is still a bear market and RIVN does have the double top as resistance. I would expect some price action around 37 as well due to retracement levels and previous areas of minor support/resistance

RIVN: A bullish structure? What to expect next?• RIVN dropped sharply in the last few days, however, it is trying to recover now;
• For the first time, since the last top (Sep 15), RIVN is doing higher highs/low;
• In addition, it seems we see an Ascending Triangle chart pattern;
• This is supposed to be a bullish reversal pattern, but this is not a rule. If it loses the purple trend line, it might drop to seek the previous bottom at $31.78;
• However, by doing an upwards breakout, it’ll trigger a reversal with a technical target at the previous top, at $40.78;
• Either way, RIVN looks interesting, but an upwards breakout will have more upside potential.
Remember to follow me for more analysis like this! Keep in touch.


Last Chance to Buy Rivian Before Major Bull RunThis is a daily chart of EV manufacturer Rivian Automotive ( RIVN ).
Price continues to consolidate as the moving averages converge.
On the right-hand side is the indicator called the Visible Range Volume Profile (VRVP). This indicator provides a vertical histogram of volume. The volume bars help identify the price ranges where most volume has occurred, which helps traders identify areas of support and resistance.
The indicator provides a red line to show the exact price level with the greatest trading volume and therefore the strongest point of support or resistance. When price comes down, as in the case of Rivian, and then forms a red line on the VRVP, it often becomes an important support level. An extremely bullish perspective might even go so far as to surmise that this area of support is the bottom for Rivian and that a major bull run is about to unfold with this red line as its support area.
From a Wyckoff analysis, one might conclude that accumulation is occurring. According to that analysis, price can retest the low right before the breakout phase.
Also, note Rivian's outperformance in the month of June. Even as inflation and commodities were soaring, major indices were gapping down, and the Fed was accelerating hiking rates, Rivian continued to consolidate, trading in a tight range and making higher lows (see below chart).
Rivian's outperformance of the broader index, after such a prolonged decline, is probably an early sign of a trend reversal and likely reflects that smart money is accumulating. A good chartist would know that inflation is cooling because commodities are now being resisted by the lines that once supported their upward trend. Necessarily, aggressive interest rate hike expectations will soon cool, too. The market is always forward-looking. By the time the Fed says that inflation is cooling and makes a pivot to being less aggressive, smart money will already be fully in the market.
Therefore, there is high confidence that Rivian may soon break out to the upside (probably in July). Don't let a temporary oscillation to the downside fool you. Nonetheless, as always, have your stop losses in place as the market can act irrationally longer than you can stay solvent. Never be unwilling to accept that you're wrong. Trading isn't about being right, it's about preserving and growing capital.

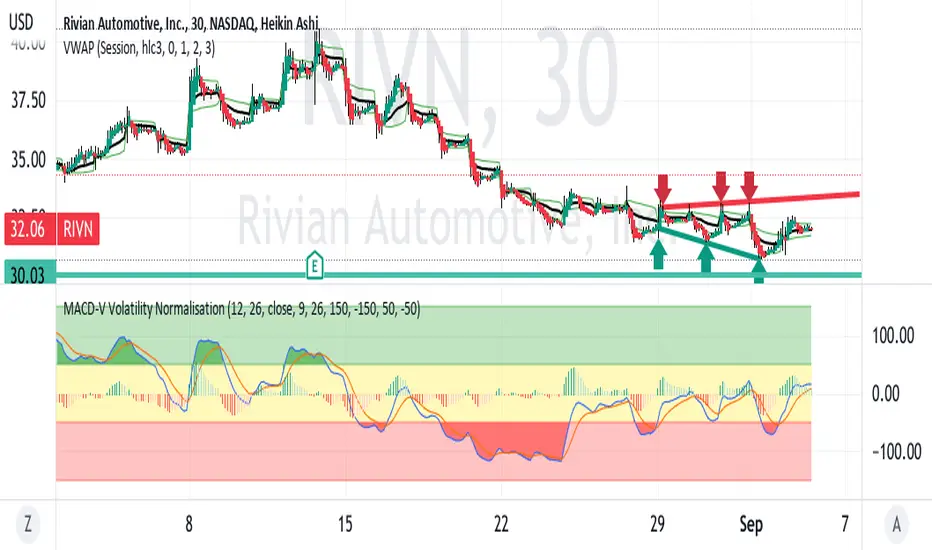
RIVN Descending Megaphone Pattern SHORTRIVN is in a slow down trending pattern right now within a megaphone
reflecting increasing volatility. The MACD shows the downward momentum
with more of the histogram negative below the zero level.
At present, the K / D lines are crossing over and above the histogram.
characteristic of a reversal to the downside.
Based on pivots in June and July, the horizontal support is at ~ $30.
Accordingly, a target on a short trade setup is just before $30.
This appears to be a good short trade setup where Rivian is
following the downtrend of the sector leader TSLA.
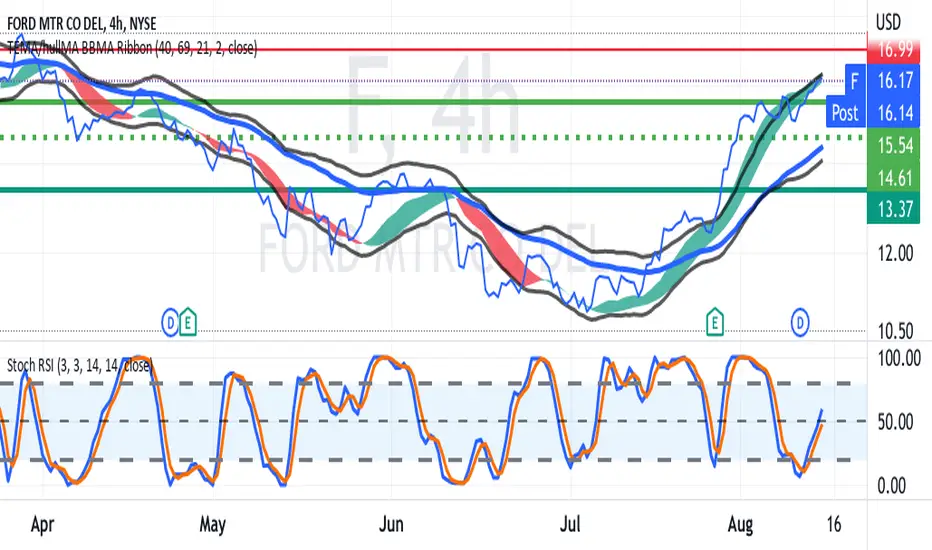
FORD Swing Trade after REVERSAL in JulyNYSE:F
F is trending up while TSLA heads down
US Legislation to support EV purchases with tax credits is helpful
GM's financial troubles are helpful.
Chart shows upgoing BB/EMA channels
and mid-range RSI with recent K/D crossover.
Both suggest a potential swing entry. Depend on unforeseen
changes in the automotive market or the market at large
and a recession versus continued uncertainty, F could
the uptrend for several months also made for the
opportunity to trade call options.
Trade often. Trade well !