Roundingbottom

ASIAPLY BIGGER PICTURE = ROUNDING BOTTOM?MYX:ASIAPLY
UPTREND
SLOW TURTLE BUY ON BREAKOUT
FiFT SPIKE UP +++ BULL RECHARGE
MCDX+ BANKER 62%
ATOM ABOVE RIVER AND START EXPANDING

TSLA: These patterns could trigger a Reversal!Hello traders and investors! Let’s see how Tesla is doing today!
First, in the 1h chart, we see something that could look like a Round Bottom , which is a pattern that I don’t like to trade. It seems we never know we are doing a Round Bottom for sure, until the pattern is almost done.
Either way, the $ 645 was the Key Point , as we discussed in our last study (link below). Now that Tesla is trading above it, we may see a pullback to this level again, which is quite close to the 21 ema as well.
This movement would be natural and wouldn’t ruin the bullish bias seen here in the 1h chart. Now, let’s see the daily chart:
Ok, Tesla didn’t trigger the Piercing Line pattern we discussed last week. But today it triggered yesterday’s Bullish Engulfing , which is a good buy sign. The volume seems to be increasing again, but there’s one problem.
The 21 ema is here to offer a resistance. But if everything moves according to this Multi Time Frame Analysis ( MTFA ), the 21 ema in the daily chart could be the perfect excuse to TSLA drop to the support level we mentioned above, in the 1h chart.
This could create a complete bullish structure and make TSLA reverse the bearish bias. Let’s see how TSLA will behave now, and if you like this analysis, remember to follow me to keep in touch with daily studies! And remember to support this idea with your like before you leave!
Thank you very much!

Buy Windsor machine for Target 67 SL 25Windsor machine Target 67 SL 25
almost 2 year consolidation breakout


DSONIC BREAKOUT FROM ROUNDING BOTTOMMYX:DSONIC
TURTLE PRO EMA 20 CROSSED UP EMA50 (UPTREND)
SLOW TURTLE BUY ON BREAKOUT WITH VOLUME
FiFT +VE (STRONG BULL)
MCDX+ BANKER SPIKE UP
BANKER 75%
ATOM BUY STAY ABOVE RIVER + SQUEEZE & EXPANDING

Multibagger Stock -Jagran Prakashan-- BREAKAWAY-GAP preceded by a valid ROUNDED-BOTTOM pattern formation by more than a year.
-- One-year Accumulation
-- Volume on the gapup day is a lifetime high.
-- Weekly gapup (very rare)
-- Bullish Engulfing pattern
-- Risk : Reward = 1:4
-- Resistance at every level (so be careful)
LTP - 60
Target - 75
Stop loss - 57

$AMC Rounding bottom in playThese are one of our favorite plays. Cup & Handle patterns
Please click a like if you like what you see on our chart.

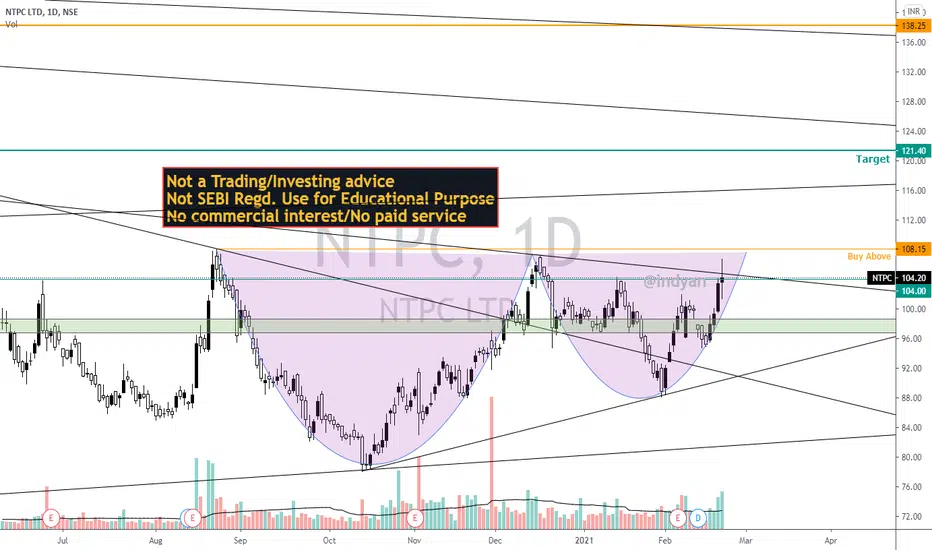
NTPC - On verge of weekly Trendline BreakoutNtpc on verge of breaking weekly trendline resistance and looks like cup and handle too. one can enter at cmp or wait for 108.15 breakout...Target on chart...
Weekly chart
MAYBULK Rounding bottomMYX:MAYBULK
Rounding bottom
Slow Turtle Buy on Breakout
FiFT Spike up +ve
MCDX+ Banker spike up, 50% banker
Atom stay above river + starting expand

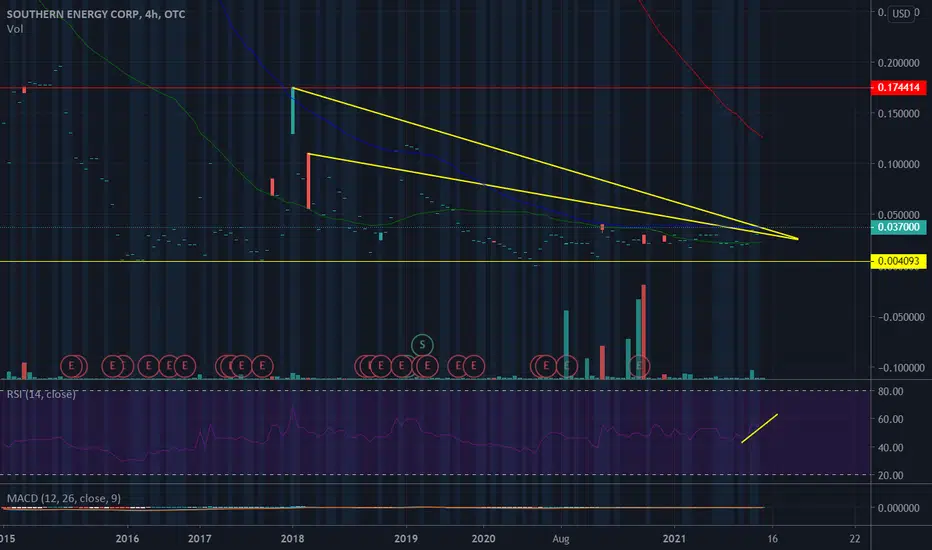
Southern Energy Corp $Maxmf Rounding bottomTSXV Chart with bullish rounding bottom
I love these plays!
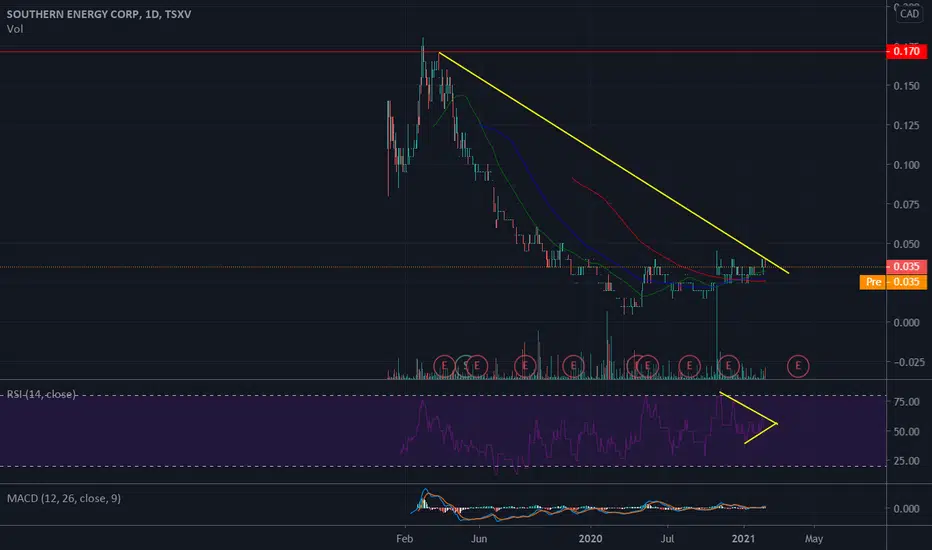
$MAXMF What a GEM! $SOUSouthern Energy 2021 bounce back time! Multiple plays here and patience pays.
#oilandgas #Engergy #lightoil #naturalgas #acquissitions #OTC #TSXV #Roundingbottom
#Maxmf #Sou.V
This ones going to be a fun ride up
Istone Rounding Bottom MYX:ISTONE
Rounding Bottom
Slow Turtle Buy on Breakout
FiFT Spike +VE
MCDX+ Banker 80%
Atom At highway now !!!
SL below 0.24

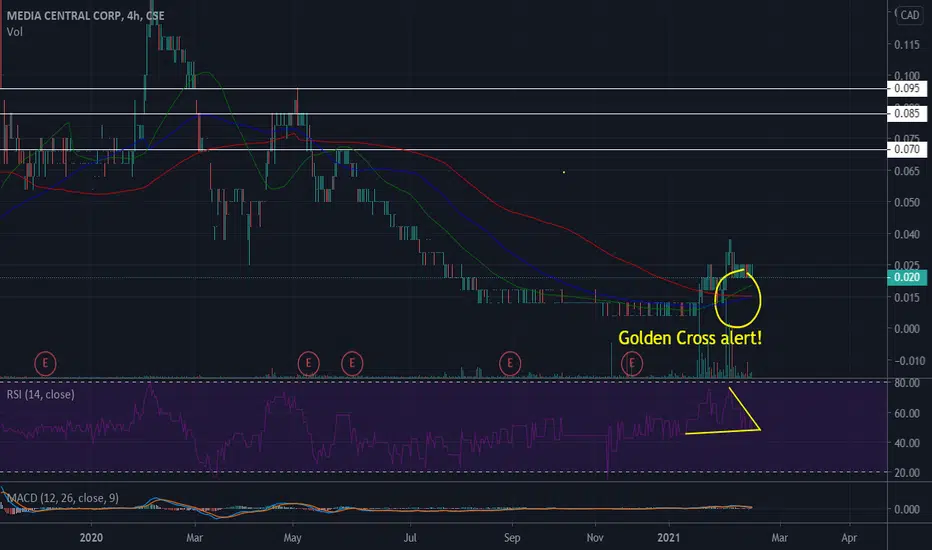
FLYY Golden Cross AlertWatch for the break out on the RSI. #Goldencross is very bullish and volume comes in fast and price can go parabolic. This ones been consolidating slowly and is due for its continuous uptrend. #roundingbottom
PSG USDT Rounding BottomPSGUSDT Rounding bottom is setting up beautifully. This is a mid to long term hold for us taking profits along the way.

$ELIXF Ascending ChannelMid Term and Long Term hold on $ELIXF will reward you greatly
Not a race but once volume kicks in ..... Hold on!

PSG #USDT - Buy the breakoutPSG creating a rounded bottom with bullish momentum and is currently in an ascending channel
We will see a $30 token once again.
#PSG/USDT #PSG/BTC #ascendingchannel #buythebreakout #BTC #USDT

$PSGUSTD #BTCHuge opportunity on #PSG. Rounding bottom with #bullish momentum. Will see $30 again!
Nice rounding bottom forming a cup. Currently in an ascending channel waiting for a breakout
#PSGUSDT #PSGBTC #Blockchain #USDT #BTC #Fantoken

$FLYY Golden Cross Alert Golden Cross Alert
Volume will move in and price will go parabolic
#CSE #TSX #roundingbottom #goldencross #stocktowatch #stocksignal

$FLYY Rounding bottomJust look at that volume the past few days.....Going to break out. Patience!
#cse #volume #roundingbottom #uptrending

Ada rounding up!Ada seems to want to form a pattern that also appears in other Altcoins.
Waiting for the confirmation of the take-off line may be the best strategy to enter the possible rush.
For now you can also settle for the pattern I have drawn or try your luck with some more risk.
In any case, the choice how taking action with your money is up to you... because my opinion can never be an invite to invest or risk your capital but only what i think.
The best of luck!


ISGEC - Weekly chart - Rounding BottomThis analysis is done purely on basis of price action and chart patterns.
The analysis is done on weekly TF hence it can take couple of days to couple of weeks to reach the target.
Logic, SL and Target is shown in image itself.
Also important levels are marked in the chart and one can see how price has respected those levels.
To understand how rounding bottom gives huge moves on breakout on all timeframes, check the analysis of HDFCAMC (15 minTF), DHANUKA (Weekly).
Also, check the chart of PAGE INDUSTRIES (Monthly) for more understanding.
Rounding Bottom in PAGE INDUSTRIES
This analysis is for study purpose. ISGEC is a Heavy Engineering Company having two segments i.e. manufacturing of machinery & EPC.
Traders must do their own study before entering into any trade. Traders should trade with their own risk capacity and money management.
Feel Free to comment for any query or suggestion regarding this stock or Price Action Analysis/Chart Study
