Trade Ideas Position: GBPAUD SHarkA Type2 bearish shark setup for a trading opportunity, looking to stack trade and trade further for target extension. This may provide very good Reward:Risk (RRR)
Rsidivergence

RSI Divergence in Perspective. Home Depot RSI Divergence.This should not be considered advice. Always do your own research.

Trade Ideas Position: GBPUSD BatA bearish bat pattern has shown up in the same region of as the type2 bearish butterfly within sell zone and it is a trend trading setup. Sounds good?
In most cases it is, but for this, there is a warning sign of a bullish flag pattern. Because of this, I do need further confirmation before engaging in this trade.

Trade Ideas Position: GBPJPY BatA bullish bat pattern on a countertrend trading setup came in as an opportunity for countertrend traders. The setup seated on the supply and demand zone and I'm waiting for the 1-hourly candle close for trade confirmation.
I may extend target level.

Trade Ideas Position: GBPAUD CrabA bearish deep crab pattern type2 setup for a countertrend trade. This round, even better it returns with a double top setup with RSI Divergence. How good is that right?
I will need a further confirmation before I engage this trade. A setup like this will take months to complete.

DAX30 Daily Chart Overview: Butterfly and RSI Divergence Bearish RSI Divergence D1
Butterfly 2.24 BC
Have a nice weekend

Trade Ideas Position: GBPAUD CrabA deep crab pattern on the 4-hourly chart suggest a potential countertrend trading opportunity on a type2 setup.
What's better it came in with an RSI Divergence on a double top setup.
I'm waiting for further confirmation to engage this trade.

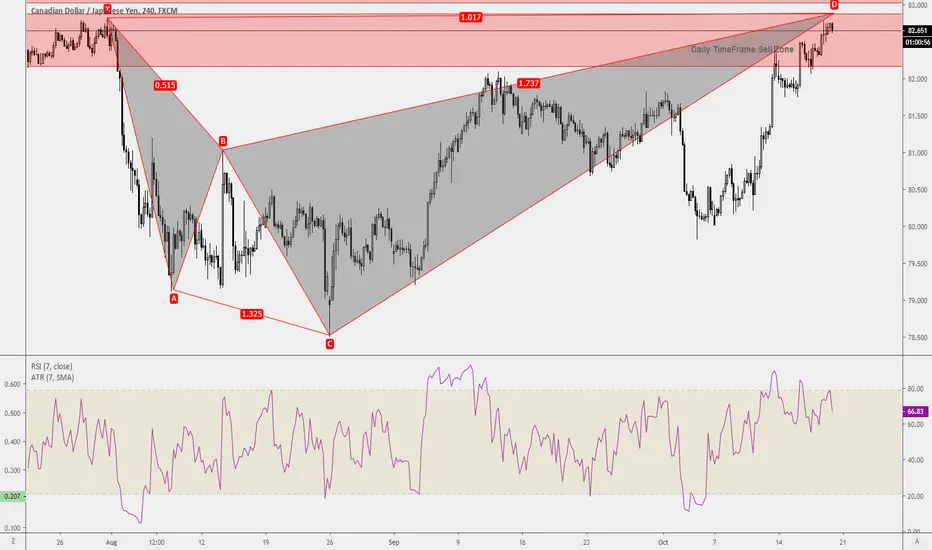
Trade Ideas Position: CADJPY SharkA bullish shark pattern setup as a countertrend trade on a sideways market.
I will wait for market confirmation to engage this trade and as this is a countertrend trade I will not extend any targets, personal preference.

EURUSD-Weekly Market Analysis-Nov19,Wk3A bullish bat is most likely going to form up but looks at Point C, that is a big warning sign as it touches A. I will then wait for confirmation before a trade can be entered.
No doubt the setup happen within the buy zone but that's not good enough.

DAX – RSI Divergence Indicates Reversal OpportunityIn the H1 chart, there is RSI divergence which indicates the buyers losing power.
Above us there is a fresh supply.
The confluence between the RSI divergence and the supply is a great setup to sell the DAX index.

escortsshowing weakness as not going upside and stays in range for 4 sessions with bearish divergence and stable volume can give us good downside move. plan trade accordingly.

Trade Ideas Position: NZDUSD SharkBearish Shark pattern forms up on resistance on both the 4-hourly and daily chart. Based on daily chart it is a trend trading opportunity.
Trade has already engaged.

CADJPY - Short #Forex #ForexTrading #ForexChartWaiting for an entry reason of my own but this could be setting up really nice for a short.
Momentum clearly slowing down with every push after the initial impulse leg.
waiting for a nice entry reason and i will be going short.
RSI divergence clearly at overbought territory
Any questions feel free to ask
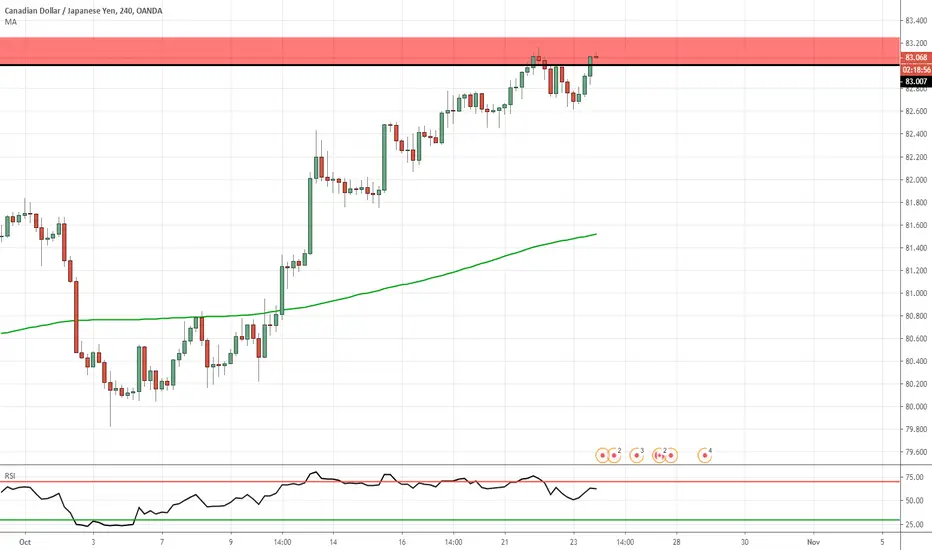
Trade Ideas Position: CADJPY SharkA great reward:risk for this shark pattern even for the 1st target. Pending order will be set as there is also a rising wedge with rsi divergence.
Based on the candle movement in this timeframe, it looks more like a sideways pattern.
AUDUSD Wait for long tradeWhen the price reaches the green rectangle we could enter a long trade, first target could be 0.618 level of fibo retracement or we could wach the market and keep the trade for a little long time.

GOLD RSI Divergence may end the bullish run XAU/USDClearly visible RSI divregence (purple trend lines) on Gold's daily chart. This may not be the right time to invest in Gold. Correction has 2 targets initially and these are 1486$ and 1454$ relatively.
Due to many people invested on Gold at 1200's and 1300's, once the downtrend will start, these people wouold close their positions and take their profits. As a result, the bearish trend would go steeper.

Trade Ideas Analysis: USDJPY DoubleTopA double top set up for a trend trading opportunity for a bigger timeframe within a consolidation zone(red). It's a band trading technique and structure trading for this trade plan.

EU RSI divergenceEURUSD didn't break the 1.0928 support and we can see a bullish RSI divergence on H1 chart


LENDBTC Retest done now pump is coming buy : 51 52
sell : 5 to 30 %
sl : 5%
only and only closing above 52 else invalidate

Trade Ideas Educator: GBPJPY BatHaving Point C touches Point A, this isn't my favourite bat pattern, hence, I didn't place a pending order nor engage the trade right after.
Having an uptrend channel with an RSI Divergence does give me some temptation in engaging the trade but not as enough as the channel was broken.
I will then wait for a retracement for a shorting opportunity.

GBPUSD-Weekly Market Analysis-Sep19,Wk4A bearish shark completes at 1.2528 and right now having an RSI Divergence on this trade within the Sell Zone.
Is this the setup for you?

NZD USD - Daily ChartEarly to say but looks like the pair is within Double Bottom Formation. In addition we can also witness Bullish RSI Divergence at support levels. Will have to wait though for further confirmation
