ETHUSDT – Compression Inside a Triangle, Patience RequiredOn the 4H timeframe, ETHUSDT is forming a clear triangle structure, indicating compression and reduced directional clarity. In these conditions, price reaction at key zones becomes more important than anticipation.
On the 1H timeframe, price has reached the first supply area, where selling orders are present and buyer–seller interaction has already started. From here, a retest of the 3,250 level remains a reasonable expectation before the next decision unfolds.
At this stage, two short-term scenarios are worth monitoring:
If buyers maintain control and price manages to engulf the 4H supply zone at 3,278 – 3,210 with a confirmed close above 3,280, continuation becomes more likely. In that case, after a brief pause or retracement, price could push toward the major supply zone around 3,350.
Alternatively, if the ascending trendline on the 1H timeframe guides price one more time and then breaks, the market may shift into a corrective phase. Under this scenario, a pullback toward the 3,090 – 3,060 area becomes a realistic short-term expectation, as this level aligns with a 1H FL.
For now, ETH remains inside the triangle, and the market has not made its decision yet.
This is a structure that favors confirmation over prediction — updates will follow as price reveals its next move.
`Pouryabdi
RTM

USDJPY – Bullish Drive Toward Second Supply Zone (RTM Outlook)On the Daily structure, USDJPY remains bullish — and the current upward leg began from a key pivot, where price reacted to a QML level and broke its 1H descending trendline, giving strength to buyers and initiating this expansion.
Currently on the 4H, price is sitting inside the first supply zone: 156.900 – 157.200, which has already been tapped once. Buyer strength here is slightly weaker than the previous touch — but the bullish structure is still intact.
For that reason, my primary expectation remains continuation upward toward the second supply zone: 157.333 – 157.577.
That zone is where I will reassess – since that's where a true confrontation between buyers and sellers is more likely to determine whether a larger correction becomes meaningful.
On the 1H timeframe, price is already inside supply. Aggressive (reactive) traders might look for a CHOCH (Change of Character) inside the zone as a trigger to anticipate early correction — but for me, at this moment, I remain on the side of continuation until price reaches the second zone.
Right now, the most valuable action is simply watching how price behaves at the next zone, rather than predicting too early.
Updates will follow once price reaches that area — and that’s the moment where the real market decision will unfold.
`Pouryabdi

Bitcoin in Cage: Bull Trap Warning? Modern PriceAion & Elliott
Bitcoin Next Move!?
Hello traders, this is the AgoraEco team.
As anticipated in our previous analysis, #Bitcoin showed a time-consuming positive reaction around the $80k - $81k zone. Given the sharp drop preceding this move, a slow and complex correction was expected.
📉 The Bearish Case: Potential Bull Trap Currently, we view this ranging structure as a potential Bull Trap from a higher timeframe perspective.
Smart Money & Liquidity: There is significant sell-side liquidity resting below the $81,000 level. From a Smart Money Concepts (SMC) perspective, sweeping these liquidity pools is highly probable before any genuine trend determination.
Technical Confluence: Our analysis based on Elliott Wave Theory and Time Cycles also supports the logic that a deeper correction may be pending.
🔄 Alternative Scenario (The Fakeout) We must consider an alternative path where the "Bull Trap" extends higher. In this scenario, price could push up to create a Fake Breakout (Fakeout) around the $94,000 resistance level to trap early buyers, before completing the structure and initiating a reversal.
💡 Long-Term Outlook & Strategy For long-term holders, the macro view remains bullish. We consider the $80k, $70k, and $60k levels as prime zones for accumulation.
Strategy: Utilizing advanced risk management to scale in (DCA) at these levels is our preferred approach for investment positions.
If you find this analysis helpful, please hit the LIKE button and FOLLOW AgoraEco profile on TradingView for more updates!
Disclaimer: This analysis is for educational purposes only and does not constitute financial advice or a suggestion to buy or sell assets. Please do your own research.

GOOGL – Trendline Break, Pullback & Key Levels to WatchGOOGL maintains a bullish structure on the Daily timeframe — however, lower-timeframe price action has shifted into a more sensitive zone.
On the 4H chart, the ascending trendline has now broken, and price is actively pulling back to retest that structure.
The current area to observe is the $317 – $327 supply zone, where sell orders were previously triggered.
What stands out during this pullback is the decline in trading volume, suggesting buyers are losing momentum while price retraces.
As long as this zone is not engulfed (ENG), the expectation remains toward a corrective push — first into the $300 pocket.
If momentum accelerates during the correction, price may extend toward the second green zone marked on the chart, where a fresh decision awaits.
GOOGL is now positioned in a phase where patience and timing can make a meaningful difference.
For traders who follow structure and order-flow, the coming moves could define the next opportunity window.
📌 Regular updates will follow as the chart develops — staying connected ensures you won’t miss the next key shift.
`P NASDAQ:GOOGL NASDAQ:GOOGL ouryaabdi

EURUSD – First Outlook | Price Testing Supply Again – Weakening On the Daily timeframe, EURUSD is currently reacting to a Fresh Supply Zone that was tapped once before — and now for the second touch, price is sitting inside the H4 Supply Zone. What stands out here is the reduced strength from buyers compared to the previous approach, despite the bullish macro structure still holding.
Because of that, I’m waiting for a clean break of the ascending trendline on H4 to validate a corrective move.
The first downside zone of interest sits at 1.17070 – 1.16821.
If this zone becomes engulfed, then — after a retracement — price may aim toward the deeper support at 1.16573 – 1.16300.
On the bullish side, if we see a confirmed candle close above 1.18095 on H4, continuation of the upward leg becomes the active scenario.
More aggressive traders may even consider confirmation from a 1H close — but for structural reliability, 4H remains the benchmark.
This is not a trading signal — it is a market perspective based on my RTM approach, where price forecasting is driven by unfilled institutional orders left behind in the market.
If this breakdown helps you view the chart differently, stay tuned — updates will follow as structure reveals more.
`Pouryaabdi

Bitcoin at a Strong Demand Zone — Bullish Setup FormingAs mentioned earlier, Bitcoin has reached a strong demand zone, and from this area we expect a potential upside. The conditions for a bullish move seem to be forming, although bullish momentum is still weak. This level needs close monitoring.
If this zone is lost, the analysis will be updated accordingly

Based on the liquidity structure and price reading method (RTM)My personal view on this currency is clearly visible on the chart.
This analysis is purely technical and does not include any fundamental bias.
My method is to identify sentiment, liquidity, and price action (RTM).
BTC Breakdown: Yellow Zone Lost — Red Zone (80K–76K) in SightNow that Bitcoin has lost the yellow zone (98K–99K), further downside is likely, with a potential drop toward the red zone between 80K and 76K

Bitcoin Hits Our Demand Zone — Bounce or Breakdown Ahead?Bitcoin has reached exactly the zone we mentioned. It’s a solid demand area — if it holds, BTC could start a strong upward move, but if it breaks, things could turn bearish

ETH Bearish for Now: Watch the Yellow Zone CloselyKey zones for Ethereum have been identified, but the highlighted yellow zone holds greater importance and stronger liquidity attraction. For now, ETH remains bearish — let’s see how it reacts to these levels

Gold Strategy: Trade with the Trend, Go LongGiven the current conditions in gold, the best strategy is to identify key zones on lower timeframes and take long positions. Always trade with the trend, don’t forget your stop-loss, and manage your position size properly

BTC at Risk: Watch the Yellow Zone CloselyKey zones in Bitcoin — given the current conditions, the probability of reaching the yellow zone is high. If the yellow zone is lost, we could see a move down toward the red zone

#ETH #ETHUSDT #ETHEREUM #Analysis #Update #Eddy#ETH #ETHUSDT #ETHEREUM #Analysis #Update #Eddy
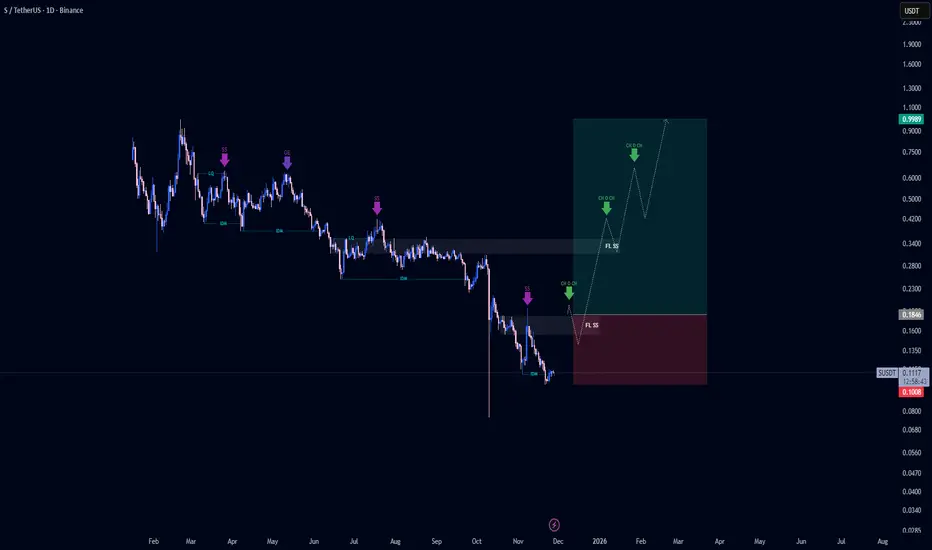
According to the formed pattern, namely QM in the RTM style on the weekly block breaker, I expect an upward movement and a ceiling hunt and an ATH of Ethereum, and also in the ICT and liquidity styles, I expect a Fake BOS and a drop to the weekly block order to liquidate long positions and then continue the upward trend according to the analysis I did on the chart and the Path I drew. I expect the Ethereum currency to act accordingly.
So I expect an upward movement, a drop and a re-rise according to this analysis and explanation.
The important upper timeframe area for volatility has been identified and named.
These settings are based on a combination of different styles, including volume style with ict style and a combination of RTM and liquidity style.
Based on your strategy and style, get the necessary confirmations to enter the trade in these volatility settings.
Don't forget about risk and capital management.
The entry point, take profit point and stop loss point along with their values are indicated on the chart.
The responsibility for the transaction is yours and I am not responsible for any failure to comply with your risk management and capital.
🗒 Note: If, according to the analysis, the progress after the main rise begins, I expect the price of Ethereum to reach the targets of the latest analysis provided on Ethereum, which will be attached.
⚠️ Warning: Predicting market movements is a mistake and this analysis may be violated, so do not rush into your decisions and proceed to trade after obtaining the necessary confirmations. Market makers will always surprise us and predicting movements and future movements is a complex and difficult task.
Check out my previous analysis on Ethereum via the link below :

BTC Key Levels — Eyes on the Yellow ZoneKey zones in Bitcoin… The yellow zone, which has also been optimized, is far more important and we need to watch closely to see how price reacts there

Bitcoin Near Critical Red Zone – Support or Further DropBitcoin is approaching the red zone, and if it fails to hold, it could drop to around 103,200 or slightly lower. We need to wait and see how it reacts. The current support should not be underestimated — we’re keeping a close eye on it

EUR Futures analysis I am looking for to continuing compression at EUR futures (EurUsd) chart
According to Engulf of the lower flag limit; i am waiting for continue drop.
This analysis could mean that US inflation could spike again on Thursday's news.
We'll just have to wait and see.

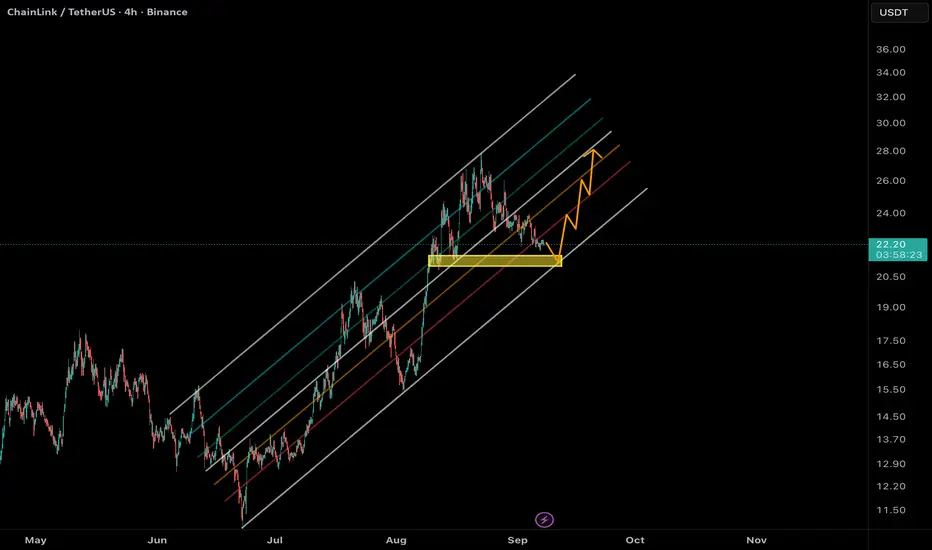
Chainlink (LINK/USDT) AnalysisLINK is currently trading around $22.2.
According to the ascending channel structure, if the price pulls back to the channel support near $21.4, we could expect a potential bullish reaction from this level.
🎯 Possible upside targets in case of a rebound:
• $23.8
• $26
• $28
⚠️ However, if the $21.4 support fails to hold, a deeper correction toward $20 may occur.
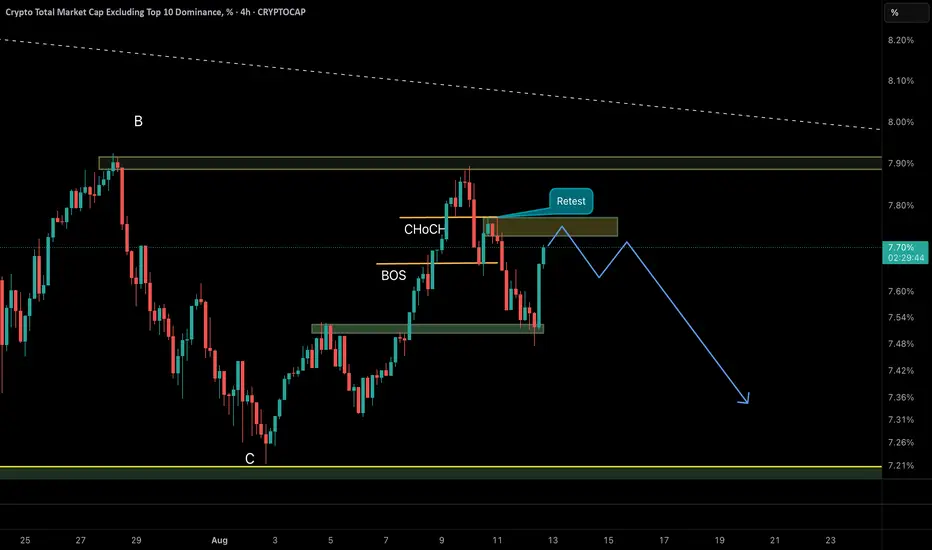
AltCoin Dominance bearish set up After Change of Character and Brake of Structure the altcoin dominance is going to retest the supply zone as shown in graph .
we are waiting to rejection from this zone and another bearish wave
Bitcoin (BTC/USDT) – Bearish Scenario Remains in Focus4H Chart Analysis – Structural + Price Action Insight
Bitcoin is currently trading inside a descending minor channel (orange), which is part of a larger complex correction pattern, potentially a contracting running flat or diametric in NeoWave context. The sequence A to G may suggest that the market completed its G-leg after bouncing off the lower support.
Now, BTC has reached the upper boundary of the orange channel, which aligns with a strong resistance zone around 116.8K–117K.
⸻
✅ Primary Scenario (Bearish Bias):
As long as BTC fails to break and sustain above 116,800 – 117,000, the current move can be interpreted as a pullback within the correction, with high probability of price heading back toward the green liquidity/support zone near 110,800 – 111,400.
This could be a continuation of the broader corrective structure, or even the beginning of a new downward cycle.
⸻
❗ Alternative Scenario:
If bulls manage to break above 117,000 with strong momentum and confirmation (e.g., breakout + retest), the structure may shift bullish with short-term targets near 118,500 – 120,000.
⸻
🎯 Key Takeaways:
• Watch price action closely at the current resistance zone.
• Bearish confirmation (e.g., bearish engulfing, rejection wicks, or supply absorption signs) is required before considering short entries.
• High R:R setups emerge near channel extremes with clear invalidation levels.

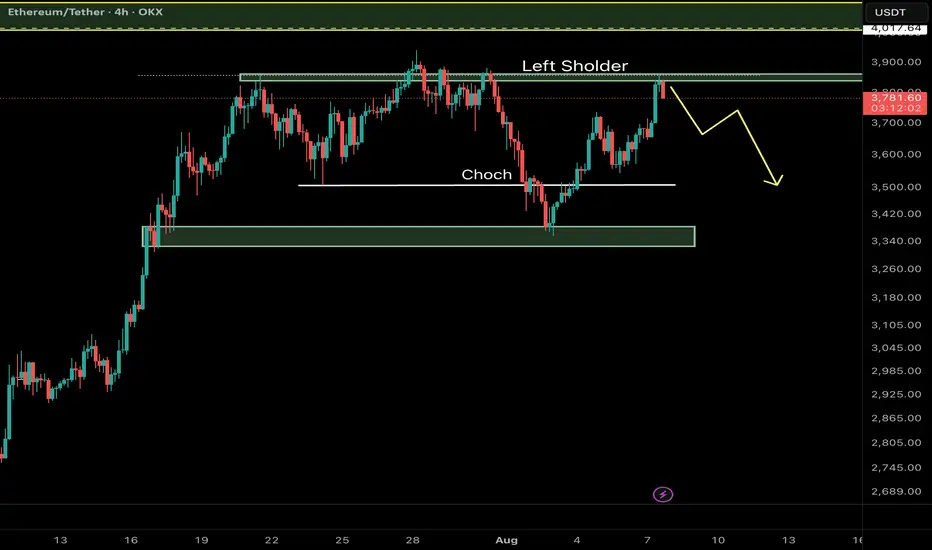
Ethereum (ETH/USDT) – Key Reversal Zone RetestAfter a major CHoCH (Change of Character) on the 4H timeframe, Ethereum has shown a strong bullish move from a high-probability demand zone and is now retesting a critical resistance area aligned with the Left Shoulder of a classic RTM pattern.
⸻
🔍 Key Technical Elements:
• CHoCH confirms the shift from a distribution phase to accumulation.
• Strong reaction from a demand zone near $3,340–$3,380.
• Price is now testing the Left Shoulder, which often acts as a reaction zone before continuation.
⸻
📌 Potential Scenarios:
🔼 Bullish Case (Primary):
If ETH breaks and closes above $3,870, a move toward the next liquidity pool around $4,010–$4,050 is likely.
🔽 Bearish Case (Alternative):
Failure to hold above the current resistance may lead to a pullback toward the $3,340–$3,380 demand zone for another accumulation attempt.
⸻
💡 Educational Note:
In RTM methodology, retests of the Left Shoulder after CHoCH are considered one of the most efficient entry zones — especially when confluence with liquidity voids or imbalance exists.
Follow for more Smart Money & RTM insights.
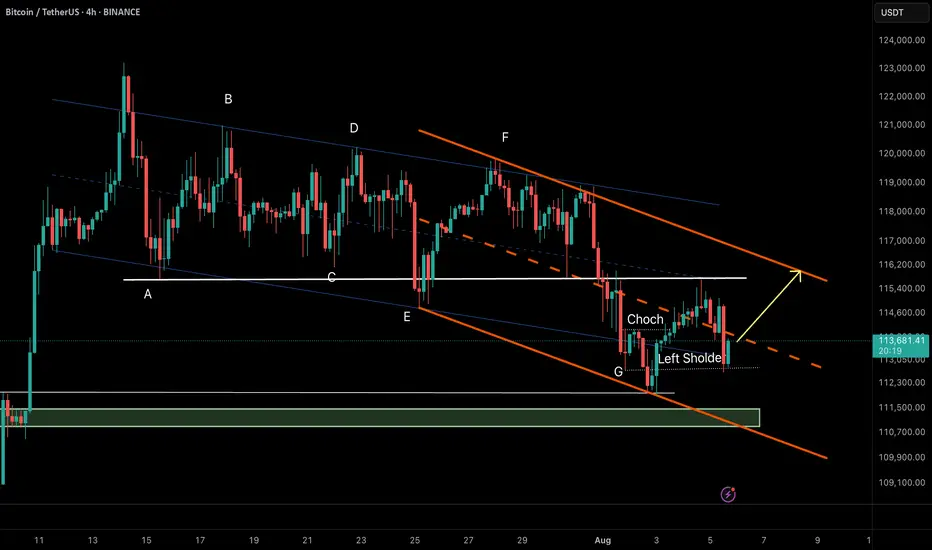
Bitcoin (BTC/USDT) – RTM Reversal Pattern in Action🔸 Market Structure:
Bitcoin has formed a descending channel after a prolonged correction. Recently, price tapped the channel bottom and printed a CHoCH (Change of Character), indicating a potential reversal.
The price has now retraced to the left shoulder of a potential inverse head & shoulders pattern—an RTM classic structure—which held as support, suggesting bullish continuation.
⸻
🔸 Key Technical Signals:
• ✅ CHoCH confirmed at demand zone near $112,300
• ✅ Retest of the left shoulder validates bullish structure
• ✅ Holding above the internal bullish trendline
• ✅ Price aiming toward upper channel resistance
⸻
🎯 Target:
$116,200 – Top of the descending channel & next key resistance.
❌ Invalidation:
Break and close below $112,800 would invalidate the current RTM setup and open room for deeper correction.
⸻
📌 Summary:
This is a textbook RTM reversal:
CHoCH → Retracement → Left Shoulder Test → Continuation
As long as the structure holds, we remain bullish toward the channel top.
Ethereum - DAILYHi
Ethereum Daily on Sell position...
Be careful and take advantage of the opportunity.

TRBUSDT Setup – Staggered Exits, Smart Profits📌 Entry: 36.70
🎯 TP1: +10% → Secure 50% of position
🛡️ Move to risk-free after TP1 to protect capital
🎯 TP2: Take 50% of remaining volume
🎯 TP3: Close all remaining volume
Calculated exits. Risk-managed. Momentum-ready.
