Five Bubbles of TechnocracyGreetings, reader. Happy New Year!
The year 2026 is here—and it looks to be a challenging one for the bulls.
With it comes the "beginning of the end": the predictable bursting of the AI bubble. Your idols—Nvidia, OpenAI, massive Data Centers, and other tech icons that seemed to grow to the heavens—are finally falling back to earth. The speculative froth is evaporating, and the panic-stricken crowd is frantically searching for the Emergency Exit . There is nothing new under the sun: after a period of excess in the Western equity markets, we are witnessing yet another tragicomedy accompanied by the indignant cries of: “I never saw this coming!” 🤦♂️
Most analysts and investors are blinded by the current brilliance of the Data Center and AI bubble. They argue over Nvidia’s fundamentals and debate the exact timing of the crash. This is mere noise obscuring the grand design. This article is not about the AI bubble as a "random" or "unforeseen" failure. It is about the fact that financial bubbles over the last 50 years have not been anomalies—they are logically necessary, sequential stages in the construction of a Global Technocratic Infrastructure .
Each cycle served a specific purpose: attracting billions, then trillions of dollars to build a new layer of the system before collapsing to eliminate weak participants. Technocracy is being built according to a precise blueprint, and we can track its evolution through five sequential speculative cycles, each solving a bottleneck created by the previous one.
The Five Stages of Evolution: From PC to Nuclear Autonomy
1️⃣ The Genesis (1980s, Nifty Fifty): Establishing the user and the data collection point (PCs and mass electronics).
2️⃣ Connectivity (1990-2000, Dot-com): Laying the data highways (The Internet and fiber optics).
3️⃣ The Brain (2020-2025, Data Centers/AI): Developing the intelligence to process this colossal flow of information.
4️⃣ Order (2026–2028 Forecast, DLT/Tokenization): Systematizing and automating ownership, data, and assets.
5️⃣ Autonomy (Post-2030 Forecast, SMR/Uranium): Ensuring the invulnerability and uninterruptible power of this energy-intensive global system.
The "new money" gamblers—I mean, "young investors"—who bought the peaks will spend 2026 screaming about "Black Swans," searching the news feed for reasons why their favorite stocks are crashing. We, looking at the long-term horizon, must simply state the facts: we are witnessing the collapse of yet another financial bubble . It has already fulfilled its mission: attracting trillions to build the Artificial "Brain" (AI/DC) for the future technocratic system, redistributing capital from the greedy to the disciplined, and from retail to the institutional players.
For most, the 2026 crash will be a tragedy. But for insiders and my subscribers, it is the return of common sense, logic, and objective reality . The coming collapse is a sobering moment from the "AI-idiocracy" and the market madness of the last two years. It is the short-lived triumph of the truth we have analyzed here for years—a return from the pink clouds of AI hallucinations to the solid ground of reality .
The Five Bubbles of Technocracy is not just a market cycle analysis; it is the revelation of a grand design . The construction of a Digital Infrastructure of Control is not a future dream; it is a global conceptual project that uses the crowd's speculative mania as a free capital pump. This article will show how this pump has functioned for 50 years and where it will direct capital in the coming decade.
❗️ Disclaimer: A brief note for new readers. My goal is not to offend, but to analyze clearly. To understand these processes, we must call things by their real names —without sugarcoating. If you are accustomed to mainstream media and "influencers" who tell you polite half-truths and pleasant lies, this analysis may not be for you. The truth can be bitter, but it destroys illusions. If you are not ready for that, do not read further.
Let’s dive in!
________________________________________
📟 Introduction: The Era of Technocratic Bubbles
________________________________________
⚙️ From Nifty Fifty to SMR: How Speculation Funded the Global Technocratic Order. This article is not about the "AI bubble" as an error; it is an obituary for 2025 and a manual for the next 5-10 years. I will demonstrate that the financial bubbles of the last 50 years are not a random series of crises, but logical, sequential steps in assembling a global infrastructure. Technocracy follows a cyclical plan. The current crash is merely the final chord of Bubble #3 and the launchpad for Bubbles #4 and #5.
The Five Stages of Evolution: Where the Capital Flows We will trace this path to see how the 2026 collapse clears the field for a new, even more cynical speculative mania:
🎈Bubble #1: Creating the User (1980s): Established the point of data collection.
🎈Bubble #2: Connecting the Network (2000): Laid the global internet channels.
🎈Bubble #3: Building the "Brain" (2020–2025): Created the intelligence currently undergoing a painful revaluation.
🎈Bubble #4: Order and Control (2026–2028 Forecast, DLT/Tokenization): The next mega-bubble. Capital will flee to where they promise to "systematize" data through DLT and smart contracts.
🎈Bubble #5: The "Perpetual" Engine (Post-2030 Forecast, SMR/Uranium): The strategic goal—ensuring energy autonomy for the entire system.
________________________________________
🖥️ Part I. Building the Crowd, the Internet, and the Algorithms: Bubbles #1, #2, and #3
________________________________________
💥 Bubble #1: The Nifty Fifty and the Rise of Japan (1980s). Establishing the Data Collection Point (PCs and Electronics)
What was the Nifty Fifty? It was a list of approximately 50 "blue-chip" stocks in the late '60s and early '70s that were considered so reliable and innovative that investors believed in their "eternal growth," regardless of economic cycles. This bubble was directly tied to the rapid proliferation of electronic and computer technology, which ceased to be the exclusive domain of corporations and states. The transition from Mainframes to PCs: the emergence of personal computers (Apple II, Commodore 64, IBM PC) was a turning point. Technology became personal, understandable, and affordable due to economies of scale. Introducing PCs into homes and small businesses created millions of "users" for the first time. This was a critical aspect for the Technocracy—establishing a population base accustomed to generating and digitizing data.
📈 Chart: Nikkei 225 (1950 — 2040)
The Japanese index INDEX:NKY Nikkei 225 serves as a colorful historical example, tracing its trading history from the 1950s to the present. To put it briefly: following the end of WWII, when the world was re-divided into spheres of influence, the United States invested heavily in the development of Japanese industry, specifically in various technologies. This was a strategic investment in a technocratic ally and a manufacturing hub.
The Pump Phase (1950s – 1980s): The Nikkei 225, acting as the locomotive of the tech boom, grew without serious pullbacks until the late 1980s. Even the 1973 oil crisis, which hit Western nations hard, largely spared Japan. The index saw only a minor -35% correction before surging +1000%, setting an all-time high and nearly touching the 40,000-point mark by the early 1990s. This was the peak of the technocratic premium for creating mass-market consumer electronics and PCs, which successfully solved Task #1: creating a global "user base. "
The Payback and Decline Phase (1990s – 2008): Once the Nifty Fifty bubble and the associated Japanese real estate boom burst, the Japanese stock market entered a prolonged, "fascinating journey" of a downtrend that lasted 19 years, resulting in a -80% drop from its ATH. Japan had fulfilled its function, and capital flowed toward the next objective.
The Recovery (2008 – 2025): Amidst the 2008 global financial crisis—after dropping -60% from its local high and retesting the 2003 lows—the index began a long, slow recovery. Only in 2025 did it finally surpass the peaks of the bubble from 36 years ago. It took the Japanese index three and a half decades just to recover to its 1980s highs!
The Big Question: Is the Japanese economy doing so well today that the index is hitting new highs? Hardly. The reality is quite the opposite. Japan's national debt leads the world at over +250% of GDP 🤯 and continues to grow. Chinese and Korean competitors have long since captured market share and technology leads, Japan's demographics are in terminal decline, and the country lacks both resources and territory. However, they have a printing press, the "Carry Trade," and a strong alliance with the US. This maintains the facade of the Japanese economic "miracle." This is what the life-giving power of infinite money emission, carry trades, and zero interest rates does to asset prices and the INDEX:NKY index.
◻️ In the 1980s, the world wasn't ready for AI yet, but it was ready for a "new era of eternal growth." This was the first major speculative premium the market paid for technological dominance.
The Nifty 50 Idol: This group of stocks (IBM, Xerox, Polaroid, etc.) traded at astronomical P/E ratios. Investors believed these companies were "too big to fail." This was the first instance of faith in a technocratic elite that supposedly held a monopoly on the future. This faith was pure speculation, disguised by the slogan: "technology is invincible."
The Fundamental Order: The purpose of this bubble was practical: attract capital to scale production and, most importantly, make PCs and electronics affordable. The Technocracy didn't just need mainframes for the Pentagon; it needed a "mini-PC in every home"—in other words, data collection points.
The Role of Japan: Japan acted as the primary innovator of mass production. Companies like Sony and Toshiba made technology fashionable and accessible (Walkman, color TVs, semiconductors). The Japanese real estate and stock market bubble of the '80s was simply a colossal financial pump that provided the Technocracy with its necessary user base.
◽️ Bubble #1 Outcome: The bubble burst, fueled by the "eternal growth" of the Nifty Fifty, but it left behind the essential: millions of people accustomed to computers and devices, and a global manufacturing base to create them. The User was created, the crowd was ready. Moving on.
________________________________________
🌐 Part II. Bubble #2: The Dot-com Crash (2000). Building the Data Highways (Internet and Connectivity). Communication Infrastructure as the Logical Growth of Technocracy
________________________________________
If the 1980s focused on computerizing individual locations (the PC), the 1990s created an urgent need to connect those millions of computers. The emergence and standardization of the Internet i as a public network was the solution. Technocracy shifted from creating individual tools to building a global communication system.
The "Pipes" and Speed: Colossal investments flowed into laying fiber-optic cables and manufacturing networking hardware (Cisco Systems) . The prevailing belief was that "bandwidth" could never be excessive.
Network Software: An explosion of companies creating web servers, browsers, and early online services (AOL, Yahoo!) . This marked the transition from local software installed on a disk to networked software.
Profitless IPOs: In the final phase, thousands of companies went public with nothing but a business plan and a .com domain. The key metric wasn't profit, but "eyeballs" or user count. Thus, WEB 1.0 was born.
The Technocratic Move : The bubble created the channels for data transmission. Technocracy realized its networked nature and laid the "arteries" necessary for the PCs of the 80s and 90s to exchange information.
📈 Chart: NASDAQ-100 (1990 — 2040)
When the "Japanese Economic Miracle" was sidelined in the early 1990s, leaving the Nikkei 225 to fall -80%, capital was already redirected to the next task. During the decade Japan’s market spent in a knockout, the US index FX:NAS100 surged +2000%.
The Pump Phase (1990s): The Dot-com bubble was a cynical fundraising campaign to lay global arteries—fiber-optic networks and communication protocols. In March 2000, it hit an ATH of 4800. This was the premium paid for the promise of connecting the "crowd" established in Bubble #1.
The Payback Phase (2000–2002): Once the infrastructure task was essentially solved (the pipes were laid), the bubble burst. In a two-and-a-half-year decline, the NASDAQ-100 crashed -83%, bottoming out just below 800 points.
The Recovery: It took the index sixteen years just to reclaim its 2000 ATH. This clearly demonstrates that once a strategic mission is completed, an asset class can be left in stagnation until it is needed again.
Key Insight: The Role of Post-2008 Liquidity. Even the 2008 Global Financial Crisis didn't crush the NASDAQ-100 as severely as the dot-com bust; it fell "only" -54% from its 2007 highs, without breaking the 2002 lows.
A New Driver: From 2008 onward, a new and much more aggressive game began. We’ve seen an almost uninterrupted rally, showing over +2000% growth from the 2008 lows.
Selling the Narrative: While the growth of the tech-heavy NASDAQ-100 can still be "sold" to the crowd using the success of Big Tech giants, why are European, British, and Japanese indices hitting new ATHs today? The answer is simple: the true driver is not earnings, but liquidity, carry trades, and buybacks , fueled by media narratives and hype.
Focus on GLI: Since 2008, the Western stock market has essentially acted as a STERILIZER for excess liquidity from the Eurodollar system . Looking at the Global Liquidity Index (GLI) chart, it is clear what the PRIMARY driver of stock market growth really is. The media narratives used to explain the rally to the masses are secondary.
Conclusion: The Dot-com bubble created the channels (The Internet). The 2008 crisis created an unprecedented flood of liquidity, providing the fuel for the next stage: creating the Brain to process the data flowing through these channels.
◻️ The Dot-com bubble was about infrastructure and access. Once the masses had their computers and gadgets, the logical problem arose: how to connect them into a single network so data could flow freely?
The "Pipes" Bubble: This was a pure infrastructure bubble. Speculation revolved around companies promising to lay fiber (WorldCom, Global Crossing) or sell the hardware for it i . Investors poured billions into profitless companies that simply had a plan to "build the tubes."
The ".com" Hysteria: The tragicomedy peaked when any company with a ".com" suffix was hailed as the future—even if they were losing money on every transaction. Behind this circus was a strategic mandate.
The Fundamental Order: Lay the arteries for WEB 1.0, WEB 2.0, and eventually WEB 3.0. For Technocracy to manage the world, it needs advanced communication channels. This bubble forced private capital to fund a global network that otherwise wouldn't have been built so rapidly.
The Cynical Outcome: The bubble burst, leaving behind "dark fiber," bankrupt telcos, and thousands of failed businesses—but the infrastructure remained. The survivors (Google, Amazon, eBay) inherited cheap, surplus data channels. These companies later used this infrastructure to collect and process the data that would lead us to Bubble #3.
◽️ Bubble #2 Outcome: The bubble left behind the communication channels (The Internet). The masses are now connected and constantly generating data.
________________________________________
💻 Part III. Bubble #3: Creating the Intelligence—Data Centers and AI (2022–2025). The Construction of the "Brain" (Big Data Processing) 🧠
________________________________________
After the previous two bubbles created billions of connected devices and a global network, we faced a new bottleneck: there is too much data, and it moves too fast.
The Primary Driver: The urgent need to process, analyze, and monetize vast volumes of information in real-time.
The Technocratic Shift: The focus has moved from communication infrastructure to "intelligence" infrastructure. Ownership of data is no longer enough; the value now lies in the ability to "digest" it for automated decision-making and social control.
Generative AI (LLMs): The rise of Large Language Models (ChatGPT and its peers) proved that AI could be a mass-market, transformational product, sparking a global corporate arms race.
Data Centers (DCs) and GPUs: Training and running these models requires astronomical computing power provided by hyperscale Data Centers. Specialized GPUs i became the literal "accelerants" of this technocratic evolution.
Concentration of Power: Unlike the Dot-com era, speculation today is concentrated in a handful of Mega-Caps that control the silicon and the cloud platforms.
As of late 2025, the AI bubble’s momentum is visibly fading. Beyond the hype of "AI will save us all," we must account for the Political Engineering factor.
The Political Trigger: In the context of a shifting liberal world order and internal corporate-oligarchic friction in the US, the stock market is more sensitive to political influence than ever before.
The Game of "Hot Potato": The AI bubble was inflated under the Biden administration starting in 2023. Now, the Republicans and Trump face the fallout in 2026—just in time for the Congressional Midterm Elections. The MAGA team’s delay in forcing the Fed to aggressively cut rates in 2025 has left them vulnerable. The longer you stretch the rubber band, the harder it snaps back.
The November 3, 2026 Midterms:
1. All 435 seats in the House of Representatives are up for election.
2. 35 out of 100 Senate seats are at stake.
3. 36 State Governors will be elected.
4. Thousands of state legislative and administrative positions are on the line. A crash in 2026 would likely lead to a "Divided Government," blocking the MAGA agenda and creating a springboard for the Democrats in 2028.
◻️ The "Rescue" Scenario: The appointment of a new Fed Chair in 2026 will likely be marketed as a "market rescue," launching another round of unlimited QE (Quantitative Easing). The Eurodollar system cannot function without it, but new QE requires a catalyst: a sharp "Risk-OFF" event and a market correction of -40-50%, similar to 2008. The fiat model survives only on FAITH and liquidity injections.💸
◻️ Price vs. Value: Do not confuse speculative bubbles with technological progress. The Price of overextended AI stocks is not the same as the Value of the technology itself. Just as the PC survived the Nifty Fifty crash and the Internet survived the Dot-com bust, AI will continue to integrate into our lives after the 50% "sobering up" of 2026. This isn't an accident; it's the end of Stage Three.
The Bottleneck: 40 years of digitization (Bubble #1) and global networking (Bubble #2) left us with a mountain of data that was useless without a way to "digest" it.
The Fundamental Mandate: Create the "Brain"—AI algorithms and Data Centers capable of real-time global management.
The New Idol: Investors deified the chips i and the cloud (Microsoft, Amazon) . The speculative premium was paid for the expectation of a monopoly on intelligence.
The Strategic Outcome: The crash doesn't mean AI failed. It means the capital required to build the core infrastructure i has been successfully harvested and deployed.
◽️ Bubble #3 Outcome: The AI/DC Bubble is the culmination of the previous cycles. It elevates the Technocracy by making computation the central nervous system of society. However, this system has two critical vulnerabilities that lead us directly to the next two cycles:
1) Data Order: Data is collected and processed, but it must be systematized, secured, and property rights must be automated (Enter Bubble #4).
2) Energy Demand: The unprecedented power required by Data Centers makes energy the next critical "commodity" (Enter Bubble #5).
This part of the translation deals with the transition from "Intelligence" to "Systematization." I have adapted the sharp Russian metaphors (like the "rectal suppository" analogy) into a more sophisticated but equally biting critique of financial engineering and behavioral economics that will resonate with the Western "contrarian" and "macro" investment communities.
________________________________________
🏦 Part II. Asset Systematization: Bubble #4 (2026–2028 Forecast)
________________________________________
🗣 "We’ve always used technology to better serve our clients, and we’re going to do the same with tokenization. Tokenization and blockchain are real." — Jamie Dimon, CEO of JPMorgan
🗣 "Tokenization is the future. It’s time to move all assets onto the blockchain." — CEO of Coinbase
🗣 "The potential for tokenization extends to real estate, stocks, bonds, and beyond. The industry is only at the beginning of this journey." — Larry Fink, CEO of BlackRock
🔗 Bubble #4: DLT and Tokenization. Establishing Order (Distributed Ledger Technology and Smart Contracts). Systematization, Transparency, and Automation of Assets.
The AI/Data Center bubble (#3) generated an incredible amount of data and algorithms but failed to solve a fundamental problem: how do we manage ownership rights and automate transactions for this data and the real-world assets they represent?
The Primary Driver: The demand for absolute transparency, immutability, and automated management. Traditional financial and legal systems are too slow and expensive for a real-time world.
The Technocratic Shift: Technocracy is moving toward an automated, transparent asset management system. This eliminates intermediaries, standardizes processes, and makes the entire system controllable at the protocol level.
Tokenization: Converting real-world assets (Real Estate, Private Equity, Commodities, Stocks) into digital tokens. This opens the door to massive liquidity and fractional ownership, attracting trillions of dollars.
Smart Contracts: Code that automatically executes transactions without lawyers or banks. It is the perfect tool for technocratic automation.
DLT/Blockchain: The technology that ensures ledger immutability, removing the need for centralized trust.
📈 Chart: GLI, S&P 500, and Selected DLT Assets (2019 – 2029)
In the previously published analysis: 🩻 Anatomy of AI Illusions. 2026–2028 Forecast , I broke down the pump mechanism of 2021-2025.
The Master Driver — Liquidity: Since 2019, the S&P 500 and the crypto market have moved in lockstep with the Global Liquidity Index (GLI). When liquidity is drained ("dried up"), a correction follows. When the system is flooded with "helicopter money," it flows into high-speculation bubbles to vent the excess pressure. The masses, lured by media and "fin-fluencers," buy the peaks, burning their capital to fund the next stage of Technocratic development.
The mechanism is simple, bold, and cynical — but highly effective:
1) Organize a crisis and panic (buy up devalued assets) →
2) "Save" everyone by printing piles of paper — QE (continue accumulation) →
3) Distribute cash to the masses under the guise of "care" (continue driving prices up) →
4) Inflate a market bubble in the sector of your choice (begin stealthy offloading) →
5) Use media and social networks to lure "dumb retail" into buying at the highs (sell more aggressively) →
6) Continue offloading into the naive herd, feeding them stories via MSM while the market slides →
7) Organize a new crisis and panic (begin buying back the necessary devalued assets) →
8) Once the plebs have forgotten everything, or "new" un-scared investors enter the market — repeat the scheme...
The "greater fool" theory remains the most reliable engine of the financial world. 🤷♂️
The GLI Cycle and QE Synchronization: According to the CrossBorder Capital GLI model, we expect a peak in late 2025 followed by a decline through 2027. Markets will likely bottom out in late 2026 amidst falling liquidity, aggressive rate cuts, the AI bubble burst, and a "post-facto" recognition of a global recession. In late 2026, a new Fed Chair will step in to "save" the US economy. 2027 will see a recovery, and 2028 will bring the explosive culmination of Bubble #4. The goal of this new QE is to absorb old debt through stablecoins and "trap" the digital dollar in a regulated loop, preventing it from leaking into the physical economy and causing hyperinflation.
🛠️ The Instruments for Bubble #4:
For the "Tokenization of Real-World Assets" (RWA), institutional capital needs controlled, scalable platforms. I have selected three primary "horses" for Bubble #4: Ethereum (ETH), Solana (SOL), and Hedera (HBAR), along with three infrastructure plays:
Ethereum (ETH): The Regulatory and Institutional Hub. It provides the financial gravity needed to legitimize the RWA market.
Solana (SOL): The High-Throughput Engine. Its "VISA-level" speed is critical for high-frequency trading and billions of micro-transactions.
Hedera (HBAR): The Enterprise Ledger. Governed by a council of global corporations, it provides the legal maturity and security required by supra-national organizations.
Infrastructure Plays: Chainlink (LINK) as the bridge between smart contracts and real-world data; Avalanche (AVAX) for institutional "subnets" with KYC/AML compliance; and Polygon (POL) as the mass-adoption gateway for Web2 brands.
❓ Where is BTC? Bitcoin is the "evergreen bubble." Its job is to be the billboard and the locomotive for the industry. But being first doesn't mean being the ultimate winner. Think of the pioneers: IBM 5150, Motorola DynaTAC, Nokia 9000, Kodak. Where are they now? Most are either gone or secondary players in the indices. Bitcoin will likely face a similar fate once its function is fulfilled.
💡 Why Bubble #4 is Inevitable:
The "Smart" Data Flood: Every gadget today—from "Smart" TVs and watches to Tesla cars—is a sensor (Camera, Mic, GPS) gathering data. This creates a chaos of information that requires a unified, automated ledger.
The Trust Crisis: To function, the Technocracy needs stable ledgers, not chaotic, open-source forks. DLT is not for "crypto-anarchist freedom"; it is for the stability and invulnerability of the system’s records.
The RWA Narrative: After 2026, DLT will be marketed as the "savior" from a corrupt, slow banking system. It will facilitate the digitalization of everything—Real Estate, Commodities, and Equity—into an automated, traceable turnover.
◽️ Outcome of Bubble #4: From Dot-com to Tokenization
The 2026-2028 DLT bubble is the logical heir to the Dot-com era. If Dot-com built the pipes for information , Tokenization builds the protocols for value and ownership . Most crypto-influencers miss the big picture. They pray for an "Alt-season" in their sandbox while failing to see that the cryptomarket was created as a testing ground for a new digital economy . If the public isn't ready for a direct "CBDC" injection (as seen in the failure in Nigeria), the system will introduce it through the "back door" via stablecoins and RWA. By 2030, after "The Great Depression v2.0" and "Great Reset" of old debts, the infrastructure will be ready for the final step:
DLT → Digital ID → CBDC → UBI
Technocracy will achieve (die Ordnung) Order!
________________________________________
⚛️ Part III. The "Perpetual" Engine: Bubble #5 (Post-2030 Forecast)
________________________________________
⚡ Bubble #5: SMRs, Microreactors, and Uranium. Establishing Autonomy and Invulnerability. Uninterruptible Power and Infrastructure Defense
The Problem: Conventional, centralized power grids cannot keep up with the exponential growth in demand from Data Centers, each requiring megawatts of power comparable to a small city. A technocratic system built on blockchain and AI cannot rely on unstable or centralized infrastructure.
The Primary Driver: The need for autonomous, powerful, and secure energy sources that can be deployed locally—next to consumption hubs like Data Centers, industrial clusters, and remote strategic facilities.
SMRs (Small Modular Reactors) and Microreactors (μR): These are the ideal solution. They can be mass-produced, rapidly deployed, and placed directly adjacent to hyperscale DCs. This eliminates long-distance transmission losses and makes the "Brain" of the system energy-independent.
Satellite Internet: Continued investment in low-earth orbit (LEO) networks (Starlink, Kuiper) ensures global, resilient connectivity. The ultimate vision—already hinted at by the likes of Elon Musk—is an autonomous "3-in-1" orbital complex: a satellite equipped with its own SMR and on-board Data Center. This is the ultimate guarantee of security, far removed from any "ground-level" threats.
The Technocratic Shift: Creating an invulnerable, distributed, and energy-autonomous system. This is the final stage that makes the entire technocratic structure truly self-sufficient and globally dominant.
◽️ Thus, Bubble #5 is the final chord. Once completed, the infrastructure will be fully realized:
1. Users and Data (The 80s).
2. Connectivity (The Dot-com era).
3. Processing Intelligence (The AI/DC era).
4. Systematized Order (DLT/RWA).
5. Autonomous Energy (SMR/Uranium).
The sequential construction—from PCs to global AI Data Centers and DLT networks—has generated a critical energy deficit.
The Bottleneck:
The infrastructure built across the first four bubbles is an energy-hungry beast. Centralized grids cannot provide the stability or autonomy required.
The Fundamental Mandate: Energy Autonomy. Technocracy cannot depend on political shifts, geopolitical conflicts, or the intermittency of "green" energy—we'll leave those for the distracted masses. It requires its own local, powerful, uninterruptible power source.
The New Idol: Small Modular Reactors (SMRs). Forget the old, cumbersome nuclear plants of the past. We are entering the era of compact, factory-built energy units acting as "batteries" for the industrial and digital elite.
The Speculative Core: This bubble will be marketed under the banner of "Energy Independence," but its true purpose is to fund the global energy pivot toward autonomous AI and DLT networks.
The Raw Material: Bubble #5 transforms Uranium from a mere commodity into the strategic fuel of the future civilization. This is the ultimate long-term investment thesis: uranium demand will grow exponentially to feed these autonomous nodes of power.
☢️ Uranium: Its Future and Ours. 2026–2050 Forecast
⬇️ Link to the detailed analysis: ⬇️
🔑 Strategic Insight: The Speed of Cycles Not all bubbles are created equal. Bubbles #1 and #2 (PC and Internet) moved slowly because they required physical construction —laying fiber, building factories, and logistics. Bubbles #3 and #4 (AI and DLT) are lightning-fast because they are "born digital" and leverage existing hardware. Here, the "Hype-to-Crash" cycle has compressed from decades into 3–5 years.
Bubble #5 (SMR/Uranium) is a return to physics . You cannot "copy-paste" a ton of uranium or spawn a thousand nuclear reactors overnight. This cycle is tied to the slow, fundamental commodities super-cycle. It will not unfold in a few years, but likely over two or three decades. It is the most reliable strategic asset, for without autonomous, uninterruptible nuclear energy, the entire technocratic machine simply cannot exist.
________________________________________
🏁 Summary and Conclusions
________________________________________
There is the panoramic view. As you read this in early 2026, you are not looking at a chaotic market, but a shift in structural priorities. We have seen that 50 years of financial "excess" were not mistakes or system "bugs"—they were the "features" of a successful engineering project to fund the Technocracy:
✅ Past (Bubbles #1, #2, #3) - DONE: Data collection, connectivity, and the creation of algorithms and AI are largely complete.
▶️ Present (Bubble #4) - START: Capital is migrating into DLT/Tokenization to bring order to global assets.
🎯 Future (Bubble #5) - STRATEGY: Strategic capital is already taking positions in Uranium and SMRs, recognizing the final, most fundamental asset of the New Technocratic Order .
The construction of this New Babylon through the Five Bubbles is not a future dream; it is a global conceptual project using the crowd's speculative mania as a capital pump . Your task is to understand which stage of construction the money is flowing into—and to avoid being the one who buys "idols" at their peak once their mission is complete.
A project of this scale does not rely on a single generation of investors or a single nation-state. The emerging Technocracy does not care who sits in the Oval Office. This is a multi-generational, long-term blueprint orchestrated by supra-national conceptual power . These forces move the needle behind the scenes, far from the "theatre of democracy" and the temporary political actors shown on the mainstream news. Those who truly hold the strings of global management will never be televised.
1️⃣ Strategy for 2026–2028: DLT and Debt Absorption (Bubble #4)
The next "idol" the market will deify is Digital Money (Stablecoins/CBDCs), Tokenization, and DLT . Capital will migrate en masse into technologies promising absolute transparency and automated accounting. This is an inevitable mania designed to digitize assets and—cynically—provide the technical framework for "writing off" the legacy debts of the old hegemon. The plan: accumulate the crypto-assets discussed in this analysis monthly throughout 2026 (ideally starting in the summer) with a focus on 2028. The goal is not to "catch the bottom," but to deliberately build a portfolio while the panic-stricken crowd is selling.
2️⃣ Strategy for 2026–2050: The Foundation of Autonomy (Bubble #5)
The most coveted asset of the Technocracy is invulnerability. Invulnerability equals autonomous nuclear energy. While speculators are driven into the RWA/DLT bubble in 2027–2028—tokenizing their last remaining possessions—strategic capital will have already occupied positions in assets that power the "AI Brain" for decades. We are talking about Small Modular Reactors (SMRs) and the raw materials that fuel them.
To survive the 2026 crisis, the subsequent 2029–2033 depression, and ultimately enter the Brave New World of Cyberpunk , your primary task is not to be part of the distracted masses . Do not buy the "idols" at their peak when their mission is already accomplished. Instead, use the 2026 collapse of the "AI-idiocracy" as a window for strategic positioning .
The core purpose of the ideas published on this channel is to cultivate a broad, objective, panoramic vision for my subscribers. This conceptual clarity is achieved through constant self-work: maintaining a sober mind, developing critical thinking, and utilizing impartial logic. Do not follow the herd as it gallops toward the abyss in yet another fit of FOMO and euphoria.
Our goal is for as many rational and enlightened individuals as possible to pass through the "bottleneck" of 2020–2030. We want you to emerge from the hybrid chaos of the current era, the burst of Bubble #4, and the resulting Great Depression 2.0, as survivors ready for the future.
Happy New Year!
Support this idea with a 🚀 rocket and a constructive 💭 comment to keep it from drowning in the ocean of useless information noise.
🙏 "Thank you for your attention to this matter"©
☘️ Good luck, stay safe!
📟 Over and out.
RWA

The Anatomy of AI Illusions: A Forecast for 2026–2028❗️Disclaimer: This idea is part of a larger series regarding capital market bubbles. To fully grasp the context and depth of this analysis, please refer to the core article: 🎈The Five Bubbles of Technocracy .
A quick heads-up: You are about to encounter a wide range of information—from specialized banking mechanisms to crypto and mass psychology. I hope not to overwhelm you with theory, but to see the coherent structure behind the market chaos, we must briefly dissect each of these layers. Without this groundwork, the panoramic picture of the coming shifts simply won't click into place.
________________________________________
🩻 Anatomy of AI Illusions: What Really Drives the Market?
To understand the outlook for 2026–2028, we first need to dismantle the current "bull" trend and see how it was built. This isn't random growth—it’s the work of a finely tuned machine where every gear has a role. In this article, we will step-by-step deconstruct the entire process: from hidden banking transactions to fundamental signals of overheating. Here are the main stops on our route:
🏦 The Multiplication Mechanism: We’ll analyze how Reverse Repo (RRP) operations created a foundation for bank liquidity between 2023-2025 where it seemingly shouldn't have existed.
♻️ Corporate Buybacks: We’ll look at how companies support their stock prices via "artificial respiration" by repurchasing their own shares.
🛡️ Isolated Macro-Zones: We’ll evaluate the global transition toward a new model of closed economic blocs.
⛩️ The External Detonator: We’ll discover why the Japanese Carry Trade and the Eurodollar system are the primary factors to watch.
📊 The Four Horsemen of the Apocalypse: We’ll study three key indicators (Buffett, Shiller, and the Confidence Index) that reveal the true "boiling point" of the market at the end of 2025.
Finally, we will move to the 📈 Main Chart Analysis and peek into the 📅 "Narrow Bottleneck" of 2026 .
⚡ The Engine Under the Hood: QE, Buybacks, and Liquidity
For those still searching for the truth in quarterly reports and believing the mainstream news cycle, this chart will be a cold shower. In Western capital markets since the 2008 financial crisis, there has been only one true growth driver: Liquidity. Everything else is just stage dressing.
Liquidity is the primary fuel for capital markets, but all fuel has a limit. For the liquidity that drove the markets over the last two years, that limit is here today. To understand the trap we will find ourselves in by 2026, we must expose the mechanics of the "success story" of recent years. Why did the stock market hit record highs while the liquidity index was stagnating? The answer: the media-driven AI revolution narrative and the Reverse Repo (RRP) facility—a "hidden pump" that worked at full capacity but is now starting to "suck air."
Chart Legend:
🔴 Red: Reverse REPO — The "Stash"
🔵 Blue: S&P 500 Index
⚪️ White: Market Cap of "Selected" Crypto
🟡 Yellow: GLI — Global Liquidity Index*
*In this version of the GLI indicator, the influence of Chinese liquidity ( PBoC and CNM2) is excluded.
________________________________________
🏦 The Multiplication Mechanism: RRP as the Foundation for Banking Maneuvers
It is crucial to understand that the draining of liquidity from the RRP between 2022-2024 served not only as a direct market injection but also as a critical stabilizer for the entire banking system . In modern financial architecture, banks are not just intermediaries; they are “factories” for creating money out of thin air through lending, complex derivatives, and other legalized maneuvers.
As the $2.5 trillion "stash" accumulated in 2021-2022 flowed from the Repo facility into bank reserves, it provided the necessary "margin of safety," allowing financial institutions to inflate leverage and maintain the illusion of stability. However, now that this stabilizer is exhausted, banks are left without insurance in the face of a massive debt bubble. Without "cheap money" or RRP/QE injections, the money-creation mechanism breaks down, turning the banking sector from a growth driver into the epicenter of a future systemic shock.
♻️ Corporate Cannibalism: Buybacks as Artificial Respiration
Beyond the banking multiplier, massive share buybacks have been a vital fuel for inflating bubbles. In 2023–2025, US corporations—having amassed huge cash reserves in previous "fat" years (QE 2020)—directed record sums toward repurchasing their own shares.
This creates a closed loop: companies spend liquidity not on expanding production or real innovation, but on artificially reducing the number of shares in circulation. This "paints" a beautiful Earnings Per Share (EPS) figure even when revenue is stagnant, creating forced demand and preventing indices from falling. Buybacks act as an internal stabilizer, but this resource is not infinite. Like the RRP stash, the cash reserves for buybacks are depleting, leaving companies defenseless against the coming correction.
🛡️ The Birth of Isolated Economic Macro-Zones
In this version of the GLI indicator, I have deliberately excluded the influence of Chinese liquidity (PBoC and M2 money supply). In the era of hybrid World War III and aggressive trade restrictions, the old "communicating vessels" model has stopped working. If previously a rise in the Chinese credit impulse automatically lifted all boats, including the S&P 500, today we are witnessing a deep financial fragmentation. Chinese liquidity is now "sterile" for Western markets: it is trapped inside the PRC to combat an internal deflationary crisis and no longer feeds US tech giants as it once did.
This "sanitary cordon" between US and Chinese capital is leading to the creation of Isolated Economic Zones . The US market is turning into an autonomous addict, hooked exclusively on the internal needles of the Fed and the Treasury. This means no help is coming from the outside: when the internal "stash" of the RRP runs dry, the US system finds itself in an absolute vacuum. This factor makes the upcoming "narrow bottleneck" of 2026 inevitable—the US authorities no longer have an external donor capable of financing their next round of consumption.
⛩️ The External Detonator: The Japanese Carry Trade and the Eurodollar System
While all eyes are on the Fed and the White House, another, far more powerful detonator has activated on the horizon: the Japanese Carry Trade. For decades, Japan has been the global donor of cheap liquidity: investors borrowed Yen at near-zero rates and flooded that money into US Treasuries and Tech, collecting a lazy 3-5% annual yield. Today, this volume has reached 25-year highs, and the rules of the game are changing:
Capital Returning Home: As Japanese 30-year bond yields TVC:JP30Y hit critical levels, a massive amount of capital is beginning its evacuation. Investors no longer see the point in taking USD risks when they can get guaranteed yields in Yen.
The Blow to the Eurodollar: The collapse of the carry trade means a forced, massive sell-off of US assets. This undermines the foundation of the entire global Eurodollar system. When Japanese capital exits dollar instruments to cover losses or lock in profits, a liquidity deficit arises that cannot be covered by internal injections alone.
Chain Reaction: This is the external trigger that could turn the "bottleneck" of 2026 into an uncontrollable catastrophe. If high interest rates, a turned-off "printing press" (QE), and a zero RRP balance represent a lack of free fuel, and GLI cyclicality is the "market's breath" (contracting the air in the system), then the break of the carry trade is a Category 5 hurricane hitting head-on!
________________________________________
📊 The Four Horsemen of the Apocalypse: Overheating Indicators
To grasp the scale of the current "AI-idiocracy," looking at Nvidia or Microsoft charts isn't enough. We need to look under the hood, where four independent sensors are screaming about a critical overheat:
The Buffett Indicator: The market has swallowed the economy (250%). This ratio—total market cap to GDP—is Warren Buffett’s favorite "thermometer." Today, it shows a high-grade fever.
The Shiller PE Ratio (CAPE): This is the "truth serum" for the market, revealing long-term overvaluation.
The Consumer Confidence Index (USCCI): The voice of the "street." While Wall Street celebrates new ATHs, the American consumer feels like it’s 2008-2009.
NDQ/Gold Ratio: This ratio shows the real value of tech, stripped of dollar inflation.
1️⃣ The Buffett Indicator (Market Cap / GDP)
Warren Buffett believes that when the stock market becomes significantly heavier than the real economy, it’s a bubble. By late 2025, this indicator surged past 220%. This means the US stock market is valued at more than double what the entire US economy can produce in a year. Even during the 2000 Dot-com peak, this figure was much lower (~142%). Investors are buying miracles, ignoring physical economic limits.
2️⃣ The Shiller PE Ratio (CAPE Ratio)
Professor Robert Shiller suggests looking at average inflation-adjusted earnings over the last 10 years to filter out temporary hype. In 2025, the Shiller PE MULTPL:SHILLER_PE_RATIO_MONTH stands at 40.4. For context, the 100-year historical average is around 17. Stocks are currently twice as expensive as their fundamental value—levels seen only in 1929 and 2000.
3️⃣ Consumer Confidence Index (USCCI)
Since consumer spending accounts for nearly 70% of the US economy, this index is the best predictor of future profits. In 2025, we see a terrifying divergence: the stock market is hitting records (elite euphoria) while the USCCI has collapsed to 2008 crisis levels (mass depression). History teaches that Wall Street cannot feast for long while Main Street starves. When consumers stop spending, those sky-high corporate multiples will come crashing down.
4️⃣ NDQ/Gold Ratio — The Financial Lie Detector
When we value the tech sector in "hard" Gold rather than depreciating Fed "paper," the truth emerges.
The 1980s – 2000: The Era of Genuine Growth. From the late '80s, the Nasdaq-100 index and the NDQ/Gold ratio moved hand in hand. This was a period of true appreciation in technology's value relative to gold: rising from 0.30–0.50 to a peak of 17 ounces per index unit in the year 2000 . That was the moment when you had to pay 17 ounces of gold for a single "basket" of Nasdaq-100 stocks.
2000 – 2011: The Great "Scissors." After the Dot-com crash, the correlation broke. While the Nasdaq-100 was painfully struggling to recover, gold was rising much faster. By 2011, we reached a ratio of 1.15 — essentially, in 2011, one unit of the Nasdaq index and one ounce of gold were worth roughly the same.
2011 – 2021: Digital Revenge. A decade of cheap money allowed the Nasdaq to outpace gold once again, establishing a local peak at the level of 9.00 in 2021. But take note: this was nearly two times lower than the level seen in the year 2000.
Current Ratio Value (January 2026): 5.88. Today, the Nasdaq index in US dollars sits at the peak of the AI bubble, having gained +400% since its 2000 highs. But when we view it through the "Golden Filter," a striking picture emerges: the technology sector today is worth three times less than it was a quarter-century ago at the height of the Dot-com bubble, when measured in gold.
*️⃣ The Growth that Isn't There — "Negative Growth"
The fourth horseman confirms: the phenomenal post-2000 rise of the Nasdaq is not real value growth, but excess liquidity absorption . In gold terms, the Nasdaq hasn't even broken its 2021 local highs, let alone the 2000 peak.
Strategic Conclusion: 2026 will be the year of great disappointment for those who trusted screen digits while ignoring the streets. When the "financial scissors" close, the fall will be as rapid as the rise was artificial.
________________________________________
📊 The Main Chart: Reading from Left to Right
1️⃣ 2021–2022: Honest Correlation
When Global Liquidity (GLI) stopped growing and the Reverse Repo (RRP) balance was being covertly pumped, markets fell. S&P 500 dropped -27%, and the cap of ETH+SOL+HBAR collapsed -77%. No liquidity = No growth.
2️⃣ 2023–2024: The Disconnect (RRP Steroids for AI)
While GLI* stayed flat for two years, markets went up. How? The Treasury spent the $2.5 trillion RRP "stash" $FRED:RRPONTSYD. This liquidity injection allowed OANDA:SPX500USD to surge +75% during the AI craze. Crypto recovery was selective; ETH+SOL+HBAR regained 2021 levels, but it was just an imitation of life fueled by Repo injections.
3️⃣ 2025: The Empty Trough and "Negative Alt-Season"
The $2.5T RRP stash is gone. In early 2025, reality hit. January 2025 saw a panic sell-off (S&P 500 -21%, selected crypto -57% in 40 days). Trump’s administration softened its stance to appease the market, and a brief recovery followed on buybacks. However, by late summer 2025, GLI* growth stalled, and ETH+SOL+HBAR immediately dropped -40%. Fact: Top-tier crypto has not grown since 2021—it has been sideways for four years. The rest of the "alts" are simply drilling into the bottom. This is the "negative growth" alt-season.
________________________________________
📊 Fascinating Statistics: Top 7 Market Cap
1.NVDA: $4.6T
2. AAPL: $4.1T
3. GOOG: $3.8T
4. MSFT: $3.6T
5. AMZN: $2.5T
6. META: $1.7T
7. AVGO: $1.6T
Top 7 Combined = $22 Trillion
Global Stock Market Caps for Comparison:
1. USA: >$50T
2. China: ~$11T
3. Japan: ~$5.8T
4. India: ~$5T
5. UK: ~$3.2 trillion
Think about this absurdity: The top 7 US tech companies are now worth more than the markets of China, Japan, and India combined. It’s one thing to blow an AI bubble when the economy is healthy and rates are low. It’s quite another to drag the market to all-time highs in 2025 with the highest rates in 25 years, shrinking liquidity, and manipulated BLS statistics. The timeline for the "Technocracy" is tight, but even for a speculator, this level of delusion is unprecedented.
________________________________________
📅 Outlook for 2026–2028: The "Narrow Bottleneck" and the New Architecture
1️⃣ 2026: Political Engineering and the Reset of Speculative Capital The political cycle dictates the rules. A probable Democratic comeback in late 2026 requires a repeat of the Republicans' 2022 "trick." For the system to enter a new cycle, it needs a deep purge.
▫️ The Mechanics of the Crash: Since the RRP balance is empty, there is nothing left to replace the falling Global Liquidity (GLI). From the start of the year, the US market enters a steep nose-dive.
▫️ Downside Targets: By year-end, the S&P 500 will collapse by -40%. The combined market cap of CRYPTOCAP:ETH + CRYPTOCAP:HBAR + CRYPTOCAP:SOL will plummet another -70% from current levels.
2️⃣ The New Market "Savior" and the Risk-OFF Trap
At the height of the 2026 crash, a new Fed Chair—the "Savior"—steps onto the stage. Their actions are predictable: aggressive rate cuts and the launch of the printing press (QE). However, initially, this won't stop the panic. The market, shocked by the sudden shift from Risk-ON to Risk-OFF, will continue to crumble. Capital will flee in terror—first into the USD, and then into the "safe haven" of long-term US Treasuries. This is a highly desired outcome for financial authorities, as only during a panic can the US national debt be refinanced relatively cheaply.
Early 2025, when Trump entered the Oval Office and initiated global tariffs, was the first attempt to flip the switch to Risk-OFF (where the 30-year yield TVC:US30Y dropped from 5% to 4.33%), but the equity crash was abruptly halted. Now, in early 2026, we will likely see a "flashback," where US indices begin to sharply bleed out against the backdrop of a potential government shutdown.
Knockdown Totals (from 2025 peaks to late 2026):
Crypto: -70-90%
Nasdaq-100: -55%
S&P 500: -40%
Russell 2000: -30%
Gold: -30% | Silver: -40%
DXY: +10-20%
TLT: +20-30% | TMF: +70-100%
The principle is simple: wherever the maddened crowd dumped the most speculative leveraged capital, the drawdowns will be the deepest.
3️⃣ 2026–2028: Matrix "Reloaded" and Bubble №4
On the ruins of the crash and the heavy sobering from AI hallucinations, the construction of a "new digital pillar" will begin. In 2026, the Technocracy will present a new narrative: "DLT/RWA (Tokenization of Real World Assets) will save us all." Under this banner, Wall Street will inflate the next bubble. At first, the battered masses won't believe in the growth, but as fresh liquidity is pumped in, the eternal mechanism of greed and FOMO will kick in. By the peak in ~2028, naive retail will once again go "all-in" with maximum leverage.
________________________________________
🧩 Conclusion: Seeing the Structure Behind the Chaos
The period of "stunning success" provided by hidden reserves and financial acrobatics is over. The system stayed afloat through corporate "cannibalism" (buybacks), banking multiplier sleight-of-hand, and the burning of the RRP stash.
Today, all the fuses have blown. China is building its own isolated economic zone, US internal reserves are depleted, and the Japanese carry trade has turned into a high-explosive mine under the Eurodollar system. 2026 will be the moment of truth. This is not just a correction; it is a systemic "narrow bottleneck" required to reset the optimism of "dumb money" and prepare the ground for a new capital management architecture. For the Technocracy, a crisis is not a failure—it is a tool.
Speculative bubbles are the perfect psychological "carrot," turning the construction of total control infrastructure into a gambling game for the masses. No sane person would voluntarily finance the tools of their own surveillance. But when these technologies are wrapped as "stocks of the future" or "revolutionary AI," the crowd lines up to throw their savings into the capital pump. Retail greed becomes the main investor in building the walls of their own electronic stall.
From a systemic perspective, bubbles are a harsh economic necessity to sterilize excess liquidity . If trillions of "helicopter dollars" hit the real economy directly, they would destroy the system via hyperinflation. Bubbles act as a giant "steam whistle," pulling fiat mass away and locking it in overvalued assets. When the fever breaks and prices crash -50–80%, the "extra money" is burned off, clearing the system's balance sheet. The cynicism lies in the fact that the physical infrastructure built with those funds—factories, data centers, fiber optics, and algorithms—does not disappear . it remains in the hands of the Technocracy, fully paid for by the "young investors" who were just fleeced.
📉 SP500 Forecast for 2026
In short: after an expected drop of -40-50% (from 6900 down to ~4000) by late 2026 as the AI bubble bursts, the US authorities will likely begin inflating Bubble №4 (DLT/Tokenization). This cycle may take another two years, reaching its peak by early 2029.
Strategic Plan:
Recognize the Vacuum: Understand there is no "donor" left. Neither China, Japan, nor the US Treasury will provide another shoulder. Growth without fresh liquidity is a trap.
Endurance in the Epicenter: When the Risk-OFF regime burns everything in 2026, do not seek safety where the crowd is huddled.
The New Narrative: The real game starts in 2027–2028. While the masses mourn their losses, strategic capital will inflate Bubble №4 and then Bubble №5. The AI crash is just site clearance for the new technological order. In 2026-2028, institutional digital nodes will be created for the future system of global wealth tokenization.
The map of the future is drawn. While retail looks for reasons in news headlines, those who understand liquidity move into position.
Be the one who sees the structure, not the naive extra in someone else's play.
________________________________________
❗️Disclaimer: This idea is part of a larger series regarding capital market bubbles. To fully grasp the context and depth of this analysis, please refer to the core article: 🎈The Five Bubbles of Technocracy

TradeCityPro | LINK Compressing in Triangle, Breakout Ahead👋 Welcome to TradeCity Pro!
In this analysis, I want to review LINK, one of the RWA projects, which with a market cap of $8.78 billion is ranked 12th on CoinMarketCap.
⏳ 4-hour timeframe
On the 4-hour timeframe, LINK has a support zone near the $12 area, and together with a descending trendline, it has formed a descending triangle.
🎯 The trigger for breaking this triangle to the downside is the break of the $12 support zone, and 12.16 will be the first short trigger.
⚡️ However, if the triangle breaks to the upside, we can open a long position using the 12.80 trigger. In this case, the price can move toward 14.65.
📊 The volume on this coin has been decreasing for about a week and is gradually getting lower. If the breakout of either trigger is accompanied by increasing volume, the new trend can continue.
💥 Overall, since the price is currently between 12.16 and 14.65, the market does not have strong momentum, and for this reason, we can open both long and short positions.
📝 Final Thoughts
Stay calm, trade wisely, and let's capture the market's best opportunities!
This analysis reflects our opinions and is not financial advice.
Share your thoughts in the comments, and don’t forget to share this analysis with your friends! ❤️

TradeCityPro | FET Testing Key Range, Bears in Control for Now👋 Welcome to TradeCity Pro!
In this analysis, I want to review FET, one of the AI projects, which with a market cap of $558 million is ranked 80th on CoinMarketCap.
⏳ 4-hour timeframe
On the 4-hour timeframe, this coin is ranging between the zones 0.2321 and 0.2652.
💥 The overall trend for FET is currently bearish, but the price is now ranging between these two zones and forming a new structure.
⚡️ After the last time the price reached 0.2652, it got rejected, and volume started decreasing, and it is still decreasing.
✔️ The bottom of the range can also be considered as a support zone. Breaking this zone would be a very good trigger for a short position, and the price could move towards 0.2021 after breaking this level.
🎲 The middle line of the range is at 0.2472, and breaking this level will give us a early long trigger.
✨ The next level we can open the main long position after breaking is 0.2652.
📝 Final Thoughts
Stay calm, trade wisely, and let's capture the market's best opportunities!
This analysis reflects our opinions and is not financial advice.
Share your thoughts in the comments, and don’t forget to share this analysis with your friends! ❤️

TradeCityPro | HBAR at Critical Support, Bears in Control👋 Welcome to TradeCityPro!
In this analysis, I want to review HBAR, one of the RWA-focused projects, currently ranked 21st on CoinMarketCap with a market cap of $5.71 billion.
🗓 Daily Timeframe
On the daily timeframe, this coin is sitting on a very important support zone.
✔️ There is also a curved descending trendline visible on HBAR, which started forming from the 0.2915 top.
🎲 Every time the price has touched this trendline, bearish momentum has increased.
🎯 Right now, the price is inside this support area, and considering the strong selling pressure in the market, the probability of this zone breaking is high.
💥 The RSI oscillator has also taken a bearish direction after the rejection from 0.2915, spending most of the time below the 50 level, which indicates bearish momentum dominating the market.
💧 If RSI enters the oversold zone, this bearish momentum will intensify even further, increasing the likelihood of a breakdown of support.A break of 0.13055 would be a very strong short trigger.
📊 For long positions, after the descending trendline breaks, we can enter using the 0.15111 trigger.
⚡️ Signs like increasing volume and RSI stabilizing above 50 will act as strong confirmations for a bullish reversal.
📝 Final Thoughts
Stay calm, trade wisely, and let's capture the market's best opportunities!
This analysis reflects our opinions and is not financial advice.
Share your thoughts in the comments, and don’t forget to share this analysis with your friends! ❤️

TradeCityPro | QNT Faces Key Resistance, Eyes Potential Reversal👋 Welcome to TradeCity Pro!
Let’s dive into the analysis of the QNT coin, one of the RWA (Real-World Asset) coins with a $25.1 million market cap, currently ranked 65th on CoinMarketCap.
⏳ 4-Hour Timeframe
On the 4-hour timeframe, this coin is currently in a large range box, and it is now near the upper boundary of this box.
⭐ The upper boundary of this box represents a strong resistance zone, and as you can see, the last time the price was rejected from this zone, a bearish move started.
📊 Currently, the price has moved near this zone, and before reaching it, the price started to correct.
💡 As long as the price remains above 81.18, any downward movement can be considered a correction. If the price touches the zone again and breaks it, we can open a long position.
💥 If the price stabilizes below the 81.18 level, and if selling volume increases, we can open a short position. In that case, the price could move toward the 70.62 support level.
📉 The main confirmation for the bearish trend and the start of a new downward wave for this coin will come after the price stabilizes below 70.62.
📝 Final Thoughts
Stay calm, trade wisely, and let's capture the market's best opportunities!
This analysis reflects our opinions and is not financial advice.
Share your thoughts in the comments, and don’t forget to share this analysis with your friends! ❤️

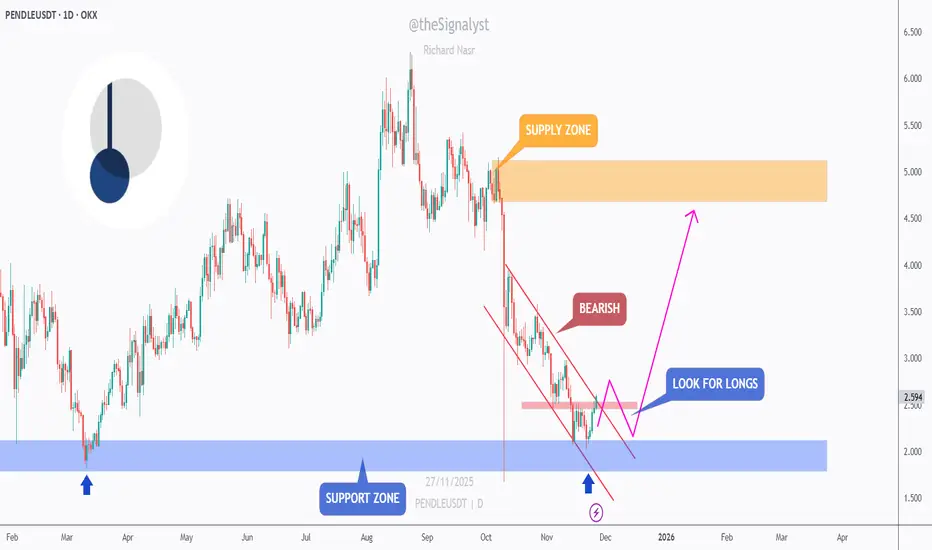
PENDLE - From Support to Setup… Bulls on Standby!📉PENDLE has been bearish for weeks, sliding inside a clean falling channel. But price is now reacting from a major support zone, the same area that initiated previous strong rallies earlier this year.
⚔️As long as this blue support zone holds, we will be looking for long setups, expecting a corrective move toward the upper bound of the falling channel. The first confirmation from the bulls will come after a break above the pink structure zone - the last lower high inside the correction.
Once that level is reclaimed, momentum could shift upward, opening the way for a larger move toward the supply zone around 5.00.
For now, PENDLE is positioned at a potential turning point… will the support zone spark the next bullish correction? 🤔
⚠️ Disclaimer: This is not financial advice. Always do your own research and manage risk properly.
📚 Stick to your trading plan regarding entries, risk, and management.
Good luck! 🍀
All Strategies Are Good; If Managed Properly!
~Richard Nasr
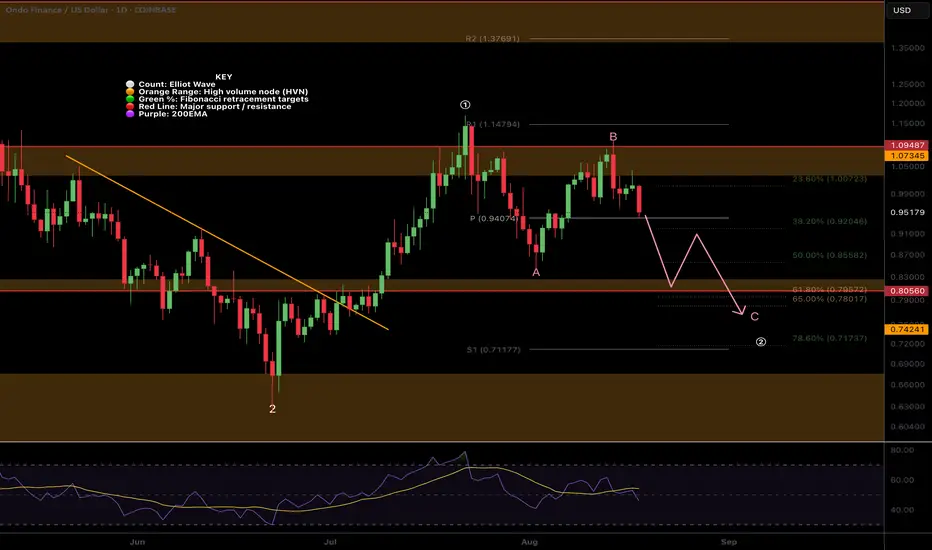
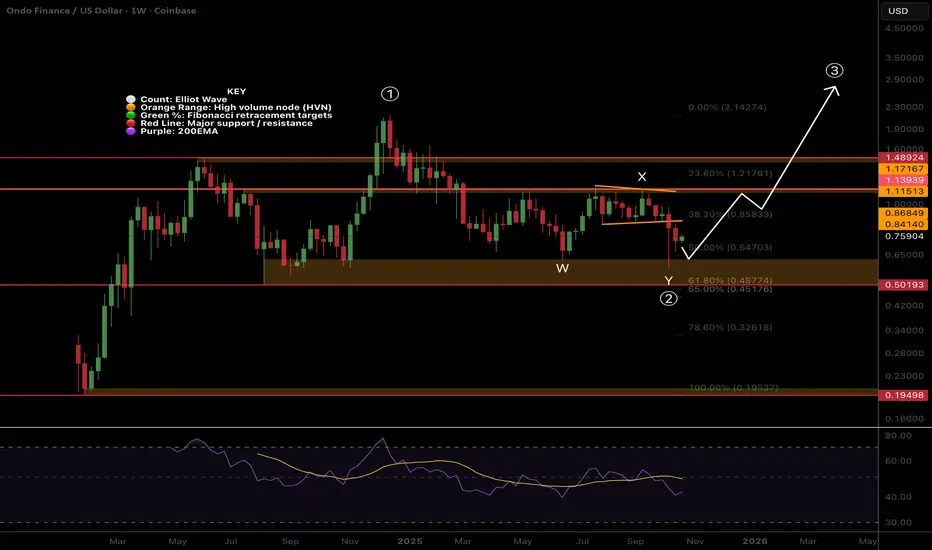
ONDO,1 more push lowerLSE:ONDO Price is sitting just above High Volume Node support, testing the descending trend-line as resistance. As long as we are below the trend-line, the probability is to the downside.
Wave 2 appears complete after 5 waves down from the wave X flat correction. Price was front-run at the golden pocket Fibonacci retracement, but only a bounce so far. We are below the daily pivot and 200EMA, which is bearish.
📈 Daily RSI tapped oversold twice with slight bullish divergence.
👉 Continued downside has a target of the bottom of the High Volume Node at $0.5
Safe trading

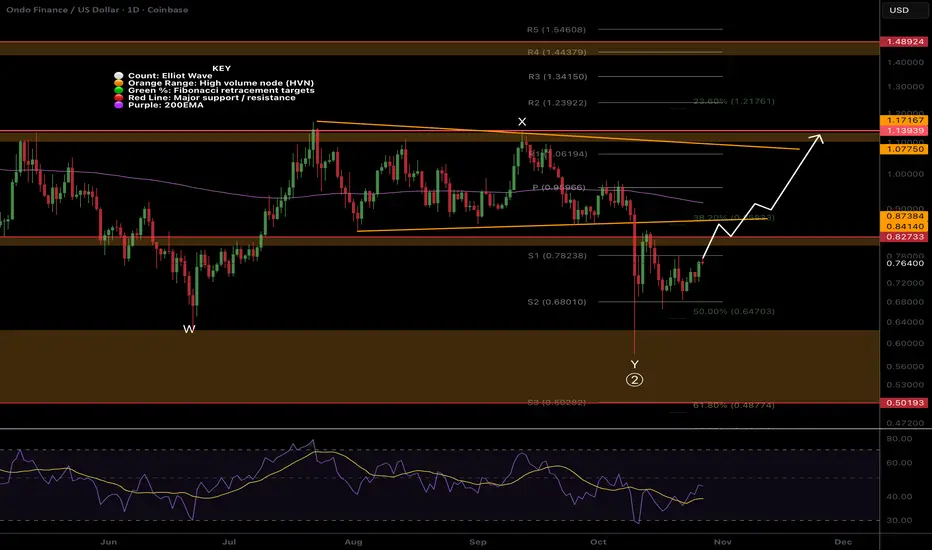
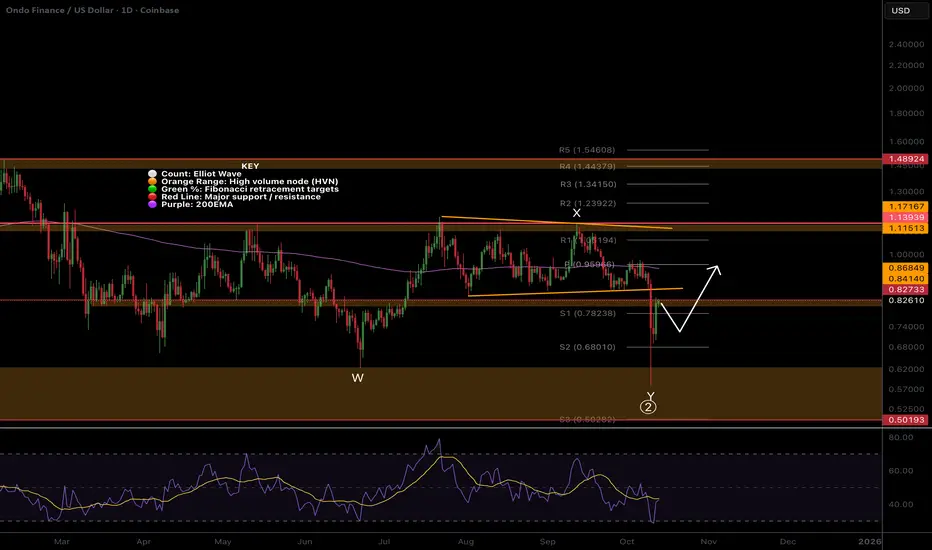
ONDO beaten down, resistance aheadLSE:ONDO has work to do but I am a forward looking narrative trader and believe we have a major RWA (Real World Asset tokenisation) narrative ahead to pump these coins.
Ahead lies High Volume Node resistance, previous channel lower boundary, descending daily 200EMA and the daily pivot to overcome... not easy but this is crypto and can be all taken out in 5 seconds.
Price terminated with a front run of the golden pocket showing strength over other alts.
Daily RSI hit oversold, no divergence
Safe trading
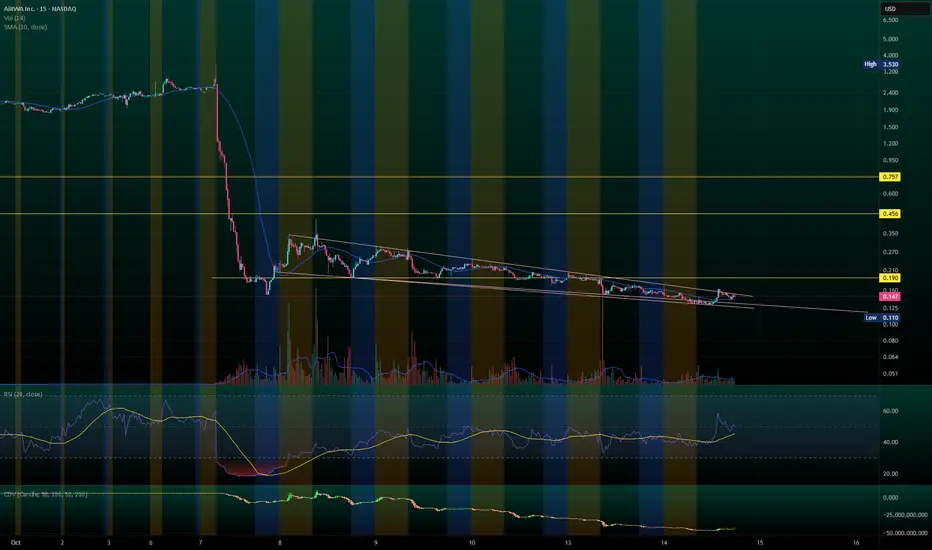
YYAI oversoldHard to say what has happened in the past week, but see below. In any case, I believe PA is about to reverse.
NASDAQ:YYAI Facts:
- YYAI has authorization to issue $200 m ATM shares
- YYAI has agreed to fund their new venture for $250 mil along with a second $250 mil from JuCoin
- YYAI has received $30 mil in SOL (see my other posts)
- If YYAI issued shares totaling more than approximately 20% of outstanding shares, they would need to file an 8-k within 4 business days of issuance, or else face legal problems
- There has been no 8-k and we are on day 5 post-dumparoo
- YYAI daily volume has gone 1000x from typical days (why?)
- YYAI short volume has been 5-10x the current outstanding shares
- YYAI is down 94% from two weeks ago
The question remains, was there dilution, if so how much? If no 8-k this week, can assume there was none or little (or worse, company is fraudulent).
If no 8-k the dump is from a massive coordinated short attack.
If dump was a massive coordinated short attack, price will likely rebound, unless attack continues.
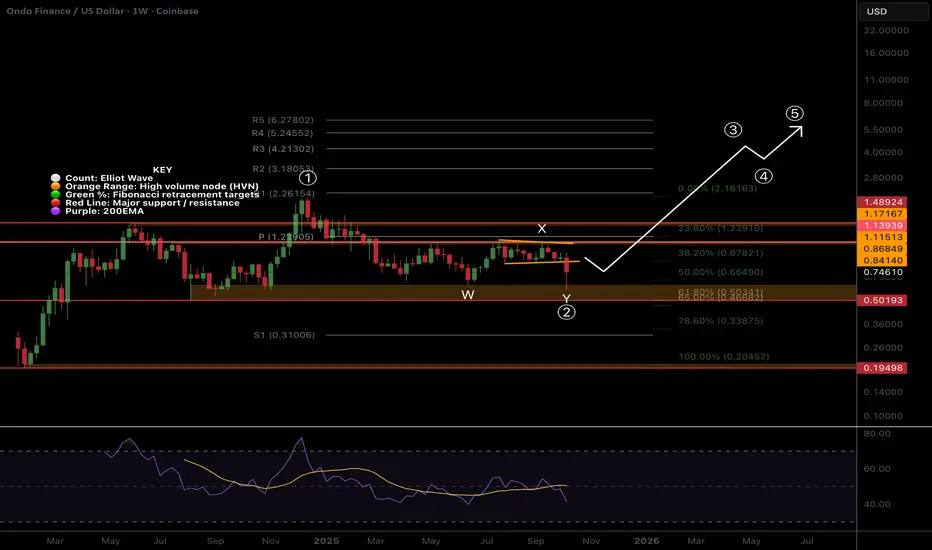
$ONDO wave (2) Bottomed?LSE:ONDO appears to have completed wave 2 with WXY complex correction ending at the major High Volume Node support just above the golden pocket.
Weekly RSi has printed bullish divergence but is not yet confirmed. A dip into the wick and High Volume Node is to be expected before high but may not get there.
Wave (3) has an initial target of the R2 weekly pivot at $3.18, a strong move from here. $1.22 weekly pivot and High Volume Node will put up a fight.
Safe trading
TradeCityPro | AVAX: Downtrend Persists Near Key Support👋 Welcome to TradeCity Pro!
In this analysis, I want to review the AVAX coin. One of the older crypto projects active in RWA, it has a market cap of $8.48 billion, ranking 18th on CoinMarketCap.
⏳ 1-Hour Timeframe
On the 1-hour chart, we see a downtrend in this coin, which has continued after last week’s decline.
✨ After the 23.06 level was faked, bearish momentum entered the market, and a new downwave began. After breaking the 20.68 support, the price dropped to 19.10 and is now in a correction and pullback phase.
📊 Volume has significantly decreased during this correction, indicating the strength of the downtrend. Although today is Saturday and the overall market volume is low, if the price moves back toward 19.10 with increasing volume, we can confirm the volume for the bearish trend.
💥 The RSI oscillator is correcting alongside the price and, after exiting Oversold, is currently around 50.
⭐ If the 50 level breaks, it signals that bearish momentum in the market has decreased, and AVAX could enter a range-bound or corrective structure.
✔️ On the other hand, if selling volume returns and RSI moves toward 30, breaking this level would bring bearish momentum back into the market. In this case, breaking the 19.10 trigger allows us to open a short position.
🔍 For now, there are better coins for long positions that have recovered more. On AVAX, as long as it stays below 20.68, long positions don’t make much sense.
📝 Final Thoughts
Stay calm, trade wisely, and let's capture the market's best opportunities!
This analysis reflects our opinions and is not financial advice.
Share your thoughts in the comments, and don’t forget to share this analysis with your friends! ❤️

TradeCityPro | LINK: Eyeing $18 for Potential Drop👋 Welcome to TradeCity Pro!
In this analysis, I’m going to review the LINK coin — one of the RWA projects, currently ranked 12th on CoinMarketCap with a market capitalization of $12.57 billion.
⏳ 1-Hour Timeframe
In the 1-hour timeframe, after Friday’s drop, the price fell to $16.78.
💫 Following this decline, the price made an upward correction up to the 0.618 Fibonacci level. After one reaction to this zone, bearish momentum returned to the market, and volume has been increasing.
✅ Currently, the price is moving toward the $18.31 level. Breaking this zone could trigger the start of the next downward leg.
⭐ The main support level remains at $16.78, and as long as the price stays above this zone, I won’t be opening any short positions.
📊 For long positions, the current trigger is $20.02.For earlier triggers, we need to wait for the market to form more structure and generate new entry signals.
📝 Final Thoughts
Stay calm, trade wisely, and let's capture the market's best opportunities!
This analysis reflects our opinions and is not financial advice.
Share your thoughts in the comments, and don’t forget to share this analysis with your friends! ❤️

ONDO, Time for wave 3 up into ATH?What a mess Friday turned out to be with a recording breaking liquidation event with the numbers still growing - bigger than FTX!
SUNK COST FALLACY: THE DAMAGE IS DONE, DO NOT PANIC IN AND OUT OF POSITIONS.
So many alt-coins proved there is nothing but thin air holding them up - no real demand whatsoever! I'll take a look at some charts today. Now these wicks can be classed as 'anomalies' in technical analysis but in this case i think we've revealed some of the strong tokens now with real backing.
It is expected that with such large wicks we at least test the centre of the wick on one more terrifying shake-out that isnt actually as bad as the one we just has but feels it because traders and investors are been kicked while their down in a state of panic.
-------------
LSE:ONDO appears to have completed a WXY wave 2 complex correction finding strong support in the High Volume Node.
Price is in a bearish market structure at double resistance- High Volume Node, channel lower boundary. Traders should be cautious.
Price is likely to have one more pullback to scare weak hands out before starting wave (3) of 3 to new all time highs. We could see $0.68 challenged at the S2 pivot.
If we break back into the channel the daily 200EMA will be the next resistance.
Safe trading
ONDO Extreme opportunity zoneI have been sharing my wave Y of (2) target for a while at the Fibonacci golden pocket and major High Volume Node support, $0.5. Demand soaked up the downward pressure here leaving a long lower wick. The next downside target is the ‘alt-coin’ golden pocket, 0.786, and S1 pivot at $0.31 and would be an excellent buying opportunity!
Weekly RSI has plenty of room to fall with no bullish divergence forming yet.
Wave (3) target is the R3 weekly pivot at $4.2 a decent move from here!
Safe trading
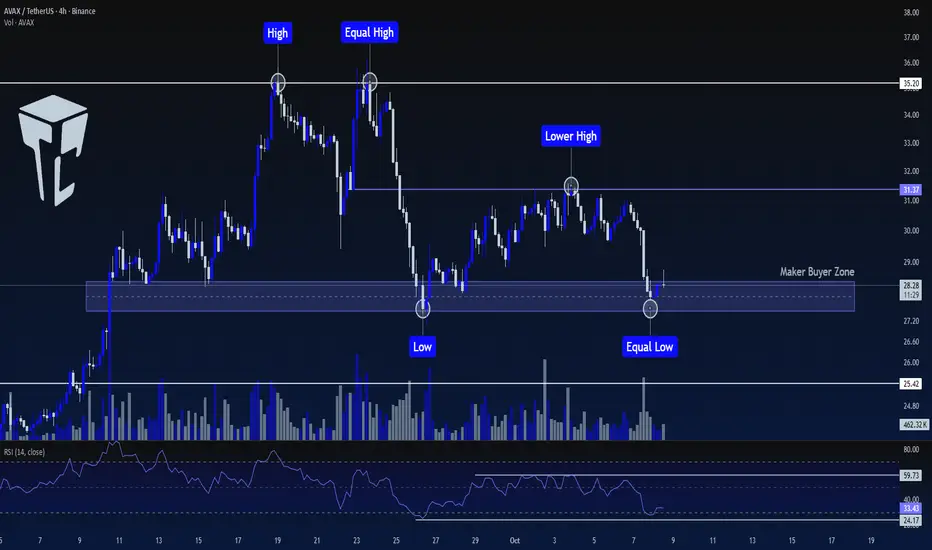
TradeCityPro | AVAX: Testing Key Support and Resistance Zones👋 Welcome to TradeCity Pro!
In this analysis, I will review AVAX, one of the Layer 1 and RWA coins with a market cap of $11.98 billion, ranked 16th on CoinMarketCap.
⏳ 4-Hour Timeframe
On the 4-hour timeframe, AVAX has a strong Maker Buyer zone that has been tested multiple times and provided support.
⭐ On the other hand, after creating two equal peaks at 35.20, the next peak was lower, at 31.37.
✅ This indicates that the sellers' strength in the market is greater than the buyers' strength, but buyers also have a significant support level, which has been effective so far in preventing further price decline.
🧩 Since Bitcoin's trend is entirely bullish, and there’s a high chance of Bitcoin's dominance decreasing, altcoins may experience an upward move. So, I am inclined to open a long position on this coin.
📊 The first trigger for a long position is the break of 31.37. The main trigger to start the coin's primary trend will be 35.20.
💥 If you believe the market will move downward and are looking for a short position, breaking the support level I marked could lead to a price decline towards 25.42.
📝 Final Thoughts
Stay calm, trade wisely, and let's capture the market's best opportunities!
This analysis reflects our opinions and is not financial advice.
Share your thoughts in the comments, and don’t forget to share this analysis with your friends! ❤️
YieldBricks | $YBR | Real world asset accumulation zone This #RWA gem YieldBricks ( MEXC:YBRUSDT ) is still trading inside the accumulation zone, and we are in the end of a healthy pullback → a good time to DCA.

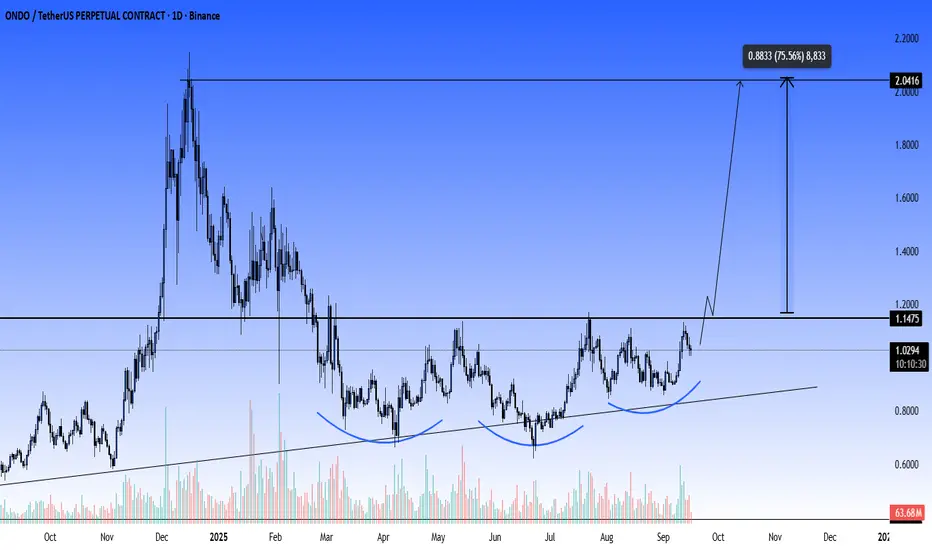
Ondousdt iH&S pattern about to take breakoutondo will dominate this bull rally , LFG...
trgt $2 ,$2.5 , $3
send it to the moon...
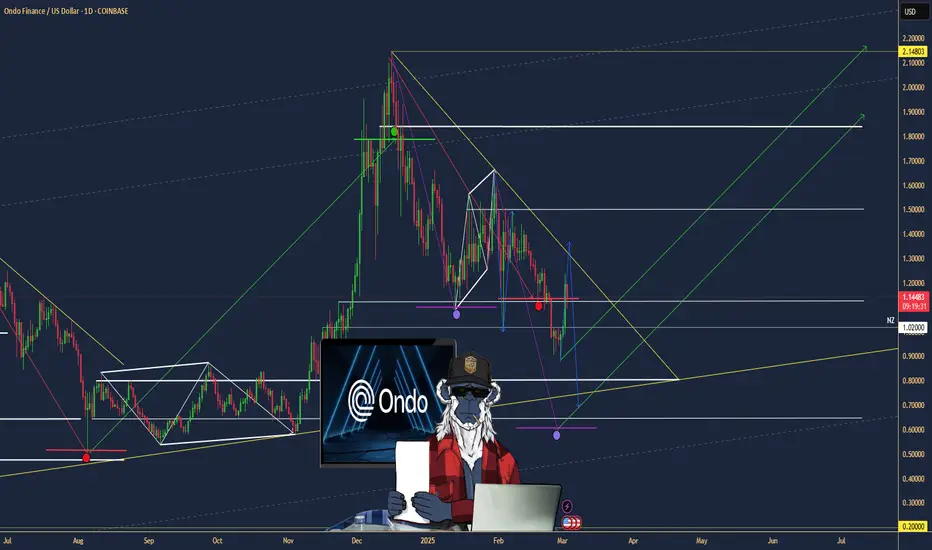
$ONDO: Ondo Finance – Tokenizing the Future or Facing Roadblocks
(1/9)
Good morning, champs! ☀️ LSE:ONDO : Ondo Finance – Tokenizing the Future or Facing RWA Roadblocks?
Ondo Finance just joined Mastercard’s Multi-Token Network, aiming to tokenize U.S. Treasuries! But with market volatility, is this RWA gem a buy or a wait? Let’s dive in! 🔍
(2/9) – PRICE PERFORMANCE 📊
• Recent Trend: Transaction volume spiked to 400M in Jan 2025, now ~300M 💰
• Market Insight: Up 1.6% recently (Daily Hodl, Feb 2025) 📏
• Sector: RWA tokenization surging with TradFi interest 🌟
It’s buzzing in the DeFi space! ⚙️
(3/9) – MARKET POSITION 📈
• Market Cap: Not specified; holds 40% of tokenized securities market 🏆
• Holdings: U.S. Treasuries, bonds via USDY, OUSG tokens ⏰
• Trend: Whales hold 88% of tokens, per IntoTheBlock 🎯
Firm, leading RWA tokenization! 🚀
(4/9) – KEY DEVELOPMENTS 🔑
• Partnership: Joined Mastercard MTN as first RWA provider (Feb 26, 2025) 🔄
• Expansion: Teamed with World Liberty Financial for RWAs 🌍
• Market Reaction: Steady growth in transaction volume 📋
Adapting, bridging TradFi and DeFi! 💡
(5/9) – RISKS IN FOCUS ⚡
• Volatility: Crypto market swings could hit token value 🔍
• Regulation: Compliance hurdles in tokenized assets 📉
• Concentration: High whale ownership (88%) risks dumps ❄️
Tough, but risks loom! 🛑
(6/9) – SWOT: STRENGTHS 💪
• RWA Leader: 40% tokenized securities market share 🥇
• Big Backers: BlackRock, Coinbase Ventures support 📊
• Tech Edge: Tokenizing U.S. Treasuries for DeFi 🔧
Got fuel in the tank! 🏦
(7/9) – SWOT: WEAKNESSES & OPPORTUNITIES ⚖️
• Weaknesses: High whale concentration, market volatility 📉
• Opportunities: TradFi integration, DeFi yield growth 📈
Can it tokenize to the moon? 🤔
(8/9) – 📢Transaction volume at 300M, Mastercard partnership live, your take? 🗳️
• Bullish: $2 soon, TradFi loves it 🐂
• Neutral: Steady, risks balance ⚖️
• Bearish: $0.90 looms, whales dump 🐻
Chime in below! 👇
(9/9) – FINAL TAKEAWAY 🎯
SMCI’s transaction volume and TradFi ties scream potential 📈, but whale concentration adds caution 🌿. Volatility’s our buddy—dips are DCA gold 💰. Grab ‘em low, climb like pros! Gem or bust?
TradersCity Pro | INJ Consolidates Below Descending Trendline👋 Welcome to TradersCity Pro!
In this analysis, I want to review the INJ coin for you. One of the RWA coins, with a market cap of $1.3 billion, ranked 68th on CoinMarketCap.
⌛️ 4-hour timeframe
This coin is on a very important Maker Buyer zone and has reacted to it several times.
✔️ On the other hand, it also has a descending trendline that has followed the price from the 14.94 top and is considered a very important dynamic resistance.
✨ At the moment, the price has reached this trendline, and a red candle has also formed below this trendline, and it seems to have been rejected from it.
🔍 Given the very low volume we have, the probability of starting a trend in either direction is very low, and as long as the volume is low, any move can turn out to be fake.
🎲 In case of a breakout of the trendline and activation of the 13.38 trigger, we can open a long position. But the important point is that when the price moves toward this trigger, the volume should increase so that the probability of a fake move decreases.
🔽 For the short position as well, we can enter with a break of the support zone. For this trigger too, it is very important that the volume increases so that the move does not turn out fake.
📝 Final Thoughts
Stay calm, trade wisely, and let's capture the market's best opportunities!
This analysis reflects our opinions and is not financial advice.
Share your thoughts in the comments, and don’t forget to share this analysis with your friends! ❤️

ZKUSDT - your capital will be doubled on thisIf you want to double your capital in a short period, then ZK is the coin to focus on.
-It’s still at the bottom.
-It formed a symmetrical triangle and already broke out, now doing a retest.
-There’s also an inverse head & shoulders pattern in play.
-Currently sitting right on the 25 EMA support on the daily timeframe.
Buy it spot, and you’ll thank me later.
Best Regards:
Ceciliones🎯

TradeCityPro | XLM: Key Support Holding Amid Seller Pressure👋 Welcome to TradeCity Pro!
In this analysis, I want to review the XLM coin for you. It is one of the RWA projects with a market cap of $12.76 billion, currently ranked 13th on CoinMarketCap.
📅 Daily Timeframe
In the daily timeframe, this coin has reached a Maker Seller zone. So far, it has tested this zone twice and has been rejected both times.
🔍 In the second rejection, a lower high was formed, which shows weakness in the bearish trend. There is an important support level at 0.3629, and as long as the price remains above this level, the trend of this coin will stay bullish.
⚡️ If 0.3629 is broken, a deeper correction could extend to 0.3142. If the price continues to drop further, the main support of XLM will be around the 0.2244 zone.
✔️ However, if the price does not break below the 0.3629 level, I will try to open a long position with a breakout above the zone, because this level is very important, and its breakout could start a new bullish trend.
💥 The breakout trigger for this zone is currently at 0.4896, but in lower timeframes, we can find better triggers when the price reaches this level.
🔽 For a short position, we can open one if 0.3629 is broken, but for now, I will not open a short position, and if I take long positions, I prefer to do so on other coins instead of XLM.
📝 Final Thoughts
Stay calm, trade wisely, and let's capture the market's best opportunities!
This analysis reflects our opinions and is not financial advice.
Share your thoughts in the comments, and don’t forget to share this analysis with your friends! ❤️

$ONDO ABC Correction in Wave 2?LSE:ONDO wave (c) of 2 appears to be underway after the failure to reach a new local high. However there is strong support just below of the daily pivot and 200EMA.
Failure to hold this level brings up the High Volume Node support and golden pocket at $0.79. RSI has room to fall and the alt-coin golden pocket, Fibonacci 0.786 sits at the S1 daily pivot.
Analysis is invalidated above wave B.
Safe trading