EURGBP: Short Signal with Entry/SL/TP
EURGBP
- Classic bearish formation
- Our team expects pullback
SUGGESTED TRADE:
Swing Trade
Short EURGBP
Entry - 0.8800
Sl - 0.8805
Tp - 0.8791
Our Risk - 1%
Start protection of your profits from lower levels
Disclosure: I am part of Trade Nation's Influencer program and receive a monthly fee for using their TradingView charts in my analysis.
❤️ Please, support our work with like & comment! ❤️
S-signal

EURUSD: Short Signal Explained
EURUSD
- Classic bearish pattern
- Our team expects retracement
SUGGESTED TRADE:
Swing Trade
Sell EURUSD
Entry - 1.1530
Stop - 1.1537
Take - 1.1520
Our Risk - 1%
Start protection of your profits from lower levels
Disclosure: I am part of Trade Nation's Influencer program and receive a monthly fee for using their TradingView charts in my analysis.
❤️ Please, support our work with like & comment! ❤️

EURCAD Trading Opportunity! SELL!
My dear followers,
This is my opinion on the EURCAD next move:
The asset is approaching an important pivot point 1.6259
Bias - Bearish
Technical Indicators: Supper Trend generates a clear short signal while Pivot Point HL is currently determining the overall Bearish trend of the market.
Goal - 1.6220
About Used Indicators:
For more efficient signals, super-trend is used in combination with other indicators like Pivot Points.
Disclosure: I am part of Trade Nation's Influencer program and receive a monthly fee for using their TradingView charts in my analysis.
———————————
WISH YOU ALL LUCK

GOLD What Next? BUY!
My dear subscribers,
This is my opinion on the GOLD next move:
The instrument tests an important psychological level 4066.7
Bias - Bullish
Technical Indicators: Supper Trend gives a precise Bullish signal, while Pivot Point HL predicts price changes and potential reversals in the market.
Target - 4082.3
My Stop Loss - 4057.6
About Used Indicators:
On the subsequent day, trading above the pivot point is thought to indicate ongoing bullish sentiment, while trading below the pivot point indicates bearish sentiment.
Disclosure: I am part of Trade Nation's Influencer program and receive a monthly fee for using their TradingView charts in my analysis.
———————————
WISH YOU ALL LUCK

GBPAUD The Target Is DOWN! SELL!
My dear subscribers,
This is my opinion on the GBPAUD next move:
The instrument tests an important psychological level 2.0297
Bias - Bearish
Technical Indicators: Supper Trend gives a precise Bearish signal, while Pivot Point HL predicts price changes and potential reversals in the market.
Target - 2.0205
About Used Indicators:
On the subsequent day, trading above the pivot point is thought to indicate ongoing bullish sentiment, while trading below the pivot point indicates bearish sentiment.
Disclosure: I am part of Trade Nation's Influencer program and receive a monthly fee for using their TradingView charts in my analysis.
———————————
WISH YOU ALL LUCK

NATGAS Set To Fall! SELL!
My dear followers,
I analysed this chart on NATGAS and concluded the following:
The market is trading on 4.577pivot level.
Bias - Bearish
Technical Indicators: Both Super Trend & Pivot HL indicate a highly probable Bearish continuation.
Target - 4.474
About Used Indicators:
A super-trend indicator is plotted on either above or below the closing price to signal a buy or sell. The indicator changes color, based on whether or not you should be buying. If the super-trend indicator moves below the closing price, the indicator turns green, and it signals an entry point or points to buy.
Disclosure: I am part of Trade Nation's Influencer program and receive a monthly fee for using their TradingView charts in my analysis.
———————————
WISH YOU ALL LUCK

BTCUSDT.P - November 24, 2025Bitcoin recently formed a short-term ascending channel, showing improving momentum after a strong prior selloff. Price is currently consolidating near 86,900, with key support at 85,900 and 84,400, and resistance at 88,100 and 91,900. A breakout above 88,100 would signal additional bullish momentum toward 91,900, while any failure to hold above the rising trendline could trigger a retest of lower support levels. The current structure suggests neutral to slightly bullish momentum in the immediate term.

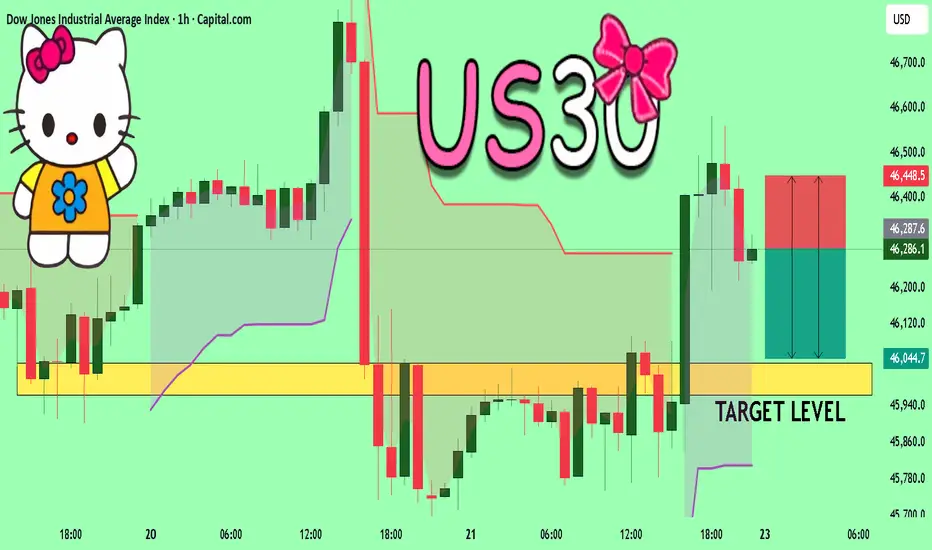
US30: Bearish Continuation & Short Signal
US30
- Classic bearish formation
- Our team expects fall
SUGGESTED TRADE:
Swing Trade
Sell US30
Entry Level - 46270
Sl - 46419
Tp - 46011
Our Risk - 1%
Start protection of your profits from lower levels
Disclosure: I am part of Trade Nation's Influencer program and receive a monthly fee for using their TradingView charts in my analysis.
❤️ Please, support our work with like & comment! ❤️

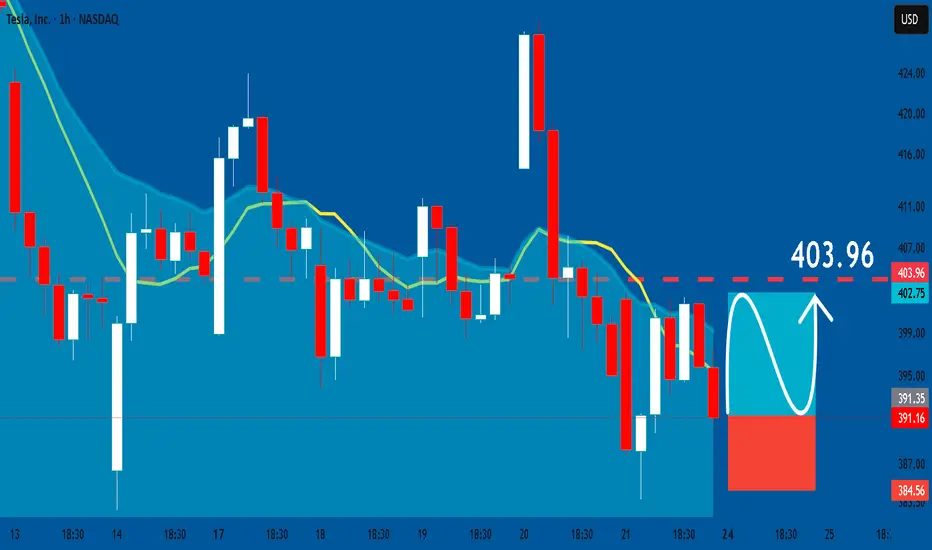
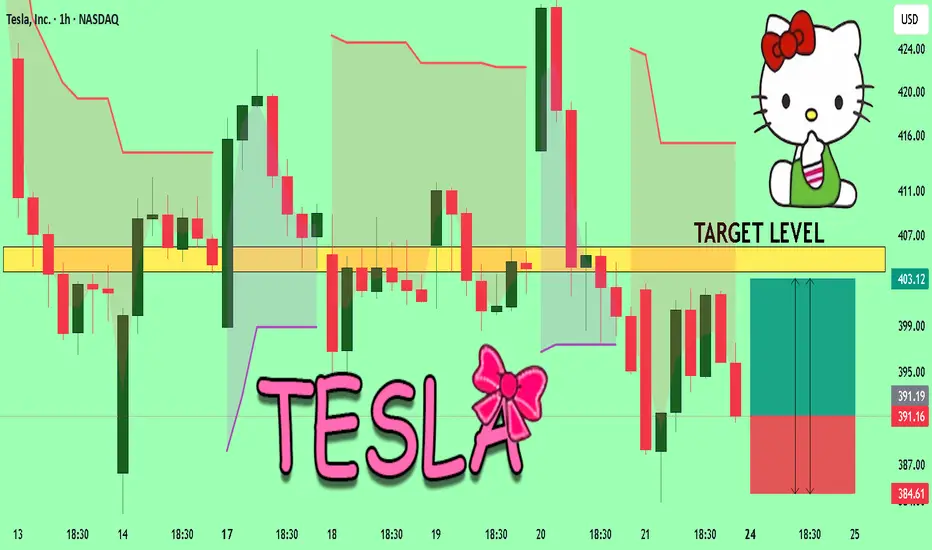
TESLA: Long Signal Explained
TESLA
- Classic bullish pattern
- Our team expects retracement
SUGGESTED TRADE:
Swing Trade
Buy TESLA
Entry - 391.16
Stop - 384.56
Take - 403.96
Our Risk - 1%
Start protection of your profits from lower levels
Disclosure: I am part of Trade Nation's Influencer program and receive a monthly fee for using their TradingView charts in my analysis.
❤️ Please, support our work with like & comment! ❤️
EURCHF What Next? SELL!
My dear friends,
Please, find my technical outlook for EURCHF below:
The price is coiling around a solid key level - 0.9308
Bias - Bearish
Technical Indicators: Pivot Points Low anticipates a potential price reversal.
Super trend shows a clear sell, giving a perfect indicators' convergence.
Goal - 0.9300
Safe Stop Loss - 0.9313
About Used Indicators:
The pivot point itself is simply the average of the high, low and closing prices from the previous trading day.
Disclosure: I am part of Trade Nation's Influencer program and receive a monthly fee for using their TradingView charts in my analysis.
———————————
WISH YOU ALL LUCK

SPY Set To Grow! BUY!
My dear subscribers,
My technical analysis for SPY is below:
The price is coiling around a solid key level - 659.05
Bias - Bullish
Technical Indicators: Pivot Points Low anticipates a potential price reversal.
Super trend shows a clear buy, giving a perfect indicators' convergence.
Goal - 669.74
About Used Indicators:
By the very nature of the supertrend indicator, it offers firm support and resistance levels for traders to enter and exit trades. Additionally, it also provides signals for setting stop losses
Disclosure: I am part of Trade Nation's Influencer program and receive a monthly fee for using their TradingView charts in my analysis.
———————————
WISH YOU ALL LUCK

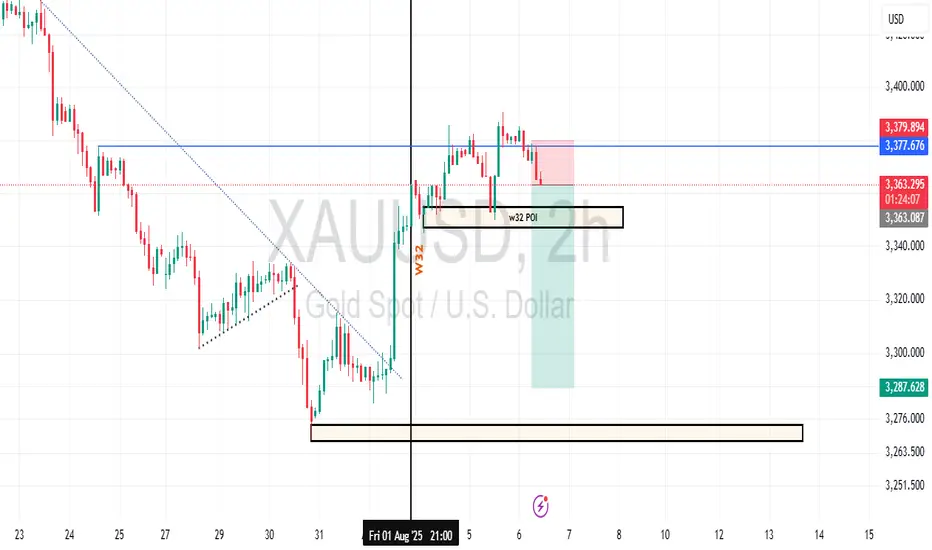
Gold Week 32 Possible reversalGold prices are in a clear downtrend, with critical support at $3,287.628 and resistance at $3,379.874. The 'W32 POI 2H' on Aug 1 highlighted a volatile 2-hour period with a sharp drop and recovery, signaling potential support strength. Fibonacci retracement levels could play a key role in identifying retracement targets. Stay disciplined with risk management as you navigate these levels.
BTCUSDT.P - November 23, 2025Bitcoin remains in a pronounced daily downtrend with persistent lower highs and lower lows, reflecting strong bearish momentum. The price is now targeting major support zones near 78,250 and 60,300. There is currently no indication of reversal; a sustained move above support would be necessary to suggest any bullish recovery. Until then, momentum and trend bias remain decisively bearish.

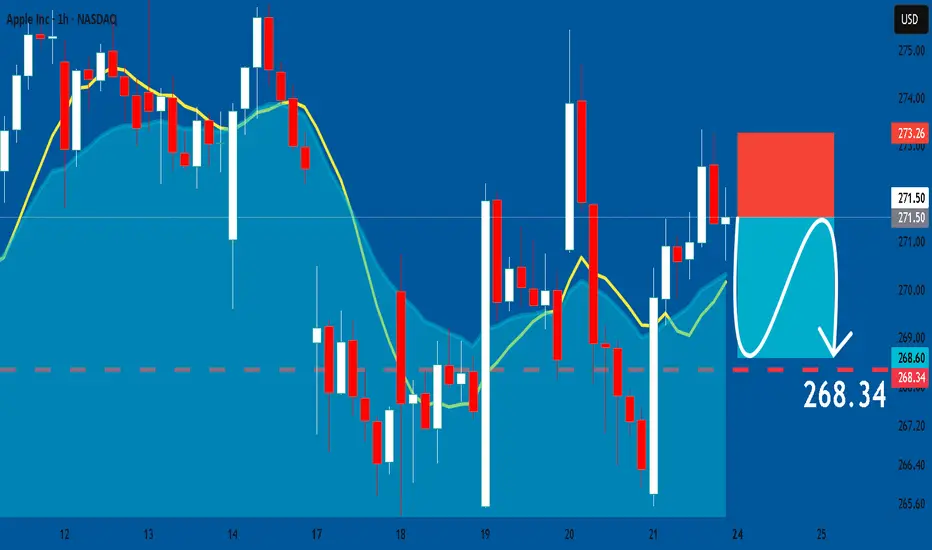
APPLE: Trading Signal From Our Team
APPLE
- Classic bearish formation
- Our team expects pullback
SUGGESTED TRADE:
Swing Trade
Short APPLE
Entry - 271.49
Sl - 273.26
Tp - 268.34
Our Risk - 1%
Start protection of your profits from lower levels
Disclosure: I am part of Trade Nation's Influencer program and receive a monthly fee for using their TradingView charts in my analysis.
❤️ Please, support our work with like & comment! ❤️
EURUSD: Long Signal with Entry/SL/TP
EURUSD
- Classic bullish setup
- Our team expects bullish continuation
SUGGESTED TRADE:
Swing Trade
Long EURUSD
Entry Point - 1.1515
Stop Loss - 1.1509
Take Profit - 1.1527
Our Risk - 1%
Start protection of your profits from lower levels
Disclosure: I am part of Trade Nation's Influencer program and receive a monthly fee for using their TradingView charts in my analysis.
❤️ Please, support our work with like & comment! ❤️

TESLA Will Explode! BUY!
My dear friends,
My technical analysis for TESLA is below:
The market is trading on 391.16 pivot level.
Bias - Bullish
Technical Indicators: Both Super Trend & Pivot HL indicate a highly probable Bullish continuation.
Target - 403.74
Recommended Stop Loss - 384.61
About Used Indicators:
A pivot point is a technical analysis indicator, or calculations, used to determine the overall trend of the market over different time frames.
Disclosure: I am part of Trade Nation's Influencer program and receive a monthly fee for using their TradingView charts in my analysis.
———————————
WISH YOU ALL LUCK
USOIL The Target Is UP! BUY!
My dear friends,
USOIL looks like it will make a good move, and here are the details:
The market is trading on 57.97 pivot level.
Bias - Bullish
Technical Indicators: Supper Trend generates a clear long signal while Pivot Point HL is currently determining the overall Bullish trend of the market.
Goal - 58.98
About Used Indicators:
Pivot points are a great way to identify areas of support and resistance, but they work best when combined with other kinds of technical analysis
Disclosure: I am part of Trade Nation's Influencer program and receive a monthly fee for using their TradingView charts in my analysis.
———————————
WISH YOU ALL LUCK

US30 Will Collapse! SELL!
My dear subscribers,
US30 looks like it will make a good move, and here are the details:
The market is trading on 46286 pivot level.
Bias - Bearish
My Stop Loss - 46448
Technical Indicators: Both Super Trend & Pivot HL indicate a highly probable Bearish continuation.
Target - 46034
About Used Indicators:
The average true range (ATR) plays an important role in 'Supertrend' as the indicator uses ATR to calculate its value. The ATR indicator signals the degree of price volatility.
Disclosure: I am part of Trade Nation's Influencer program and receive a monthly fee for using their TradingView charts in my analysis.
———————————
WISH YOU ALL LUCK
US500 - Oversold at Triple Confluence… Bounce Incoming?US500 is approaching a major oversold zone, where three powerful elements intersect at the same point:
• The lower bound of the falling red channel
• The blue long-term trendline
• The orange structure zone acting as demand
⚔️This alignment creates a strong confluence area, a spot where buyers usually step in to absorb selling pressure and trigger corrective moves.
As long as the index holds above this zone, we can expect the possibility of a bullish correction toward the upper trendlines. But if this area fails, the structure would weaken and open the door for deeper downside.
Right now, all eyes are on this confluence… will the US500 bounce from the oversold zone, or break through it? 🤔
⚠️ Disclaimer: This is not financial advice. Always do your own research and manage risk properly.
📚 Stick to your trading plan regarding entries, risk, and management.
Good luck! 🍀
All Strategies Are Good; If Managed Properly!
~Richard Nasr.

XRPUSDT.P - November 22, 2025The chart for XRPUSDT shows a sustained downtrend, confirmed by a descending trendline and a consistent pattern of lower highs and lower lows. Price action is currently consolidating below the trendline, with resistance around 1.95 and key support marked near 1.72 and 1.32. Momentum remains bearish; a failed recovery above resistance could trigger a sharp move down to the next support zone. If buyers regain control and break above the trendline, a short-term reversal toward 1.95 is possible, but overall trend structure favors sellers.

ETHUSDT.P - November 22, 2025Ethereum is trading in a clear short-term downtrend, defined by consistent lower highs and a descending trendline resistance overhead. Momentum remains bearish and, unless price can reclaim the 2,825–2,875 resistance bands, the next support zone to watch sits around 2,625; failure there could see an extension lower toward the 2,525 region.

BTCUSDT.P - November 22, 2025Bitcoin is in a pronounced downtrend, with price action consistently making lower highs under the descending trendline and currently trading below both resistance levels at 86,313 and 88,214. Recent momentum remains bearish, with sellers actively defending rallies and price targeting the marked support band near 78,800–79,000; unless price recovers above 86,313 resistance, expect further weakness and trend continuation.

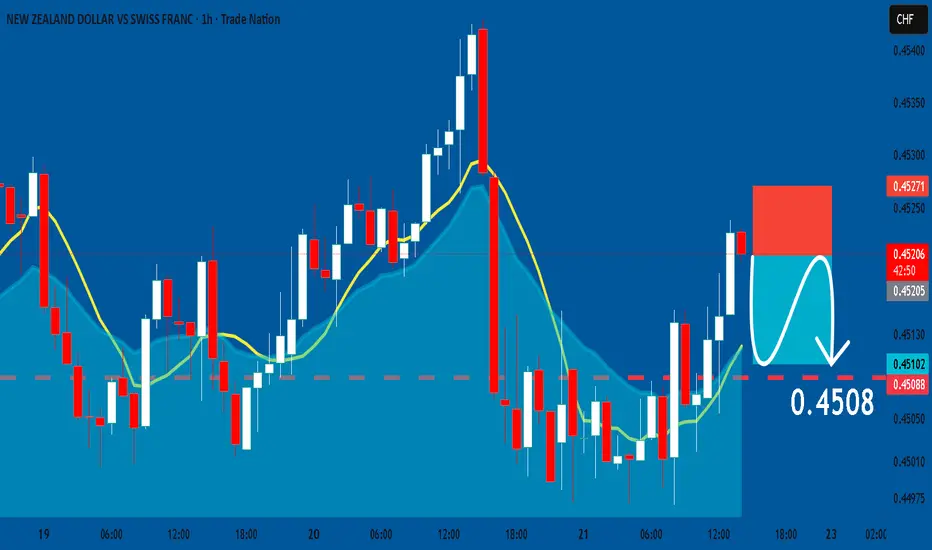
NZDCHF: Short Trade with Entry/SL/TP
NZDCHF
- Classic bearish pattern
- Our team expects retracement
SUGGESTED TRADE:
Swing Trade
Sell NZDCHF
Entry - 0.4520
Stop - 0.4527
Take - 0.4508
Our Risk - 1%
Start protection of your profits from lower levels
Disclosure: I am part of Trade Nation's Influencer program and receive a monthly fee for using their TradingView charts in my analysis.
❤️ Please, support our work with like & comment! ❤️