Silver & the $100 MagnetFrom a long-term perspective, Silver remains clearly bullish, holding well above the blue rising trendline.
Zooming in, the short-term structure is just as clean. XAGUSD is trading inside a rising red channel, respecting both its upper and lower bounds with precision.
As long as this red channel continues to hold, my focus stays on trend-following long setups. The natural target remains the upper bound of the channel, which aligns perfectly with the $100 level, a round number that has been acting like a magnet for price.
What do you think? Does Silver tap $100 again before any deeper correction? 🤔
⚠️ Disclaimer: This is not financial advice. Always do your own research and manage risk properly.
📚 Stick to your trading plan regarding entries, risk, and management.
Good luck! 🍀
All Strategies Are Good; If Managed Properly!
~Richard Nasr
Safehaven

Gold Prep for $5,000 -- Q1 2026Based on Gold's macro Elliott Wave structure, the pending new all-time high near $5,000 is likely to unleash the most magnificently tremendous episode of bear power ever witnessed in Gold's history.
The elders, boomers, OGs, etc. are likely preparing to migrate to crypto. I believe this is the quiet part that institutions and media is not saying out loud. Then again, this idea of a catalyst is totally speculation.
The chart is more of a science.

Gold M15 FVG Hold and Continuation Setup📝 Description
TVC:GOLD is consolidating above a short-term FVG after a strong impulsive leg. Price is holding structure and showing acceptance above intraday support, suggesting continuation rather than distribution.
________________________________________
📈 Signal / Analysis
Primary Bias: Bullish while price holds above the M15 FVG base
Preferred Setup:
• Entry: 4,586
• Stop Loss: Below 4,573
• TP1: 4,601
• TP2: 4,612
• TP3: 4,629 (ATH liquidity)
________________________________________
🎯 ICT & SMC Notes
• Clean impulsive leg with shallow pullback
• FVG acting as valid support
• Upside liquidity remains intact
________________________________________
🧩 Summary
As long as price holds above the intraday FVG, continuation toward higher liquidity and ATH extension remains the favored scenario.
________________________________________
🌍 Fundamental Notes / Sentiment
Despite near-term USD strength, safe-haven demand and macro uncertainty keep gold supported. Any pullbacks are likely corrective, with upside continuation favored as markets remain sensitive to growth risks and policy uncertainty.
________________________________________
⚠️ Risk Disclosure
Trading involves substantial risk and may result in capital loss. This analysis is for educational purposes only and does not constitute financial advice. Always apply proper risk management, predefined stop-loss levels, and disciplined position sizing aligned with your trading plan.

New ATH Incoming? Gold (XAUUSD) Holds Bullish Structure!Hey Traders,
In today’s trading session, we are monitoring XAUUSD for a buying opportunity around the 4,380 zone. Gold remains in a well-defined uptrend and is currently in a corrective phase approaching the key trendline confluence and the 4,380 support & resistance area, which may act as a strong demand zone for continuation to the upside.
From a fundamental perspective, markets are keenly watching US labor data due Friday. Should the report come in soft, it would likely reinforce expectations of further Fed rate cuts in January, similar to December’s dovish messaging, which tends to weaken the US Dollar and support bullish flows into Gold.
In addition, escalating geopolitical tensions between the US and Venezuela have boosted safe-haven demand, as investors seek protection amid heightened uncertainty, pressuring traditional assets and strengthening gold’s appeal.
With these technical and macro drivers aligned, Gold may continue its bullish trajectory and challenge fresh all-time highs this year.
As always, wait for confirmation and manage risk responsibly.
Trade safe,
Joe.

Gold surges 2.75% on Venezuela, weak dollar! Eyes on new recordsGold has surged 2.75% on Monday and continues higher on Tuesday, now trading around $4,465 and eyeing a retest of record highs at $4,550. This rally is fuelled by Venezuelan tensions, a weaker US dollar, and soft manufacturing data—but is this a breakout or a trap before NFP?
We analyse why the weaker dollar—not pure safe-haven demand—is the dominant driver, as both gold and stocks are rallying together. We then map out the critical Fibonacci levels that will determine whether gold breaks to new highs or corrects back toward $4,400.
Key drivers
- Venezuela tensions & dovish Fed : Gold got a safe-haven bid following Trump's aggressive stance on Venezuela, but the real driver is dollar weakness after Fed Governor Kashkari's dovish comments about slow disinflation and rising unemployment risks.
- Weak Manufacturing PMI : US ISM PMI dropped to 47.9 from 48.4 expected, reinforcing the soft-landing narrative and pushing the dollar lower.
- Dead Cat Bounce invalidated : Price has broken above both the 50% and 61.8% Fibonacci retracements ($4,447), invalidating the bearish "dead cat bounce" scenario that suggested another leg down.
- Upside targets : The immediate hurdle is the 78.6% Fib at $4,490. A break here strongly suggests new record highs toward $4,550 before the NFP report on January 9. Above that, $4,600 and $4,750 are psychological targets.
- Downside risks : Key support is the weekly open at $4,430 (or gap fill at $4,455). A breakdown below the 50% Fib at $4,412 would shift sentiment bearish and open the door to deeper corrections.
- NFP wildcard : Markets are cautious heading into Thursday's jobs report. A weak NFP could fuel another leg higher, while a strong print may trigger profit-taking.
Are you buying the breakout toward $4,550 or waiting for a pullback? Share your gold strategy in the comments and follow for NFP coverage later this week.
This content is not directed to residents of the EU or UK. Any opinions, news, research, analyses, prices or other information contained on this website is provided as general market commentary and does not constitute investment advice. ThinkMarkets will not accept liability for any loss or damage including, without limitation, to any loss of profit which may arise directly or indirectly from use of or reliance on such information.

Gold - Control vs Patience… Who Wins Next?Gold hasn’t done anything crazy lately, and that’s exactly the point.
Zooming out, the structure is still bullish. Every dip so far has been met with buyers, and the market keeps printing higher highs and higher lows.
Right now, price is sitting inside what I like to call a decision zone. This is where the market usually pauses, shakes out impatient traders, and shows its real intention.
As long as we’re holding above this green zone, bulls are still in control. This looks more like a pause or reload than a reversal.
That said, if price loses this area and starts accepting below it, then the story changes... and a deeper correction would be on the table.
What do you think? Will Gold reload and continue higher, or is this where control shifts? 🤔
⚠️ Disclaimer: This is not financial advice. Always do your own research and manage risk properly.
📚 Stick to your trading plan regarding entries, risk, and management.
Good luck! 🍀
All Strategies Are Good; If Managed Properly!
~Richard Nasr

Gold Safe-Haven Bid, Bullish OTE Hold with Upside Move📝 Description
Gold on H4 is holding a bullish HTF structure as rising geopolitical risk keeps it in a classic safe-haven bid. Price is currently consolidating around 4,331, trading inside the H4 OTE zone (0.618–0.786) after the recent pullback from highs. Demand has remained intact on dips, signaling accumulation rather than distribution.
________________________________________
📈 Analysis (Scenario-Based | Non-Signal)
Primary Bias: Bullish, while key lows hold
Liquidity & Pullback Context:
• Short-term chop and liquidity collection likely around 4,305
• Downside inefficiency sits at H4 FVG around 4,250, acting as the main downside magnet if liquidity is required
Continuation Path:
• Holding above OTE favors a rotation back toward H4 FVG 4,440–4,480
• With sustained risk-off flows, price can retest prior highs near 4,550 (BSL)
Risk-Relief Case:
• Any de-escalation may trigger a temporary correction, not a trend flip
• Structural damage only if acceptance occurs below 4,240
________________________________________
🎯 ICT & SMC Notes
• Pullbacks classified as buy-the-dip within HTF bullish context
• OTE (0.618–0.786) holding supports continuation
• H4 FVGs define magnets both above and below
________________________________________
🧩 Summary
Gold remains structurally bullish amid elevated geopolitical risk. Expect short-term volatility and liquidity runs, but as long as ~4,240 holds, dips are corrective. Continuation favors 4,440–4,480, with a potential retest of 4,550 if tensions persist.
________________________________________
⚠️ Risk Disclosure
Trading involves substantial risk and may result in capital loss. This analysis is for educational purposes only and does not constitute financial advice. Always apply proper risk management, predefined stop-loss levels, and disciplined position sizing aligned with your trading plan.

Gold - Breakout, Retest, Reload?Gold continues to respect a clean bullish structure 📈 on the 4H timeframe. After breaking above the previous all-time high, price has shifted that level into demand, confirming strength rather than exhaustion.
⚔️The rising blue trendline remains intact , and every pullback so far has been met with aggressive dip-buying, reinforcing the trend-following environment.
As long as price holds above the highlighted demand zone, the bias remains firmly bullish.
From here, the plan is simple and disciplined:
🏹I’ll be looking for longs on pullbacks into demand, in alignment with the trend, rather than chasing price higher. A clean reaction from this zone keeps the path open for continuation toward new highs.
⚠️ Disclaimer: This is not financial advice. Always do your own research and manage risk properly.
📚 Stick to your trading plan regarding entries, risk, and management.
Good luck! 🍀
All Strategies Are Good; If Managed Properly!
~Richard Nasr

Gold - Pullback or Reload Before the Next Push?📈 Gold remains overall bullish , trading within a well-defined ascending structure.
Price is now approaching a high-confluence area, where the demand zone aligns perfectly with the lower red trendline. This intersection is critical, as it represents a classic trend-following buy zone within a healthy uptrend.
⚔️As long as this zone holds, we will be looking for bullish reactions and continuation setups, aiming for a move back toward the upper side of the channel and the previous highs.
A clean rejection from this level would confirm buyers are still in control.
A decisive breakdown below it would invalidate this bullish scenario.
Is Gold setting up for another trend continuation, or will it surprise the crowd? 🤔👇
⚠️ Disclaimer: This is not financial advice. Always do your own research and manage risk properly.
📚 Stick to your trading plan regarding entries, risk, and management.
Good luck! 🍀
All Strategies Are Good; If Managed Properly!
~Richard Nasr

Gold - Bullish Structure Still Intact… Eyes on the Next Higher!!📈Gold remains overall bullish, consistently forming higher lows along its rising trendline. Every time price tapped the lower boundary of the structure, buyers stepped in aggressively, and we may be approaching that point again.
⚔️Price is currently hovering near a blue support zone, which aligns perfectly with the rising trendline. As long as this confluence holds, we will be looking for trend-following longs, targeting the upper resistance zone highlighted in beige.
🏹If buyers defend this area once again, Gold could be preparing its next impulsive leg upward.
Do you expect Gold to print another higher low here? Share your thoughts below 👇
⚠️ Disclaimer: This is not financial advice. Always do your own research and manage risk properly.
📚 Stick to your trading plan regarding entries, risk, and management.
Good luck! 🍀
All Strategies Are Good; If Managed Properly!
~Richard Nasr

XAUUSD - The Golden Retest Zone!📈Gold remains overall bullish , respecting its rising structure and printing higher lows along the way. Each corrective dip has been met with strong buying pressure, keeping the broader trend intact.
📉As price pulls back, it is now approaching a key blue structure zone that aligns perfectly with the lower blue trendline. This intersection forms a high-confluence area where we will be looking for trend-following longs.
⚔️As long as Gold holds this zone, the bullish scenario remains dominant, with the next potential push targeting the previous ATH highlighted on the chart.
🏹A clean reaction here could be the catalyst for the next leg of the uptrend.
Will the bulls defend the golden zone again? 🤔
⚠️ Disclaimer: This is not financial advice. Always do your own research and manage risk properly.
📚 Stick to your trading plan regarding entries, risk, and management.
Good luck! 🍀
All Strategies Are Good; If Managed Properly!
~Richard Nasr

Gold Reload Zone… Bulls Waiting Patiently!📈Gold remains overall bullish, respecting both its rising structure and the major support zones beneath current price. After breaking above the light-blue resistance area, XAUUSD is now pushing higher, but a pullback remains very likely before the next impulse.
⚔️On the upcoming retest of the blue structure zone and the rising trendline, we will be looking for trend-following longs. This area has acted as support multiple times and now aligns with the bullish context, making it a high-probability buy zone.
🏹As long as Gold remains above the red demand area and respects the rising structure, the next wave upward toward the 4,385 resistance remains the most likely scenario. Only a clean break below the red zone would weaken the bullish outlook.
For now, patience is key… wait for the retest, then look for longs from structure. 🤔
⚠️ Disclaimer: This is not financial advice. Always do your own research and manage risk properly.
📚 Stick to your trading plan regarding entries, risk, and management.
Good luck! 🍀
All Strategies Are Good; If Managed Properly!
~Richard Nasr

XAUUSD - Bulls Still Stepping In at Demand… Watching the Retest!Gold remains overall bullish, holding firmly above the major support zone around $4,000–$4,050. This entire red area has been acting as a strong demand zone for weeks, with price bouncing from it multiple times, a clear sign that buyers are defending this level aggressively.
📈XAUUSD is also respecting the rising trendline , forming a clean higher-low structure. As long as Gold remains above both the trendline and the support zone, the bullish outlook stays intact. I will be looking for long setups on the next retest of this confluence area.
🏹If buyers step in again, the next move could push toward the previous highs near $4,385. But if price breaks below the support zone and the trendline, the bullish structure would weaken and open the door for a deeper correction.
For now, this zone is the key. Will Gold bounce again… or finally break through support? 🤔
⚠️ Disclaimer: This is not financial advice. Always do your own research and manage risk properly.
📚 Stick to your trading plan regarding entries, risk, and management.
Good luck! 🍀
All Strategies Are Good; If Managed Properly!
~Richard Nasr

USDJPY breakout: Can the rally extend toward 155?The dollar-yen pair smashed through 150 with one of the strongest breakouts recently, confirming a new technical phase as it trades above the 61.8% Fib retracement. Here’s what’s fuelling the move and what traders should watch next:
Dollar strength returned as safe haven flows dominate, even with a US government shutdown, while Japan’s new prime minister’s dovish signals are sending the yen into freefall.
Key drivers
Safe haven flows : Investors seek shelter in the dollar as global uncertainty rises; DXY index hit a 6-week high.
Yield differentials : The Fed/BOJ spread powers further carry trade buying as Japanese rates remain ultra-low.
Japanese political shift : PM Takaichi’s win spurs fiscal stimulus and pushes back market hopes for BOJ tightening, deepening yen weakness.
Technical breakout : Clean break above multi-year resistance and 61.8% Fibonacci retracement; watch for support validation and continuation toward the next 78.6% Fib at 154.80.
What to watch
Holding above 150 and 61.8% Fib support sets the stage for a bullish continuation.
Profit taking is possible near 153.25–154.80, as RSI shows signs of overbought.
Tonight’s FOMC minutes, Thursday’s BoJ/Ueda speech, and political headlines could trigger sharp moves.
Cross-pair momentum : EURJPY at record highs, GBPJPY surging, confirming broad-based yen weakness.
The bulls are in control as long as USDJPY stays above 151.15–150.50. Pullbacks to support offer opportunities to buy dips, with 154.80 as the next bullish target. Keep stop losses disciplined, and don’t ignore the chance for sharp reversals if intervention or a dramatic shift in sentiment emerges.
For more actionable FX insight, follow ThinkMarkets.
This content is not directed to residents of the EU or UK. Any opinions, news, research, analyses, prices or other information contained on this website is provided as general market commentary and does not constitute investment advice. ThinkMarkets will not accept liability for any loss or damage including, without limitation, to any loss of profit which may arise directly or indirectly from use of or reliance on such information.

Gold Eyes 4,000 — Key Buy Zone Ahead!!Hey Traders,
Today we’re keeping a close watch on XAUUSD, which continues to trade firmly within its medium-term uptrend. Price is currently pulling back in a healthy correction, and the 4,000 zone stands out as a major confluence level — a structural support, previous reaction area, and dynamic trend touchpoint.
A controlled dip into this zone could attract fresh buyers, especially with markets still leaning toward risk caution and demand for safe-haven flows remaining elevated. As long as the broader trend structure holds, Gold may attempt another leg higher from this area.
Trade safe,
Joe.

XAUUSD IDEA FOR 10TH OCT, 2025. (2H)Here we go again, I'm back at trading the XAU against the USD. It's been a hell of a ride this year, but it is what it is. The Pair is bullish due to sentiment and because Gold is known as a safe-haven asset, and currently, investors are long on the pair because of the weak USD
As we can see, the pair is resuming back on its overall trend from a previous retracement, so what's next?
Note: This is a very volatile pair and often filled with manipulations ensure to risk what you can afford to lose.
As usual, my calls or analysis are based on what I see, the current Bias, and from a probability standpoint, meaning that this projection may be or may not be validated, so tread carefully. This is not financial advice; trade responsibly.

Does US Tech Dominance Outweigh Dovish Fed Policy?The recent slight rise in the USD/CHF pair toward 0.7940 signals a crucial shift in favor of the US Dollar, despite immediate monetary headwinds. While the Federal Reserve is broadly expected to deliver a dovish 25 bps rate cut driven by cooling US inflation and a soft job market, the DXY remains resilient. This Dollar strength is not simply speculative; it highlights profound structural weakness in the Swiss Franc. The chronically negative Swiss ZEW Survey Expectations, which improved only marginally to -46.4 in September, point to persistent domestic economic pessimism, which significantly erodes the Franc's safe-haven appeal. This divergence of underlying economic health proves more influential than short-term rate expectations.
The influence of geopolitical and geostrategic risk further supports the US Dollar. Upcoming high-stakes discussions between the US and Chinese leaders on trade and technology issues, including tariffs and rare earth controls, inject uncertainty into global markets. When major power tensions escalate, the US Dollar automatically benefits from its unrivaled status as the world’s most dominant reserve currency. Capital rapidly flows from smaller, risk-exposed jurisdictions and into USD-denominated assets. This flight to the world's most liquid currency strengthens the Dollar against rivals like the Franc, which is typically a safe-haven but lacks the USD's depth and liquidity.
Crucially, the long-term upward trajectory of the USD/CHF is underpinned by US technological dominance. The United States leads decisively in high-tech sectors, particularly in AI and life sciences. This leadership, evidenced by robust patent analysis and significant private sector investment, guarantees a continuous inflow of global capital. Generative AI alone is projected to add trillions in annual economic value, primarily benefiting US-listed companies. This enduring, structural edge in high-tech and science creates a massive, consistent demand for US assets, systematically bolstering the Dollar's value and allowing it to outperform the Franc, regardless of short-term interest rate adjustments.
In summary, the USD/CHF gain is a complex interaction of factors. Although the Fed is expected to cut rates, a fundamentally weak Swiss economic outlook and immediate geopolitical risks drive capital to the superior stability of the Dollar. Ultimately, the US Dollar's strength derives from the unmatched geostrategic advantage of its reserve status and its sustained global leadership in technology and innovation. These long-term structural drivers decisively outweigh the immediate dovish signals from the Federal Reserve, positioning the USD for continued strength against the Franc.

GBPJPY Eyes 203.000 as Risk-On Mood Weakens YenHey Traders,
In tomorrow’s trading session, we’re monitoring GBPJPY for a buying opportunity around the 203.000 zone. The pair remains in a broader uptrend and is currently in a correction phase, approaching the 203.000 support and resistance area, which aligns with the prevailing trend structure.
On the fundamental side, easing tensions between the US and China are fueling a risk-on environment, typically leading to weaker demand for safe-haven assets like the JPY. This sentiment shift could support further upside in GBPJPY if buyers step in at this level.
Trade safe,
Joe

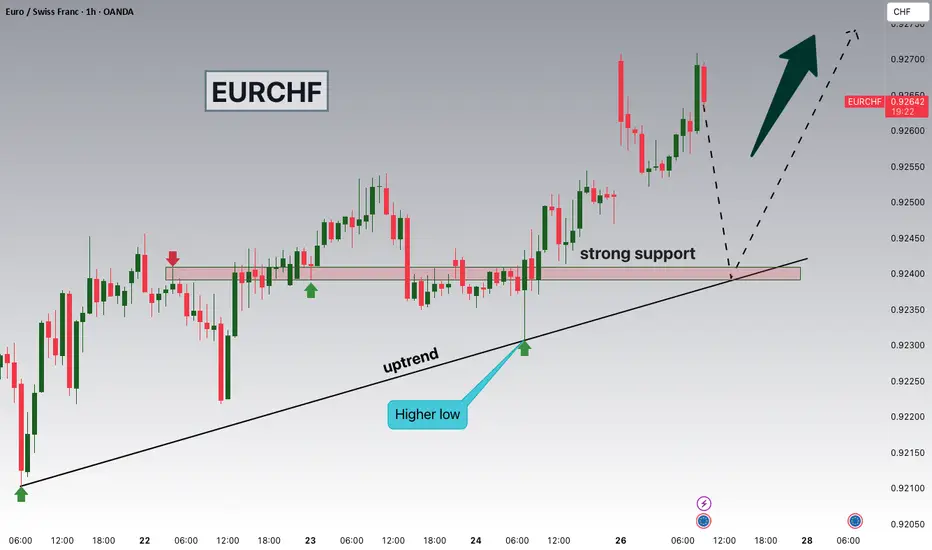
EURCHF Watching 0.92400 as Risk-On Mood Pressures Safe HavensHey Traders, in today’s trading session we’re monitoring EURCHF for a potential buying opportunity around the 0.92400 zone.
The pair remains in an overall uptrend, and price is now in a correction phase, approaching the trendline confluence and key support area near 0.92400.
Structure: EURCHF continues to form higher lows within the broader bullish channel. A successful hold above 0.92400 could signal continuation toward previous highs.
Fundamentals: The recent US–China de-escalation has improved global risk sentiment, leading markets into a risk-on mode. As investors rotate out of safe-haven assets like CHF and JPY, the Euro could gain further ground.
Next move: Watching how price behaves around 0.92400 for potential bullish continuation signals.
💬 What’s your take on the CHF weakness amid improving risk appetite? Share your thoughts below!
Gold Eyes 4,010 Support Ahead of CPI – Big Move Loading?Hey Traders,
In tomorrow’s trading session, we’re monitoring XAUUSD for a potential buying opportunity around the 4,010 zone. Gold remains in a broader uptrend and is currently in a correction phase, approaching a key support and resistance confluence around 4,010 that aligns with the ascending trendline.
Market Focus:
All eyes are on tomorrow’s U.S. CPI release, with expectations for headline inflation at 3.0% and core at 3.1%. A softer-than-expected print could weigh on the U.S. Dollar, potentially igniting fresh momentum for GOLD to resume its bullish trend.
Next Move:
Watching price action around 4,010 closely — if CPI data confirms disinflation, we could see a strong rebound toward recent highs as safe-haven demand strengthens.
💬 What’s your take on the CPI? Are you positioning long or waiting for confirmation? Drop your thoughts below!
Trade safe,
Joe

Palladium - The Calm Before the Next Surge!🏹Palladium has been on a strong bullish run , riding within a clean rising channel. After a sharp impulse, price is now cooling off — and this pullback might just be the calm before the next surge.
⚔️The metal is approaching a major intersection zone where the rising trendline meets a strong demand and structure area, a confluence that has previously sparked powerful rallies. As long as this intersection holds, I’ll be watching for bullish confirmations to join the trend.
A healthy correction into this zone could set the stage for the next impulsive wave, with potential upside targets around $1,550 and even $1,700 if momentum kicks in.
In short, Palladium remains overall bullish, and this upcoming retest could be the perfect reload zone before the next big move north.
📊All Strategies Are Good; If Managed Properly!
~Richard Nasr

Gold Testing 4,210 Support as Bulls Eye Another Leg HigherHey Traders, in today’s session we’re keeping a close watch on XAUUSD for a potential buying opportunity around the 4,210 zone. Gold continues to trade within a broader uptrend, and the current pullback appears to be a healthy correction toward a key support and resistance confluence at 4,210.
Market structure:
Momentum remains bullish, with price forming higher highs and higher lows. The ongoing correction could provide a trend-continuation entry if buyers step in near support.
Key level:
4,210 — a decisive zone where previous reactions have sparked renewed buying interest.
Outlook:
A sustained bid from this area could pave the way for another push toward 4,300 and beyond, keeping Gold aligned with its dominant bullish trajectory.
Trade safe,
Joe.

USDJPY Rally Faces Pressure Near 151.250 on Safe-Haven FlowsHey Traders, in the coming week we’re monitoring USDJPY for a selling opportunity around the 151.250 zone.
The pair remains in a broader downtrend, currently in a corrective phase as it approaches this key resistance level.
Meanwhile, DXY is also correcting within its own downtrend, approaching resistance near 98.600, which reinforces the bearish bias on USD pairs.
With US–China tensions escalating, we’re seeing renewed safe-haven demand for JPY, potentially setting the stage for another leg lower in USDJPY.
Trade safe,
Joe
