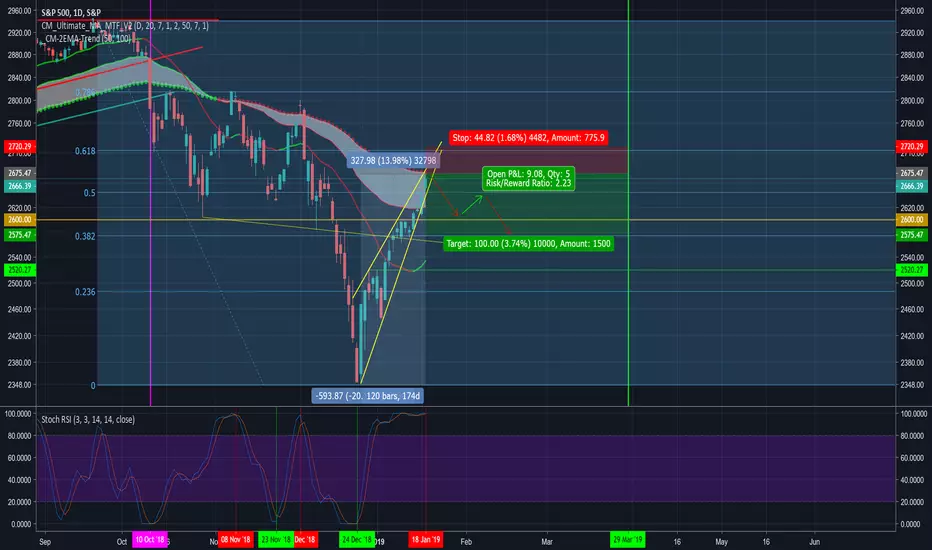
Technical pullback overdue. Time to ladder into $SPX short $SPXSWe have seen the S&P 500 fail to stay above the 100 day EMA repeatedly, now the market has run up 14% since Christmas. While the bottom may be in, in the near term one should expect to see a technical pullback. There is a very large and very ominous wedge encompassing the entire recovery move and the Stochatic RSI has been overbought for four sessions.
Sandp500
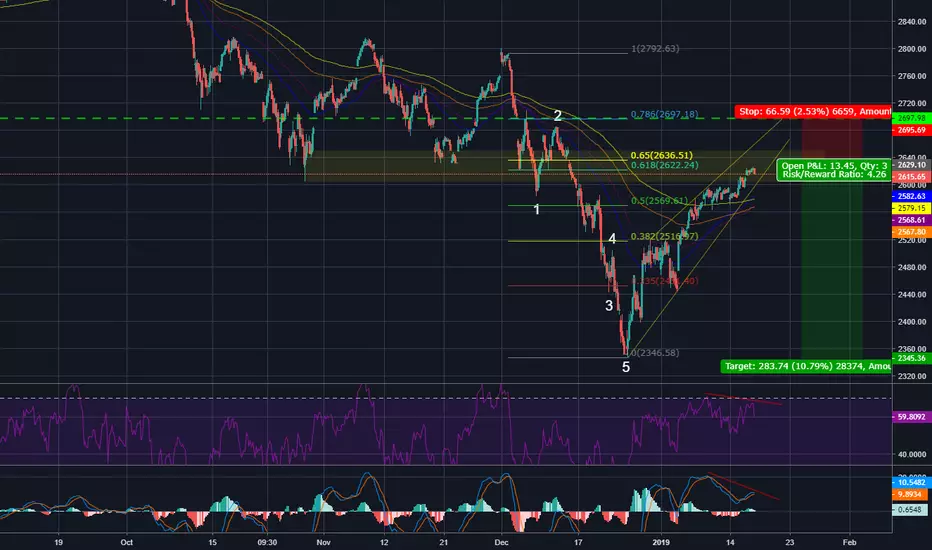
Loading up my short positionCurrently in the yellow resistance field, going up in what looks like a bearish pennant.
Between the .618 and .65 fib ratios is my favorite place to load up for the next stage.
Stop loss set at around 2700 cause if we breach above the green line, we're looking bullish again.
S&P 500: Almost At The Bottom?We still have some margin down with the end of subwave 5.
Find Winning Trades In Seconds >> efcindicator.com (Special Discount)

SPX500 Inverse Head and shouldersWe broke out of this pattern last friday. Targets are the green boxes.

TNA longLong TNA from $53.30 (full position) Reversal day yesterday signaled short term low and closed with a tail candle, today we are retracing the tail. Nice buy setup.

There's nothing bullish about the s&p500There is nothing bullish about the S&p500.....
We got rejected by .382 . stop loss should be placed by the .5 level

SPX - Short wave 4 coming up? If this is possible, then expect a few days upwards before a final wave down for the 5th

Powell and trade war truce may shorten correction $ERX $TQQQAs described in my previous note on the S&P 500, there have been two major market corrections since the end of the Great Recession. They were periods of high volatility and a lot of repricing of stocks for 140 days or more.
In both cases they started with:
1. A complete reset of the daily RSI ( Relative Strength Index below 20)
2. The S&P 500 holds below the 200 day MA
3. The 50bar EMA passes below the 100bar EMA
They end when:
1. The S&P 500 0.54% holds above the 200 day MA
2. The daily RSI holds above 50
3. The 50bar EMA passes above the 100bar EMA
The daily RSI is currently above the trend-line and above 50. The S&P 500 today will open above the 200 day MA and the 50 day EMA should cross above the 100 day EMA within three weeks assuming this new trend continues through Christmas.
When I recently posted on this topic I said "Consumer confidence is high but the only way for this ship to turn around quick is for the Fed to change strategy, that will not happen."
It now looks like it may happen. Additionally, Trump and Xi struck a 90 day trade war truce.
Tech and energy sectors are the most beat up in recent weeks, all of these developments are bullish for these two sectors. Trade opportunities should present them selves in TQQQ and ERX .

S&P500 Is Going To 2400$!Can You See That Negative Divergence? ( When two or more indicators, indexes, or averages, fail to show confirming trends. A negative Divergence occurs when a price index is making a higher top at the same time a technical indicator is flat or making a lower top. )
TP 1: 2600
TP 2: 2500
TP 3: 2400
Good Luck!


SPX500 wanting to blow this tasty Megaphone Descending broadening wedge formation observed, or what I like to call it as- Muh Tasty Megaphone
Price should blow out of it tomorrow, keep an eye for breakout :)

Short term bounce on SPX500SPX500 traded into the 4 hour bullish orderblock and finding support over there, we can see a nice push up to squeeze bottom shorters out.
Expecting a retrace to .705 fib in the chart

SPX See what I mean about the candlestick action before past declines? Refer to my last SandP 500 chart for what I was saying.

SandP500- strictly technicalOk, try to stay with me here.... If we look at SandP in plain old Elliot wave, I see 2 possibilities.... Either all hell breaks loose and it just drops to the 23-38% fib levels and into a wave 4 correction, OR... it will rally again in the form of an ending diagonal considering we should be on wave 5 of a larger degree wave 3. What I find interesting is that if I slide the fib retrace from the high it just made up to the up to the 1.618 extension (white line, typical for a wave 3), the 23% fib retrace slides up and lines up perfectly with the trend fibonacci from beginning of time through the wave patterns (it should anyway, 1.236 extension). The 3000 level should be of some significance also. If you look at past market declines, you can see some higher time frame candlestick action occurring beforehand. It can break the fork and make some kind of smaller flat pattern also before continuing up. I just feel like Donald Trump has been well aware of the math of the market and does not want to be known as a President who had a market crash, considering his wallet and ego.


Pretty confident we are entering a bear marketHello all,
I have been saying the US stock market is going to crash for about a year now, and well, it looks like I might be right.
The significance of my moving averages is due to the fact that they represent 1 year, half a year, and a quarter of a year. You'll notice the year held in the last dip, but has not this time. This is a bearish signal. In addition to this, we are entering into muddy trade waters as per Trump and interest rates are high.
I would strongly suggest not being in the SPX or any large US index right now. We might face a serious deleveraging/depression. I am ready to leave the country if need be. Hope we all survive :)
Godspeed.
-YoungShkreli

SPX - S&P 500 - UPDATE shorti am expecting this to go down . there is every chance it could go back up so be carefull

S&P 500 Stock Market Index Daily ChartThe S&P 500 may still to continue it 4th wave correction as showing the chart. It may drop back to 2720 area for consolidation before resuming final
5th wave to achieve a historical all time high to set the stage for major painful crash.


if the opening continues to fall...if the opening continues to fall we could be in for a 20+ point drop into next week? JMHO

SandP500 Daily showing divergenceSPX is getting to a critical spot. That is what I would like to see it do (ending diagonal). But regardless, a lot of divergence coming in as it seems to be in a running flat as I mentioned before. A spike into that zone (27% extension-3000 level) might be a place to try a tight entry on a short.

SPXRalph Elliot speaking from beyond the grave.... Typically speaking, wave 4 retraces 23-38%. We are on an extended wave 5 of wave 3. Those 2 rectangles are measurements: 1.618 x wave 1, 2.618 x wave 1. Wave 3 typically terminates around 1.618 wave 1 (watch that 3000 area. It may not even reach it, but if it did and hit the top of the 2.618 box, that's a sell all day. I could go down to the last wave and explain it better but you guys, but you don't pay me enough... Just kidding, I'm lazy. Commodities are down. Look at Silver, Platinum, Natural Gas even. If stock market goes into wave 4 retrace, money will be moved to safer investments perhaps. In fact, I feel that I have pretty much all markets sewn up at this point.

Facebook (FB) - Long/Short - Make or Break FB sitting on the weekly trendline, a nice push up would be a buy signal, would like to see a buy pattern form beforehand.
If further breakdown, look for consolidation and sell.
