S&P 500 Index: SPX Next Buy and Sell Points TodayS&P 500 Index Update Next buy and Sell Points
Yesterday the S&P fell 5 points shy of the next target, busting
out the next long as support and stops just under the 2715
break line were hit and so turning a 12 point profit into a 2
or 3 point loss. Not so good.
It looks as if it will fall further now to retest 2669 and maybe
spike as low as 2661 level but should bounce from there at
lowest if it is to show stabilty today.
if wrong and this 2661 level fails to hold up later it will likely fall
away further to 2626-2600 range where it becomes a buy
again with stops below 2590.
So far this decline remains a standard correction or deviation
of 10% - 10% off the top = 2584, the low was 2592 - and it can
at worst fall 11% to 2555 but no lower if this is to remain a
'standard' correction. Should this level fail at any point this
week it will tip this index into serious bear territory - the
decline will then likely extend to 2584, then to 2545 and then
to 2488 where would look to buy once more if this kind of
price action unfolds from here. Don't think it will so far, but
we still need a plan B here, just in case.
Sandp500

S&P 500 Index SPX Next Buy Points From HereS&P 500 Index - Update Next Buy Points
A fantastic clean break gave an entry at 2635 and showing
about a 60 point profit so far to add to the massive short on
this index right down to the lows on Monday. So far this has
been the most profitable week for shorts and then longs on
the major indexes for over 2 years. We've had the easy part,
now it gets a little more difficult again...
It's now probing resistance at 2700 and can come back to 2668
before rallying again. So can close down the long or
alternatively place a stop close under it to trap in profits if it
does come off more from here first before the next rally kicks in.
On the upside there is resistance potential stretching from
2700 up to 2715 - it has to penetrate and hold 2715 to trigger
the next long which should take it to 2732 to begin with and
then after consolidating to 2762 and close to the upper rising
parallel where will look to take profits again if touched.
On downside, if it comes off from here back to 2669-2660
line will look to buy here with stops below 2260.
Any break below 2260 will signal a retest of the lows - and if
we see this will look to buy again from there.
Otherwise can run this long but with stop quite tight under
price from here to trap in profit if it does fall away to 2669 first.

S&P STANDARD AND POOR'S LONG RANGE VIEW, by DANIEL BRUNO, CMTDANIEL BRUNO, CHARTERED MARKET TECHNICIAN. LOOK ME UP ON LINKEDIN
LONG RANGE VIEW FROM 2008
WOW, THE S AND Ps REDISCOVERED GRAVITY.
MY FIRST LOOK IN A LONG TIME. NOTE THAT CRYPTOS ARE CRASHING TOO, AND THE USD AS WELL
FIRST TARGET IS 2/1 ANGLE AROUND 2500 ZONE
THEN 2100 ZONE
WILL HAVE MORE TO SAY LATER, THIS WILL TAKE SOME TIME.

S&P 500 Index Further Downside YetS&P 500 Index: SPX
Same problem as as the Dow - risen to fill the gap and now
retesting near term lows at 27330 - The first real support lies
at 27130 and it looks likely it will be tested soon. Failure to
hold here will signal further near term weakness back to
26687 and potentially, if this level fails, back to 26007

S&P 500As per the long term chart of S&P 500
www.tradingview.com
Below are my review points
1. MACD shows overbought character , which also reflects in price and volume
2. From last two years there was a steady uptrend with few corrections
3. As per my Analysis s&p will hit 3000 mark end of march
4. We can still rely on technical analysis , as there are no fundamental news coming in .
5. In the last few days price dropped more than 100 dollars , which i see a major correction , as price was increasing exponentially in last few weeks and people made shit load of money
6. Those who are still betting on their long positions might do panic sell and bear losses
7. Price might drop further more and can hit support level 2600 in another week's time
8. Good entry would be 2600 or earlier if we see any uptrend move
9. I am relying on MACD to become neutral
Please invest on your own risk
Idea : Sell( short term )
: Buy ( Long term )

Opportunity to short S&P 500Every one on the Street talks about incoming crisis and 5%+ downtrend for main US indexes. I suppose every trader should use such opportunities and open corresponding short positions.
What we have for S&P today? 2017 and January 2018 made it extremely overbought - RSI was on 86, the last time we saw these levels during 1980 rise, and it was followed by 21% correction. Bad news from Apple (3.5% of the whole S&P) and unjustified tax expectations made the trend line breakout, with a wide gap. RSI has approved the signal by breaking through 70 (the most reliable RSI signal). Combing these factors all together I see a safe trade opportunity and open a short position.
The best tactic for TPs is to close step by step. I am going to do it in three steps, as I show on the graph. I also put my SL very closely, because we still have a bull market, and I don't want to take additional, very possible risks.

SandP 500 E-Mini Futures D CME Updated 1/30/2018Price has reached the median line. Price may drop a bit here before trying to continue higher.

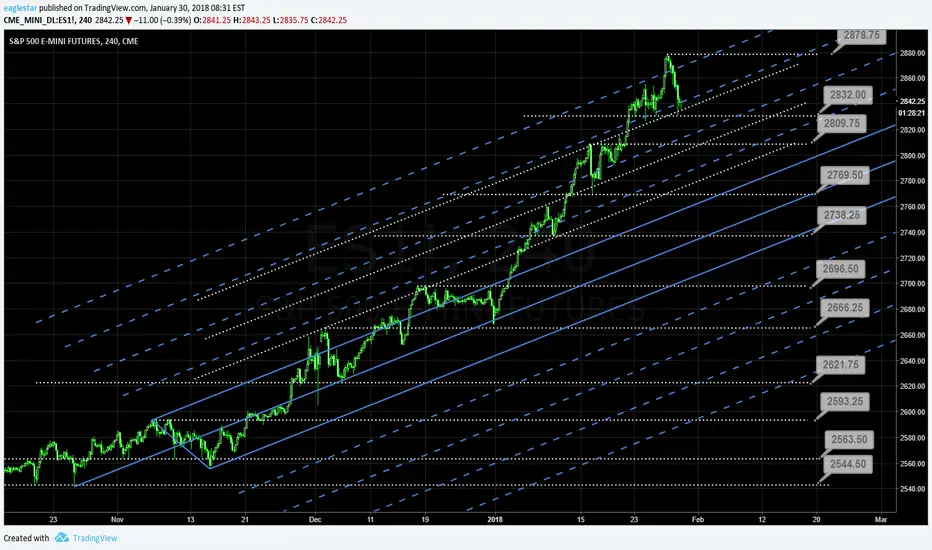
SandP 500 E-Mini Futures 240 CME Updated 1/30/2018 Price has dropped and is resting on the sliding parallel and also suport at 2832. Look to see if price can hold here to try to make a move up. If we break, look for 2810.
SandP 500 E-Mini Futures 60 CME Updated 1/30/2018Price has dropped from warning line 1 to 2829 at support. look to see if we rise up from here a bit before dropping again.

Dow 30 000The VIX has never been this low, ever.
The Dow's daily trading volume has never had so many massive monthly volume bars in such a short time period, unless it was a big sell off, or dip buying after a massive recession.
The only risks are war, disease, or Trump getting impeached. This shutdown will cause a little pull back, but the trend will continue

SandP 500 E-Mini Futures 240 CME Updated 1/19/2018Price is bouncing off warning line 2, but having a problem getting abve 2807. Look to see if we can break and retest as support to continue higher.

SandP 500 E-Mini Futures 60 CME Updated 1/18/18Price is near the upper median line near 2808. Look to see if price will break higher or stay as resistance here.

SandP 500 E-Mini Futures 240 CME Updated 1/18/2018Price is now extended near warning line 3 and 2800 level. Look to see if price will continue higher from here.

SandP 500 E-Mini Futures D CME Updated 1/18/2018Price is coming up to resistance at the median line, and this sliding parallel. Look for price to bounce downward soon.

SandP 500 E-Mini Futures 60 CME Updated 12/29/2017 Price has started to rise higher after testing 2682 as support. Look to see if price can rise back into the fork to continue higher.

SandP 500 E-Mini Futures D CME Updated 12/29/2017Price is gaining momentum to the upside. Lets see if we can break 2700 and break higher to continue again towards the middle median line.

SandP 500 E-Mini Futures 240 CME Updated 12/29/2017 Price has started to rise to the upside after hitting 2682 as support. We are not at resistance at 2698 so price needs to break through with a possible retest as support to continue higher.

SandP 500 E-Mini Futures 240 CME Updated 12/28/2017 Price is consolidating at support here at 2682 level and also warning line 1. Look to see if we can bounce here from support to the upside.

SandP 500 E-Mini Futures D CME Updated 12/28/2017 Price is at possible support on the marked sliding parallel, trying to go higher. look to see if price rises from here over the next week.

SandP 500 E-Mini Futures 60 CME Updated 12/28/2017 Price has come down to 2684 and bounced. Look to see if price continues to come dwn to 2675 to find possible support.

SandP 500 E-Mini Futures 60 CME Updated 12/27/2017Price is near support at 2684. Look to see if price can gain some momentum here and try to push higher past 2698. If we drop look for 2675 and 2663 areas as support.

SandP 500 E-Mini Futures 240 CME Updated 12/26/2017Price is moving along the warning line 1 as support. Look to see if price rises from here as it is possible to try to retest 2698-2700 area.

SandP 500 E-Mini Futures D CME Updated 12/26/2017Price is extending up to the sliding parallel. We need to gain more momentum to continue to the middle median line.
