SANDUSDT: Two Scenarios 🤔According to my analysis, SANDUSDT could either retest and dip lower ( Purple Arrow ) or going back up to previous 0.618 of Fibonacci Level ( Orange Level )
Remember it all depends on Bitcoin & all other alts including SANDUSDT will follow. Always ensure to DYOR before following any ideas. Cheers & Have a Great Day Ahead 💡
Sandusdtlong

SAND/USDT 4 HOUR ANALYSISWelcome to this quick Update, everyone.
If you are reading my updates for the first time do follow me to get more complex charts in a very simplified way.
I also post altcoin setups on Spot, Margin, and Futures.
I have tried my best to bring the best possible outcome in this chart.
SAND/USDT making cup and handle pattern.
Entry: CMP
Targets: 60%TO 85%
Stop Loss: $3.78
What's your thought on this?
Do hit the like button if you like this update and share your views in the comment section.
Thank you
#PEACE

SANDUSD | A final correction before the pump Hi everyone,
I would like to show you how SAND could evolve to my own opinion based on waves analysis.
First, as we can see we probably have reached our bottom on SAND around $2.55. If you have reloaded your positions during this last correction you have made a very good decision ! However, if you haven't done so, don't worry, you will have the opportunity to place again in our wave 2 correction.
Then, we are currently on the formation of our minor wave 5 which will complete wave 1 in order to start our correction phase on our wave 2. This one should approximately reach the 0.618 Fibonacci retracement before starting the big rebound.
Next, if this scenario is validated we can turn to our $10 goal during our wave 3 but we must be patient.
Finally, a quick update on the fundamentals of The Sandbox project. The adoption of the metaverse proposed by Sébastien Borget's team is progressing steadily. Indeed, several large companies are already starting to invest in plots like Ubisoft, Carrefour or Gucci and many others. The future of The Sandbox promises to be much brighter than we had hoped.
So we remain focused and above all we remain cautious.
Let's give SAND time to validate this analysis.
If you agree with this scenario let me know with a like.
Otherwise let me know your point of view with a comment, thank you !
(This is my own hypothesis and in no way suggests a buy or sell advice.)

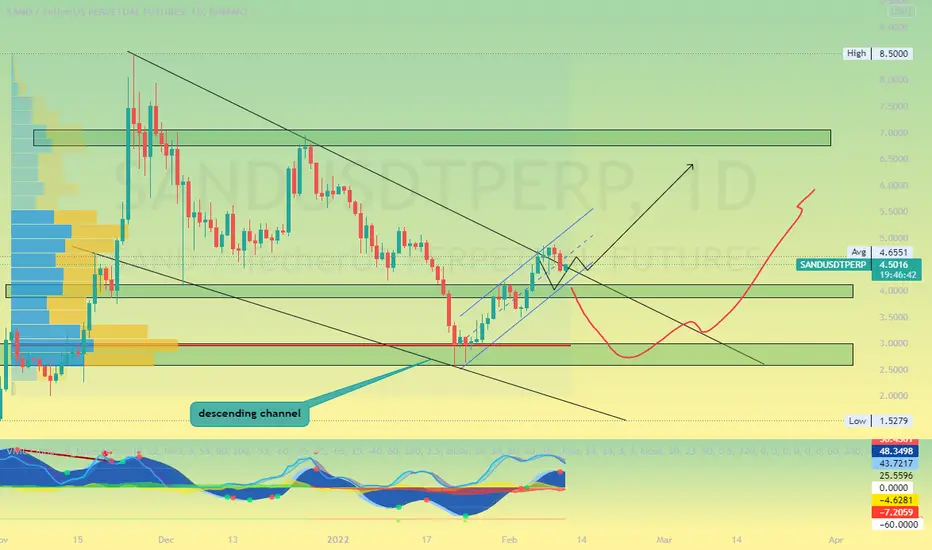
SANDUSD 2022 Buy Signal FORECAST NEXT DAYLY TREND CHARTSANDUSD 2022 Buy Signal FORECAST NEXT DAYLY TREND CHART
If you like this analysis, smash the "like button" and leave a comment below to share your thoughts
or let me know what crypto you want to see!
Trading is a reflection of yourself. Learn more daily and be ready for every opportunity.
Have a nice trading!
-My forecast and analysis are NOT trading signals nor financial advice, you should not enter trades and invest solely on this information.
SANDUSDT Harmonic Pattern FormingHello traders, SANDUSDT is breaking out! Let’s talk about the Harmonic Pattern forming.
A nice bullish momentum bar is forming on the 3HR chart. . A great sign for the Bulls.
The harmonic pattern possibly forming is a Deep Crab. That would put a target range between 5.32-5.93 for some traders.
This trend analysis is not to be taken as financial advice; always do your research.
Questions are welcome in the comments below.
Please support this idea with your like and comment, thank you 🙏

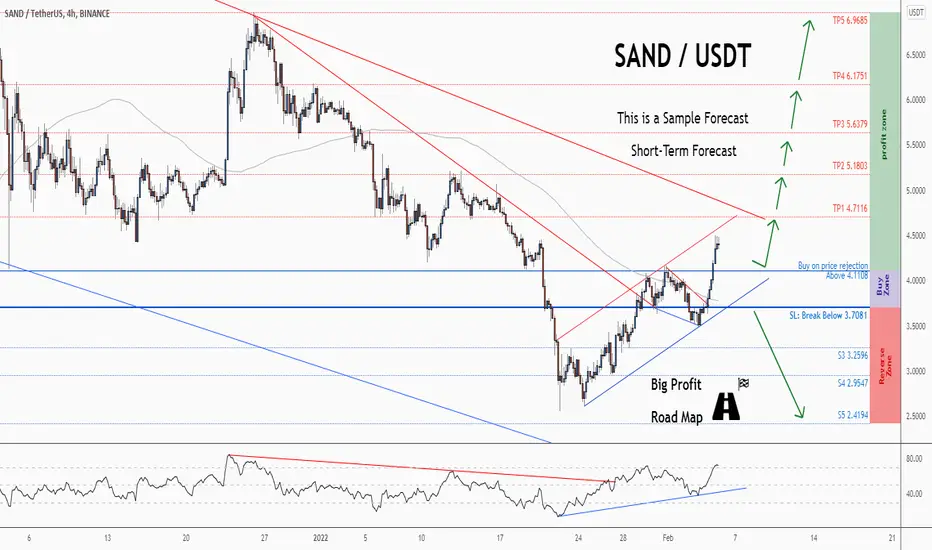
💡Don't miss the great buy opportunity in SANDUSD Trading suggestion:
". There is a possibility of temporary retracement to the suggested support line (4.1108).
. if so, traders can set orders based on Price Action and expect to reach short-term targets."
Technical analysis:
. SANDUSD is in a range bound, and the beginning of an uptrend is expected.
. The price is above the 21-Day WEMA, which acts as a dynamic support.
. The RSI is at 71.
Take Profits:
TP1= @ 4.7116
TP2= @ 5.1803
TP3= @ 5.6379
TP4= @ 6.1751
TP5= @ 6.9685
SL= Break below S2
❤️ If you find this helpful and want more FREE forecasts in TradingView
. . . . . Please show your support back,
. . . . . . . . Hit the 👍 LIKE button,
. . . . . . . . . . Drop some feedback below in the comment!
❤️ Your support is very much 🙏 appreciated!❤️
💎 Want us to help you become a better Forex / Crypto trader?
Now, It's your turn!
Be sure to leave a comment; let us know how you see this opportunity and forecast.
Trade well, ❤️
ForecastCity English Support Team ❤️
💡Don't miss the great buy opportunity in SANDUSD @TheSandboxGamTrading suggestion:
". There is a possibility of temporary retracement to the suggested support line (4.1108).
. if so, traders can set orders based on Price Action and expect to reach short-term targets."
Technical analysis:
. SANDUSD is in a range bound, and the beginning of an uptrend is expected.
. The price is above the 21-Day WEMA, which acts as a dynamic support.
. The RSI is at 71.
Take Profits:
TP1= @ 4.7116
TP2= @ 5.1803
TP3= @ 5.6379
TP4= @ 6.1751
TP5= @ 6.9685
SL= Break below S2
❤️ If you find this helpful and want more FREE forecasts in TradingView
. . . . . Please show your support back,
. . . . . . . . Hit the 👍 LIKE button,
. . . . . . . . . . Drop some feedback below in the comment!
❤️ Your support is very much 🙏 appreciated! ❤️
💎 Want us to help you become a better Forex / Crypto trader ?
Now, It's your turn !
Be sure to leave a comment; let us know how you see this opportunity and forecast.
Trade well, ❤️
ForecastCity English Support Team ❤️

$SAND 2-3x opportunityLong term (3-6 month).
Take profit 1: 8$
Take profit 2: 12$
Stop loss: 2.5$
Do your own research.

SAND/USDT 12 HOUR UPDATEWelcome to this quick SAND/USDT analysis.
I have tried my best to bring the best possible outcome to this chart.
Reason of trade:- SAND/USDT Triangle pattern create to buy the dip and green zone
Entry:- buy green zone
Traget:- 75% to 100%
Stop loss:-Greenline downside candle close
Remember:-This is not a piece of financial advice. All investment made by me is under my own risk and I am held responsible for my own profit and losses. So, do your own research before investing in this trade.
Happy trading.
Sorry for my English it is not my native language
Do hit the like button if you like it and share your charts in the comments section.

SANDUSDT Analysis (GLOBAL VISION)Hello friends.
Please support my work by clicking the LIKE button👍(If you liked).Thank you!
Everything on the chart.
Like for me globally we are in triangle wave of (iv).
While we are above our main support the price is looking up.
minimal target ~10$
main target zone 13-15$
after first target reached move ur stop to breakeven
Stop: (depending of ur risk). ALWAYS follow ur RM .
cancellation of growth, consolidation below 4$
risk is justified
Good luck everyone!
Follow me on TRADINGView, if you don't want to miss my next analysis or signals.
It's not financial advice.
Dont Forget, always make your own research before to trade my ideas!
Open to any questions and suggestions.

SANDUSDTintry price : 5.9600
stop lose : 5.5500
long tp 1: 6.4700
long tp 2: 6.9000
long tp 3 : 7.7200
risk/riward ratio : 4.35

SAND HAVE POTENTIAL TO GO 10$Hello every one
SAND/USDT
SAND is forming a Bullish Pattern which is a Ascending Triangle Uptrend Pattern Even Breakout Parallel Channel,The Pattern Hasn't Formed completely Yet, But It will Complete Eventually and That's When We Need a Break out For SAND. We can Expect a Bullish Movement from there, We can expect SAND to be at 9$ soon Which is a new all time high for It.

SAND Scalping OpportunityThis is my scalping position on Sand USDT, Sand already has broken out from falling wedge pattern, keep looking on target price, if the price break the target price, we should not close the position, let it fly

SANDUSDT, We are in sell position ...Hello everybody
According to the chart, the price is moving on upwards channel in daily time frame but in lower time frame in 4h time frame we are making a pattern price and we need to have pullback of the wave to the sell zone area then its ready to drop to reach to our target.
At first take signal then entrance in sell position and dont forget use stop loss
Our stop loss is Assumption and we should take signal to entrance then we manage our stop loss
Previous analysis :
Good Luck
Abtin

SAND flag limit shows an uptrend As we have got FTR zone at price 5, an uptrend toward $12 is targeted.

take 8% profit on SANDOur team thinks SAND growth is beyond the specified range.
Stop Loss is your best friend.

sand will growIt can grow well. Of course, market conditions are important. If bitcoin moves to suffer. This currency can grow well.

Sand is doing something GOOD!Hey guys, this is Julie 😄
Let's analyze this sweetheart today. Sand is amazing, right? To go from under $1 to $8, this is really amazing. If you (like me) couldn't take advantage of this super high, maybe this is our chance!
Although Sand has been falling since November 25, the trend is still bullish if you look at the weekly chart. In fact, it is quite normal to fall after such a big high. I believe that Sand is just resting for a while, to continue rising later.
Looking at the daily chart, we can see that today's candle seems to be forming a Bullish Harami pattern, and this is a good buy signal!
It is in the same region as before, which seems to be a support level (pink line). Below this area we have the yellow line, which was the lowest point in December 04, and almost the close on November 22, I think this could also be a resistance.
It is in the same region as the 21 EMA as well, I like to use this for buy confirmation.
Because I believe in its potential, I would really buy Sand, this seems a nice and technical point to buy.
It's such a good crypto, right? Sand has a huge potential, I really like cryptos like this, with good plans for the future.
I know someone who bought sand for less than $0.27, just because he believed in its potential (he is really happy now hahahah).
And he was right, sometimes you should buy even without confirmation, just because you believe in the project.
And that's it. Thanks a lot for reading my analysis! I hope you enjoyed it. 😊
Remember to support me with your like and subscription, I really enjoy writing these analises. 😄😉
Have a good weekend, bye bye!

Sand To the Moon Sand
Gala
Alice these are Metaverse coins and will pump soon..
Buy setup is given in chart..
Buy.
Sand/Usdt
Entry = 5.48-5.53$
Tragets
For Future
5.70$
5.78$
6.00$.
Stop Loss = 4.99$
Levrage.. 5X..
Targets for Spot.
Tragets mentioned in chart..

🔔SAND/USDT Long opportunitySAND is trying to break out, volume isn't convincing but still there is a lot of potential upward movement to be made. If we manage to break out and re-test in order to make confirmation then it shall fly or it can fly without retest. There is a GC on 1hr timeframe on MACD which allso suggest upward movement, RSI is in bullish zone.
Always manage your risk well. Don't risk more than you can afford to lose.
It is not a financial advice, I'm just sharing my personal view.

SANDUSDT SetupAs we have made a great profit so far, the third analysis of mine about metaverse projects is related to SANDUSDT. Buy some and HODL to make profit. You can take your profit whenever you want.

SAND could start a new impulse wave (5)$SAND - If this is a corrective wave (4) #sandusdt is close to an important support level ($5.08 - $4.67) - If this area holds a new impulse wave (5) could continue the trend and make a new high above $8.45. Before that, the area above $6.20 must be consistently defeated.
#SAND

SANDUSDT - Enjoy 🚀🚀🚀 (1H Signal) Follow me, its good IDEA :)
Now sand have strong downtrend, I think we will see again like a 4.20, in this moment we don't have any conformation for a long trend.
Please share your opinion in the comments :)
This is not financial advice !!!
