Bitcoin and a Critical Resistance for a Price Breakout | Day 3👋🏻 Hey everyone! Hope you’re doing great! Welcome to the SatoshiFrame channel.
✨ Today we’re diving into the 4-Hour Bitcoin analysis — stay tuned and follow along!
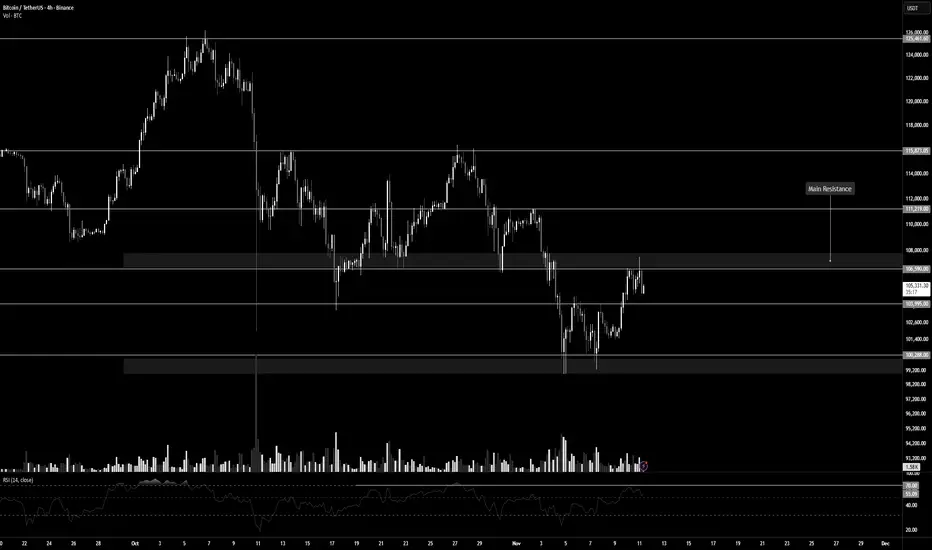
🪙 Bitcoin, in its 4-hour timeframe (as mentioned in previous analyses), is currently sitting below a major resistance level. A breakout above this area could trigger a strong bullish leg, potentially driving price toward forming a new ATH. The key resistance zone is around $106,590, and breaking it could lead to some beautiful market moves.
📊 The buying volume at this resistance is not yet sufficient. If we look closely, since the last touch of the maker-buyer zone at the lower part of the chart, volume has been declining. To break through this resistance, whale candles are needed to absorb all sell orders in the zone — this could lead to a short squeeze.
🧮 The RSI oscillator on the 4-hour timeframe has fluctuated several times below the 70 level, showing two rejections near that area. The 70 RSI level aligns with the $106,590 price resistance, and crossing above it could trigger a strong upward move.
✍️ You can read the possible scenarios for Bitcoin in the rest of the analysis, but since Bitcoin has shown reduced buying volume, it’s best to lower your risk exposure. If the breakout happens, you can reallocate remaining risk toward the next resistance levels.
✅ Long Position Scenario:
A confirmed breakout above $106,590, along with increased buying volume and the RSI surpassing 70, could form a solid long setup on the 4-hour timeframe. Make sure to gather proper confirmations before entering to ensure the best possible trade setup.
❤️ Disclaimer: This analysis is purely based on my personal opinion, and I only take trades when the stated triggers are activated.
Satoshiframe
Bitcoin Below a Key Resistance – Day 2👋🏻 Hey everyone! Hope you’re doing great! Welcome to SatoshiFrame channel.
✨ Today we’re diving into the 1-Hour BITCOIN analysis. Stay tuned and follow along!
🪙 On the 1-hour timeframe, Bitcoin is currently ranging below its key resistance zone at $106,590 in a multi-timeframe structure. A confirmed breakout above this level could potentially lead to further bullish momentum toward the next resistance area.
📊 Looking at Bitcoin’s volume, we can see that as price reached this crucial resistance, volume has decreased, showing more selling interest among traders. However, the interesting observation here is that even selling volume itself has slightly declined, and during the latest reaction to this resistance (in the 15-minute multi-timeframe), we witnessed an increase in buying volume.
✍️ The possible breakout scenario for this resistance is quite simple and comes with a small stop-loss range. You can consider entering a trade based on this scenario, but always remember proper risk and capital management.
↗️ Long Position Scenario 1 : Breakout above the $106,590 resistance accompanied by increasing buying volume on either the 1-hour or 15-minute multi-timeframe. If we get a candle setup (Indecision + SMA7) before and after the breakout, it can serve as a valid entry signal.
↗️ Long Position Scenario 2 : Breakout above the $106,590 resistance with rising volume and the formation of a higher low on the multi-timeframe compared to the previous low. In this case, we can enter a long position and set the stop-loss below the potential higher low.
❤️ Disclaimer : This analysis is purely based on my personal opinion and I only trade if the stated triggers are activated .

Bitcoin at a Decision Zone – Day 1👋🏻 Hey everyone! Hope you’re doing great! Welcome to SatoshiFrame channel.
✨ Today we’re diving into the 1-Hour BITCOIN analysis. Stay tuned and follow along!
🪙 Bitcoin on its one-hour timeframe is currently within a trading range, and due to the holidays, both volume and volatility have dropped to their lowest levels. According to the analysis, an important resistance has formed around $103,912, and a micro buyer support around $100,288. Once either of these zones is broken, Bitcoin could provide a trading opportunity.
📊 Bitcoin’s volume on the one-hour timeframe has now reached its lowest level, indicating that we are close to a potential move. This suggests possible upcoming volatility. As for the micro buyer floor, this level is crucial for buyers — when price reaches it, buying volume typically increases. To break this zone, it would require significant selling volume and large whale candles to overcome the long-biased traders.
🧮 My favorite oscillator, RSI, is also ranging between 30 and 70, which nicely overlaps with the identified support and resistance levels. A breakout from these RSI limits can confirm our risk level and validate potential trade entries.
✍️ You can read the possible scenarios for this trading range below. If needed, set your alert zones and use them accordingly. Don’t forget proper risk and capital management.
↗️ Long Position Scenario: A breakout above $103,912, accompanied by an increase in buying volume, would validate a potential long setup. This volume increase should also align with the oscillator, meaning RSI should break above 70 on the 1-hour or 15-minute multi-timeframe chart, along with increased market volatility.
📉 Short Position Scenario: A breakdown below the micro buyer floor at $100,288, with selling pressure and RSI falling below 30, could confirm a short position. However, it’s recommended to wait for a pullback after the breakout before entering the trade.
❤️ Disclaimer : This analysis is purely based on my personal opinion and I only trade if the stated triggers are activated .

Bitcoin in a 4H Range: Critical Levels and Trade Scenarios Ahead👋🏻 Hey everyone! Hope you’re doing great! Welcome to SatoshiFrame channel.
✨ Today we’re diving into the 1-Day Bitcoin Dominance analysis. Stay tuned and follow along!
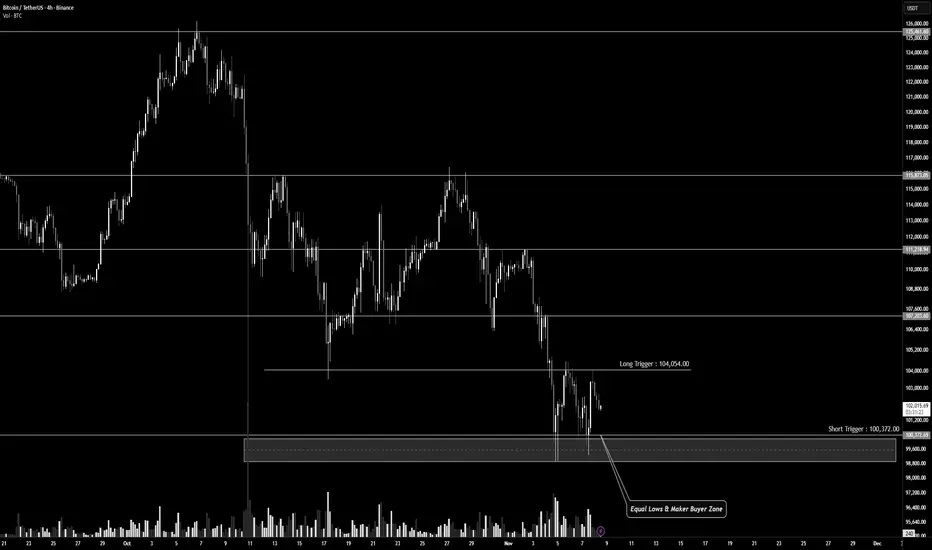
🪙 On the 4-hour timeframe, Bitcoin is currently moving within a clear trading range.
The highs and lows in lower timeframes are nearly equal, providing solid trigger zones for potential trades.
The range resistance is around $104,054, while the range support lies near $100,372, which can be considered a micro buyer zone.
💰 During Bitcoin’s first upward move, the volume increased, indicating an attempt to shift momentum bullishly.
However, after forming a lower high, buyers experienced FOMO but failed to push the price further up.
A pullback then occurred toward the support zone at $100,372, where another equal low was formed.
As price moved upward again, buying volume decreased, showing weakening buyer strength, and the move concluded with a blow-off 4H candle near the previous top.
✍️ Below are the potential trading scenarios for Bitcoin.
Review them and align with your own strategy and risk management before taking positions.
↗️ Long Position Scenario
A breakout above the resistance zone (the 4H trend-change area) around $104,054, followed by the formation of a higher low on that level, could provide a solid long setup.
Ensure this move is confirmed by increasing volume and buying pressure convergence for a higher win rate.
📉 Short Position Scenario
A breakdown below the support zone (two equal lows and a key weekly/daily support) around $100,372, combined with the formation of a lower high below that zone and strong selling pressure, could offer a short opportunity.
Watch out for large whale candles — it’s best to wait for confirmation before entering.
❤️ Disclaimer : This analysis is purely based on my personal opinion and I only trade if the stated triggers are activated .
Bitcoin Dominance Rejection and Altcoin Pump👋🏻 Hey everyone! Hope you’re doing great! Welcome to SatoshiFrame channel.
✨ Today we’re diving into the 1-Day Bitcoin Dominance analysis. Stay tuned and follow along!
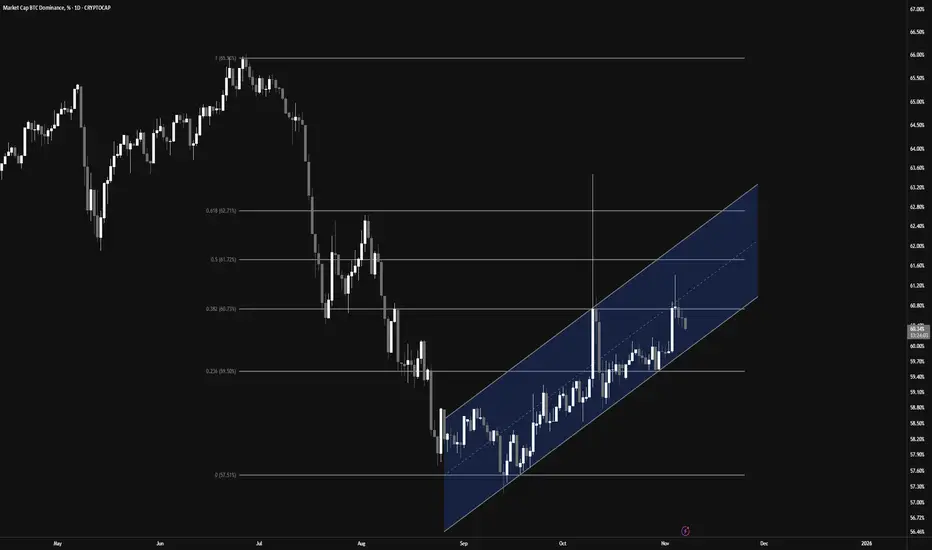
👀 On the daily timeframe, Bitcoin dominance has reached a key resistance zone at 60.73%. If this level breaks, we could see a deeper correction across altcoins. However, a rejection and move downward could trigger a strong rally for altcoins. As Bitcoin’s market weight decreases and capital flows into altcoins, we might be entering an early altseason, presenting potential profit opportunities.
🕯 From a technical perspective, Bitcoin dominance is moving within a well-structured ascending channel. The midline of the channel acts as a solid rejection point. A Fibonacci retracement from the previous downtrend shows a 38% overlap with this midline — a tough level to break. After a strong bearish candle rejection from that area, dominance is now heading lower. If the move continues, we could see a test of the channel’s lower boundary, and a confirmed breakdown would strengthen the altcoin bullish scenario.
💰 Typically, capital rotation in crypto follows this pattern: money flows into Bitcoin, then Ethereum, then the top 10 coins, and finally into smaller altcoins — before converting to USDT and exiting the market. With Bitcoin dominance currently at high levels after a solid Bitcoin season, this could signal the early stages of capital shifting toward altcoins. Traders should watch closely for these shifts to maximize profitability.
❤️ Disclaimer : This analysis is purely based on my personal opinion and I only trade if the stated triggers are activated .
Break of Support or Multi-Timeframe Trend Reversal ?👋🏻 Hey everyone! Hope you’re doing great! Welcome to SatoshiFrame channel.
✨ Today we’re diving into the 15-Mimutes Bitcoin analysis. Stay tuned and follow along!
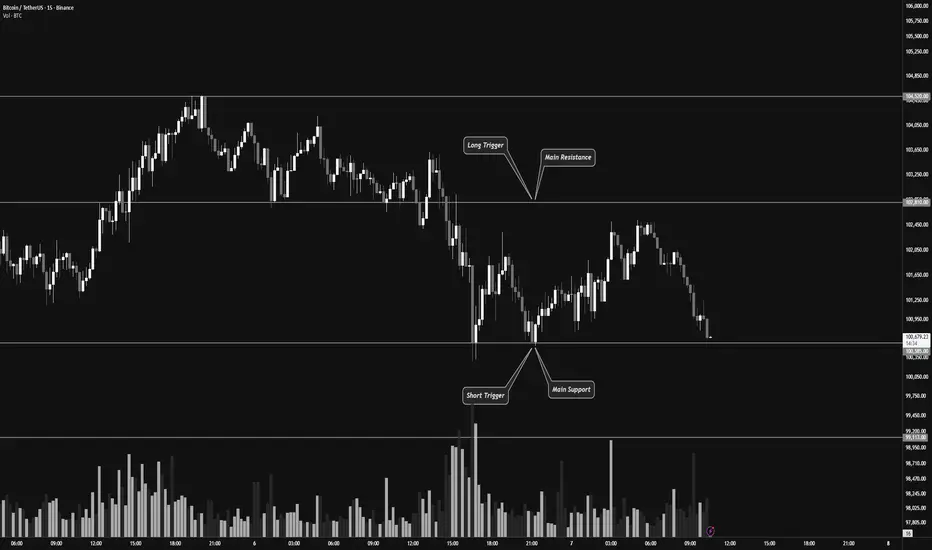
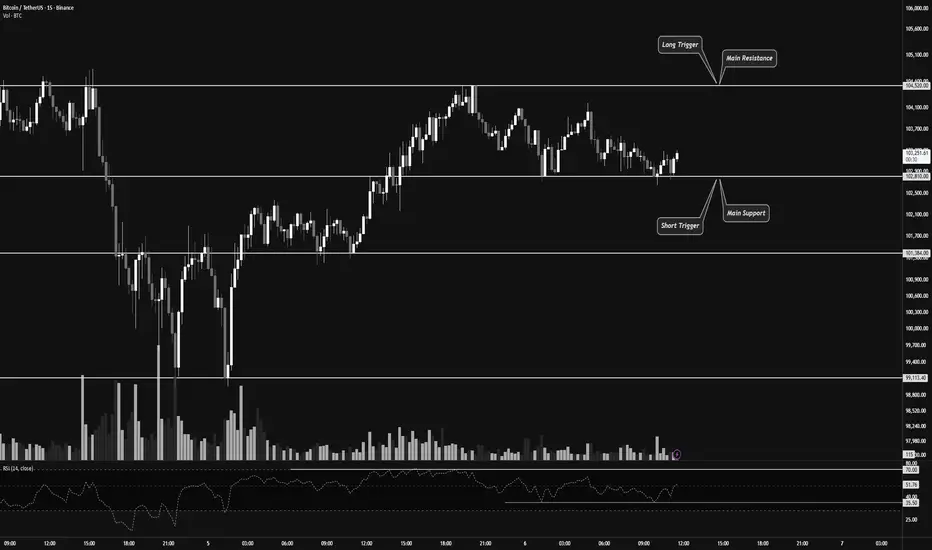
👀 On the 15-minute timeframe for Bitcoin, we can see that after breaking a multi-timeframe support, Bitcoin is currently testing its support zone around $100,585.
If this zone breaks, Bitcoin could continue its downward move and experience further decline.
However, if it moves upward and breaks the resistance zone around $102,810, it could trigger a potential trend reversal.
🕯 Pay attention to Bitcoin’s volume — the volume indicator currently shows an increase in selling pressure, suggesting that we might see a short-term volume consolidation before the price continues downward again.
✍️ The current scenarios for Bitcoin include both long and short setups, which you can use to plan your trades based on how the market reacts.
🟢 Long Position Scenario : A break above the $102,810 resistance zone, accompanied by increasing buy volume and bullish momentum, could signal a good long opportunity toward higher levels.
🟥 Short Position Scenario : A break below the $100,585 support zone, along with increasing sell pressure turning into strong selling momentum, could offer a short opportunity in line with the current trend.
❤️ Disclaimer : This analysis is purely based on my personal opinion and I only trade if the stated triggers are activated .
Wider Range or Early Trend Reversal in Multi-Timeframe?👋🏻 Hey everyone! Hope you’re doing great! Welcome to SatoshiFrame channel.
✨ Today we’re diving into the 15-Mimutes Bitcoin analysis. Stay tuned and follow along!
👀 On the 15-minute timeframe of Bitcoin, we can see that after recent declines, BTC has entered a 15-minute trading range. The top and bottom of this range act as our long and short triggers. Keep in mind that Bitcoin’s next move could potentially develop into a long-term directional move.
🧮 Looking at the RSI oscillator, the 70 level serves as confirmation for a long trigger, while the 35.5 level confirms a short trigger. Note that RSI confirmation based on its momentum swings can provide higher-quality trade setups.
🕯 Selling volume has increased slightly as Bitcoin approaches its resistance zone at $104,520, and we’ve seen a similar reaction when price hits resistance from below. This indicates buyer hesitation and stronger seller activity.
Meanwhile, buying volume has risen as price nears the support zone around $102,810. If this buying pressure continues, it could confirm an extended range formation in this area.
✍️ As in previous setups, Bitcoin’s potential scenarios remain straightforward. With proper RSI confirmation, we can look for entry opportunities.
🟢 Long Scenario : A breakout above the $104,520 resistance zone, accompanied by increasing buying volume and RSI exceeding the 70 level on the 15-minute multi-timeframe, could signal a long trade.
🟥 Short Scenario : A breakdown below the $102,810 support zone, with rising selling volume and RSI dropping below the 35.5 level, could trigger a short trade.
❤️ Disclaimer : This analysis is purely based on my personal opinion and I only trade if the stated triggers are activated .
Bitcoin’s price is at one of its most critical moments yet!👋🏻 Hey everyone! Hope you’re doing great! Welcome to SatoshiFrame channel.
✨ Today we’re diving into the 4-Hour Bitcoin analysis. Stay tuned and follow along!
👀 On the 1-hour timeframe of Bitcoin, we can observe that after failing to break above its key resistance zone, BTC moved toward the multi-timeframe lows. Losing those lows created a selling pressure, pushing the price to retest its fundamental support levels. Currently, I’ve identified two critical zones in my analysis — a breakout from either one could provide a solid trading opportunity.
⌛ Bitcoin’s volume shows a strong bias toward sell positions, to the point where buyers are barely preventing the higher timeframes from entering oversold conditions. However, if this selling pressure and volume persist, Bitcoin could break the lower boundary of its recent daily range and continue downward. Volume data gives us the best insight into market behavior, allowing us to build effective scenarios.
✍️ There are two potential scenarios for Bitcoin that I’ll briefly summarize below — both can be used as setups for positioning.
🟢 Long Scenario: If Bitcoin breaks above the resistance zone at $108,072, completes a pullback, and shows an increase in buying volume with momentum entering the market, we can open a long position. This setup looks somewhat risky, so it’s better to enter with a smaller position size. The best trigger for a long entry is located around $111,180.
🔴 Short Scenario: If Bitcoin breaks below the key support level at $105,732, it could offer a short position setup — provided that selling pressure and bearish momentum continue. After the breakdown, we’ll need to wait for a pullback before entering the trade.
❤️ Disclaimer : This analysis is purely based on my personal opinion and I only trade if the stated triggers are activated .

Major Breakout Setup Forming on Bitcoin’s 1-Hour Chart👋🏻 Hey everyone! Hope you’re doing great! Welcome to SatoshiFrame channel.
✨ Today we’re diving into the 1-Hour Bitcoin analysis. Stay tuned and follow along!
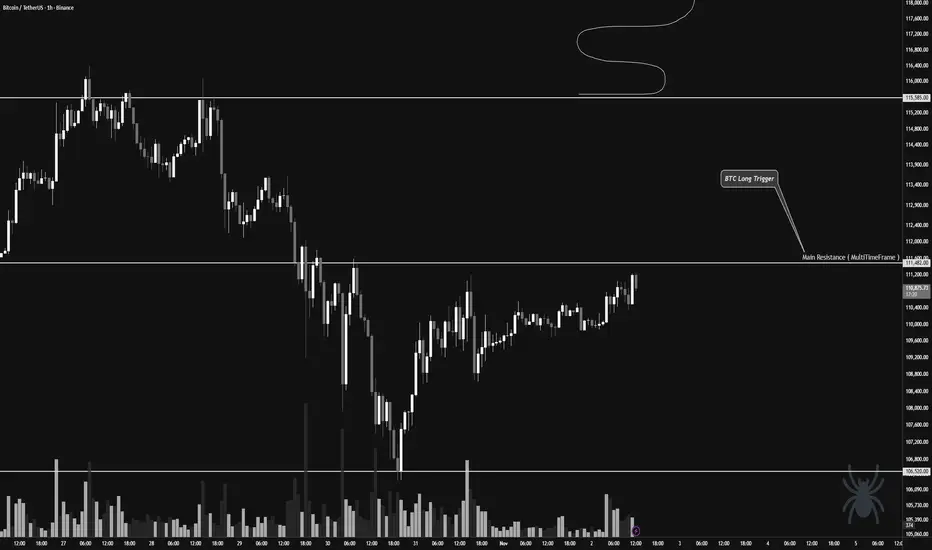
👀 On Bitcoin’s 1-hour timeframe, we can see that Bitcoin has built a multi-timeframe accumulation zone as the weekend began. It has now successfully broken above the top of this range, but we have a notable resistance area to keep an eye on.
The $111,482 price zone is a strong resistance level, and when price reached this zone, it faced heavy rejection and selling pressure. This area could provide the best trigger for a breakout. If Bitcoin manages to break above it, we could see a strong bullish leg and further upside momentum.
🧲 Bitcoin’s trading volume has slightly decreased over the past few days, so we’re waiting for volume expansion during the New York session to see what kind of reaction we get — this will guide our trade setup. Since there’s also a meeting between the U.S. and Chinese presidents tomorrow, we might prepare a speculative position ahead of that event to capture potential volatility and profits.
My current bias on Bitcoin remains bullish, as the trend hasn’t broken any significant support levels yet.
💵 Meanwhile, Tether Dominance (USDT.D) has reacted three times to its upper resistance zone on higher timeframes but failed to break above it. This suggests a bullish outlook for the crypto market, as a rejection in Tether Dominance could lead to downside movement there — fueling a strong bullish leg across the market.
✍️ The main long setup will trigger on a break above the $111,482 resistance zone. Confirmation can be taken from RSI oscillator signals and increasing buying volume.
We can open this low-risk long position (around 0.5% risk), and if tomorrow’s session brings clear bullish triggers, we can add to the position for larger exposure.
❤️ Disclaimer : This analysis is purely based on my personal opinion and I only trade if the stated triggers are activated .
Has Bitcoin entered the distribution phase yet?👋🏻 Hey everyone! Hope you’re doing great! Welcome to SatoshiFrame channel.
✨ Today we’re diving into the 4-Hour Bitcoin analysis. Stay tuned and follow along!
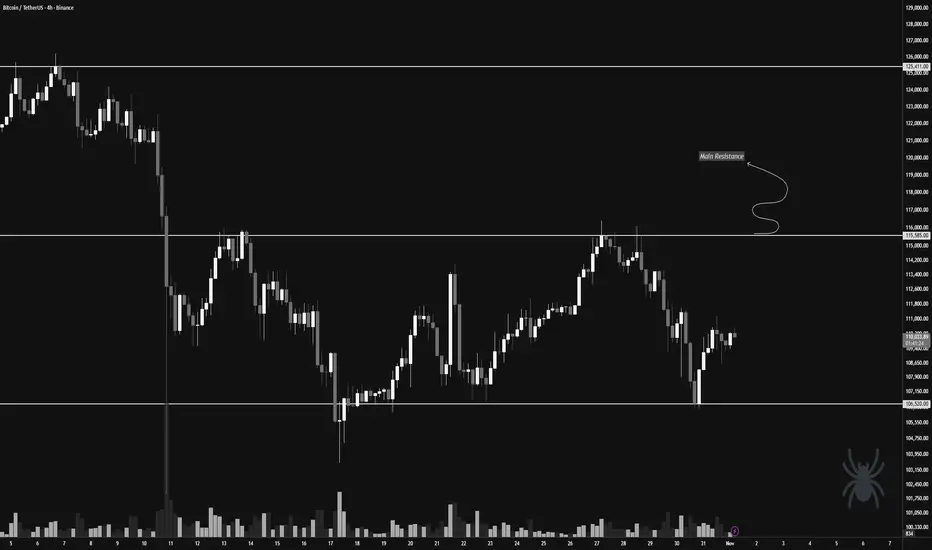
👀 On the 4-hour timeframe, we can see that Bitcoin recently dropped due to the impact of the FOMC news but then rebounded from the key support level at $106,520 and is now facing its multi-timeframe resistances. Looking at the chart more broadly, we notice equal highs and lows around the $115,585 and $106,520 zones. With a breakout of either of these levels, Bitcoin could experience a sharp and significant move.
🧲 Bitcoin’s selling volume has slightly increased, and if the supports break, this selling could turn into pressure — collectively applying downward force on the market price. Then, buyers may re-enter and start buying Bitcoin again. The hypothesis of a possible distribution phase could turn into a valid theory; however, we must be cautious — if Bitcoin decides to move upward after Monday’s session, it could confirm a new all-time high and continue its upward trend.
✍️ The main scenario for Bitcoin lies around the $115,585 price zone. If this level breaks, we could enter a long position and stay with it for a potentially extended upward move. It’s worth noting that an increase in buying volume along this path could serve as a strong confirmation for our long position.
On the other hand, the short position scenario would become valid if the price breaks below the support and selling pressure intensifies, giving us a high-momentum short setup.
❤️ Disclaimer : This analysis is purely based on my personal opinion and I only trade if the stated triggers are activated .
Bitcoin Breakout or a Deeper Rest Ahead ?👋🏻 Hey everyone! Hope you’re doing great! Welcome to SatoshiFrame channel.
✨ Today we’re diving into the 4-Hour Bitcoin analysis. Stay tuned and follow along!
👀 We’re looking at Bitcoin on the 4-hour timeframe. Bitcoin is currently in a bullish correction and awaiting tomorrow’s news. It’s worth noting that this upward correction is happening below the key resistance level at $115,555. A breakout above this zone could allow Bitcoin to continue the bullish leg it has already started.
🧮 Looking at the RSI oscillator, Bitcoin’s momentum previously entered the overbought area but has now exited and is oscillating below the 70 zone, which now acts as the current resistance level.
✔️ Let’s pay closer attention to Bitcoin’s trading volume — as price approached its major resistance, volume increased. However, given the upcoming news, this wasn’t enough to break resistance, and Bitcoin was rejected from that zone, pulling slightly downward. This downward move isn’t very strong and is accompanied by weak corrective momentum.
✍️ The current Bitcoin scenarios have been updated — you can now focus more closely on these scenarios in the next part of the analysis.
🟢 Long position scenario: A breakout above the key resistance level at $115,555, combined with rising buy volume and an RSI swing above the 70 zone, could mark the end of the correction and continuation of the bullish move.
❤️ Disclaimer : This analysis is purely based on my personal opinion and I only trade if the stated triggers are activated .

USDT Dominance Breakdown and Market Rally !!!👋🏻 Hey everyone! Hope you’re doing great! Welcome to SatoshiFrame channel.
✨ Today we’re diving into the 4-Hour USDT.D analysis. Stay tuned and follow along.
👀 On the 4-hour timeframe, USDT dominance was rejected downward as it approached its seller-taker zone. With heavy USDT selling, it lost its key support at 4.89%, giving us a confirmation signal for long positions. USDT dominance is now sitting on a key support at 4.74%, with another close support at 4.61%. If these two key levels are broken, the prices of coins can become significantly more expensive.
🔍 Which support zone currently acts as the key one? The 4.74% level can create a short-term pullback in the market, but if you look closely, it has not yet shown any sign of weakening the downtrend or stopping the heavy USDT sell-off. Sellers are not interested in holding USDT in their wallets, and over the past weeks, we have also seen large USDT minting from the issuing company.
Regarding the 4.61% level: breaking this zone will likely require a whale liquidation move, clearing many short positions and large sell orders, which could then trigger a price rally.
🧮 On the 4-hour timeframe, the RSI oscillator is currently in the OverSell zone. Since we cannot rely only on this, we look at the daily timeframe. On the daily chart, USDT dominance is pushing below the 50 level, indicating continued broad selling pressure of USDT — a behavior usually aligned with breakouts in the crypto market.
⁉️ So what information is USDT dominance giving us now? If we observe dominance behavior on the 4-hour chart and compare it with the daily structure, we can identify the beginning of a strong bullish leg in the market, where the prerequisites are the breakdown of the multi-timeframe support zones mentioned in the first paragraph.
❤️ Disclaimer : This analysis is purely based on my personal opinion and I only trade if the stated triggers are activated .

Second Leg Incoming? Ethereum Needs Volume.👋🏻 Hey everyone! Hope you’re doing great! Welcome to SatoshiFrame channel.
✨ Today we’re diving into the 4-Hour Ethereum analysis. Stay tuned and follow along.
👀 Looking at Ethereum on the 4-hour timeframe, we can see that just like Bitcoin, Ethereum began a strong bullish leg yesterday, breaking several of its multi-timeframe resistances. With this price jump, it has now reached its resistance area at $4,252. Keep in mind that the market may take a short rest at this level, and price may experience a brief pullback to the downside.
🧮 The RSI oscillator is currently exiting the OverBuy zone, which is a sign that a multi-timeframe correction may begin for Ethereum.
🕯 During this bullish leg, Ethereum’s volume has increased slightly. However, since sell orders have been lower than before, this volume increase does not appear very strong on the 4-hour chart. Therefore, if Ethereum intends to form its second bullish leg upward, we will likely need to see a more noticeable increase in buying volume.
✍️ The scenario ahead for Ethereum, like Bitcoin, is independent of any trade or position, and it simply helps us better understand Ethereum’s corrective price behavior.
🛡 Ethereum, similar to Bitcoin, is entering a price resting phase. This rest can extend down toward support levels, and if a stronger bullish continuation wants to form, we may see a reversal reaction near these zones. If such a move occurs, the analysis and scenarios will be updated for you.
❤️ Disclaimer : This analysis is purely based on my personal opinion and I only trade if the stated triggers are activated .

Will Bitcoin on 4H Push Higher or Take a Breath? | BTC 11👋🏻 Hey everyone! Hope you’re doing great! Welcome to SatoshiFrame channel.
✨ Today we’re diving into the 4-Hour Bitcoin analysis. Stay tuned and follow along!
👀 Looking at Bitcoin on the 4-hour timeframe, we can see that after breaking its multi-timeframe resistances, it is currently located near the price resistance of $115,793. If Bitcoin breaks this area, it can move toward its next resistance at $121,000.
🧮 Observing the RSI oscillator, we can see that it is currently in its OverBuy zone, and the important point here is to wait for it to exit the overbought area and form a new oscillation structure.
🎇 Pay attention to Bitcoin’s volume, which has been increasing up to this point. Even as it reaches the current resistance, buying volume is still rising and buyers are trying to push prices higher. But since there’s potential for selling pressure, we wait for volume to decrease a bit and allow the market to rest.
✍️ The scenario ahead for Bitcoin is independent of any trade or position, but we can use it to better understand Bitcoin’s corrective or resting behavior.
🛡 Bitcoin has just experienced a beautiful bullish leg across multi-timeframes, and the effects of this upward wave have also extended into higher timeframes such as the 4-hour and daily charts. Price, in a multi-timeframe structure, now requires a short-term correction and a pullback to fill lower buy orders. Keep in mind that traders typically take profit in such zones.
❤️ Disclaimer : This analysis is purely based on my personal opinion and I only trade if the stated triggers are activated .

Ethereum weakened or holding structure? | ETH 1H Analysis👋🏻 Hey everyone! Hope you’re doing great! Welcome to SatoshiFrame channel.
✨ Today we’re diving into the 1-Hour Ethereum analysis. Stay tuned and follow along.
👀 We observe Ethereum on the 1-hour timeframe. After breaking and stabilizing at the $3,889 zone, Ethereum formed a higher low on this area and is now moving along a trendline (dynamic support), with an important static resistance at $3,982.50. Price has reacted to this level once but has not succeeded in breaking it!!!
🧮 Using the RSI oscillator is a reasonable approach in this situation. Since Ethereum is currently in a box/trading range, a breakout requires entering overbuy territory and surpassing the 70 level. Note that there is a significant oscillation support below the average, at the 44.5 zone, which holds strong validity and represents our swing low.
🐷 Pay attention to Ethereum’s volume. To break the specified zone, Ethereum needs to show a strong reaction, fill sell orders, and liquidate futures contracts. Therefore, we need buyer market makers to support the breakout, causing volume to increase through a price jump.
✍️ The scenario forming for Ethereum may require some patience and could play out differently, because we are now facing the second touch of this level, so the win rate of this scenario may be slightly lower.
🟢 Long Position Scenario
Breaking Ethereum’s resistance at $3,982.50 along with surpassing the 70 RSI level and seeing a significant increase in buying volume and price squeeze can form a good long position scenario on Ethereum.
❤️ Disclaimer : This analysis is purely based on my personal opinion and I only trade if the stated triggers are activated .

Bitcoin is now positioned below its main resistance! | Day 10👋🏻 Hey everyone! Hope you’re doing great! Welcome to SatoshiFrame channel.
✨ Today we’re diving into the 1-Hour Bitcoin analysis. Stay tuned and follow along!
👀 Bitcoin has still not succeeded in breaking the resistance zone at $111,458. However, Bitcoin formed a higher low compared to its previous low, which increases the probability of breaking this resistance and gives it a higher win rate for a breakout.
🧮 Pay attention to the RSI oscillator. The 70 zone has maintained its overlap with Bitcoin just like yesterday, with the difference that the RSI support zone is now in the 45 range, which also overlaps with the newly formed higher low.
💰 Bitcoin’s volume in the 1-hour time frame has increased after forming a higher low, meaning this low is being respected by buyers, and the desire to break multi-timeframe resistances has increased. Breaking the current resistance zone requires strong buying volume so that sell orders are filled and some futures orders get liquidated.
✍️ The expected scenario for Bitcoin does not differ significantly from yesterday’s scenario.
🟢 Long Position Scenario
Break the key resistance at $111,458, surpass the 70 level on RSI and enter overbuy territory, accompanied by increased buying volume and a price squeeze.
❤️ Disclaimer : This analysis is purely based on my personal opinion and I only trade if the stated triggers are activated .

Can BTC Break $111,458 resistance ? - BTC 1H Analysis | Day 9👋🏻 Hey everyone! Hope you’re doing great! Welcome to SatoshiFrame channel.
✨ Today we’re diving into the 1-Hour Bitcoin analysis. Stay tuned and follow along!
👀 On the 1-hour timeframe, we see that Bitcoin is currently below its resistance zone at $111,458. If this level is broken, Bitcoin can move upward toward its next resistance levels.
🧮 The RSI oscillator is currently below the static resistance near level 70, which overlaps with the $111,458 resistance. If the RSI breaks above this zone, Bitcoin can enter overbought territory, making it easier to move toward the next resistance.
🕯 Looking at Bitcoin’s volume, we can see that volume has decreased, and this decline is clearly visible. With the first increase in buying or selling volume, Bitcoin can begin its next move with stronger momentum and potentially cause a price spike.
💵 Today we will also take a look at USDT dominance. The 4.91% support level on USDT dominance overlaps with Bitcoin’s current resistance. If this level is broken, Bitcoin can start its move upward with strong confirmation.
✍️ A complete and clear scenario is now formed for a Bitcoin position, which you can use for your trades in the continuation of this analysis.
🟢 Scenario for Bitcoin resistance breakout 👇🏻
If Bitcoin breaks the $111,458 price level along with RSI crossing above 70 and an increase in buying volume, it can move toward higher price levels.
For this scenario, we also need confirmation from USDT dominance, meaning a break below the 4.91% support zone.
❤️ Disclaimer : This analysis is purely based on my personal opinion and I only trade if the stated triggers are activated .

BTC 4H Analysis | Day 8🥳 Hey everyone! Hope you’re doing great! Welcome to SatoshiFrame channel.
✨ Today we’re diving into the 1-Hour Bitcoin analysis. Stay tuned and follow along!
👀 On Bitcoin’s 4-hour time frame, as shown in the chart, we can see that after a series of declines, Bitcoin has consolidated inside a large 4H range (box). This box has been classified by traders and is currently being “priced in” for the market’s next move. For now, price is still some distance from the top of the box, but the mid-range area, where price is currently hovering, could be a good zone for a potential long setup.
⛏ Multi time frame levels (1H and 15M) have already triggered signals for traders, and price is now moving toward $111,144. A breakout above this level could confirm a long entry. However, breaking this resistance may be challenging and could have a lower win rate, so we’ll use a more conservative risk approach for this move.
🧮 Looking at the RSI oscillator, it’s forming a short-term oscillating resistance near the overbought zone. The 65 level aligns beautifully with the $111,144 price resistance, meaning if RSI breaks above this threshold, that resistance could be taken out, allowing momentum to push further into the overbought region.
🕯 Bitcoin’s volume over the past few days has been strong enough to support powerful moves, but the activity has been mostly indecisive, aimed at liquidity collection within the range. If you pay close attention, you’ll notice extremely precise triggers forming at the box’s highs and lows. In short, large amounts of capital that are expected to exit gold are still in a phase of indecision, and Bitcoin hasn’t yet absorbed that risk capital.
🧠 I’m considering two main scenarios for Bitcoin’s position:
🟢 Scenario 1
Breakout above the $111,144 resistance, accompanied by RSI crossing above 65 and a noticeable increase in buy volume, signaling intent for a Bitcoin pump.
🟢 Scenario 2
Set a buy stop with a larger stop size, staying positioned for a gradual breakout. As Bitcoin breaks higher levels, we can scale in with additional volume.
❤️ Disclaimer : This analysis is purely based on my personal opinion and I only trade if the stated triggers are activated .

BTC 1H Analysis | Day 7🥳 Hey everyone! Hope you’re doing great! Welcome to SatoshiFrame channel.
✨ Today we’re diving into the 1-Hour Bitcoin analysis. Stay tuned and follow along!
👀 On the one-hour timeframe of Bitcoin, we can see that after last night’s pump, Bitcoin failed to break through the resistance zone at $113,400 and was rejected downward from this area. It’s currently sitting at its support floor around $107,537, and losing this level could lead to a further decline.
🧮 The RSI oscillator has now formed two important zones — 50 and 38 — and when the fluctuation limit crosses these zones, Bitcoin may start its next move with increased volatility.
🕯 Last night, Bitcoin had good buying volume while approaching its resistance, but the key point was that it was then pushed down sharply by heavy selling pressure, losing even its multi–timeframe support floors. Keep in mind that Bitcoin needs an increase in buying or selling volume to break through these identified levels.
🧠 I’ve explained the upcoming Bitcoin scenarios in the following paragraph.
🟢 Long Position Scenario: A breakout of the nearest resistance zone at $109,383, along with the RSI crossing above the 50 level and buying pressure strong enough to absorb all the sell orders in this area.
🔴 Short Position Scenario: The current level Bitcoin is sitting at is a very critical support. Losing this support at $107,537, combined with the RSI dropping below 38 and increased selling pressure, could trigger a continued downward move, pushing Bitcoin toward its lower support zones.
❤️ Disclaimer : This analysis is purely based on my personal opinion and I only trade if the stated triggers are activated .

BTC 1H Analysis | Day 6🥳 Hey everyone! Hope you’re doing great! Welcome to SatoshiFrame channel.
✨ Today we’re diving into the 1-Hour Bitcoin analysis. Stay tuned and follow along!
👀 After faking the 111377$ resistance area, Bitcoin ran its stop-hunts and then moved toward its supports. In the process, after breaking the 109383$ support, it headed toward its current support in the 107508$ price area.
🔍 The exhaustion of buyers’ strength and the unusual participation of TakerSeller at the 111377$ price caused selling pressure on Bitcoin, making sellers the winners from that area. Bitcoin is now near its support, and the next resistances are at 109383$ and 111377$. With a break of these zones, it can move further upward.
🧮 On the RSI oscillator, we see that after losing the 50 zone, it moved strongly toward the oversell area and stayed there for a very short time—so short that we can call it a fakeout—and it formed a low near the 30 area. Now, losing the 30 zone and entering Oversell can be a confirmation for more selling pressure. The RSI resistance zone is at 50, and once the oscillation range passes above this zone, long-side momentum increases.
🕯 We’re going to check volume to understand better and get more data. After approaching its resistance, Bitcoin was accompanied by a decrease in buy volume, and subsequently sellers took control of the market; with increasing sell volume, Bitcoin’s price moved downward.
🧠 For a Bitcoin position we have 2 scenarios on the table that, if they occur, we can evaluate a position.
🟢 Long scenario: Break of the 109383$ resistance area and the oscillation limit crossing above the RSI 50 zone, together with increasing buy volume, with maker buyers also participating in this scenario for a price jump.
🔴 Short scenario: Break of the current support along with more selling pressure on Bitcoin, losing the 30 oscillation zone and RSI entering the oversell area.
❤️ Disclaimer : This analysis is purely based on my personal opinion and I only trade if the stated triggers are activated .

ETH 4H Analysis | Day 4🥳 Hey everyone! Hope you’re doing great! Welcome to SatoshiFrame channel .
✨ Today we’re diving into the 4-Hour Ethereum analysis. Stay tuned and follow along!
👀 Ethereum, the best and largest altcoin in our market, has also broken its descending trendline just like Bitcoin, and the long position scenario we discussed earlier has pretty much played out — I hope you took advantage of it.
🔍 After breaking through its previous resistances, Ethereum is now facing a new resistance area where some sellers have stepped in and some buyers are taking profits. There’s a possibility of a short-term pause in price movement. This zone has created a trigger for us, and the next, more logical long triggers for Ethereum are at $4,252 and $4,723. A breakout above these levels could kick off a strong upward move.
🧮 Looking at the RSI oscillator, it’s approaching the 70 zone but has been rejected near that level. For a confirmed breakout above $4,078, RSI needs to enter the overbought region. There’s also a support zone around 50, which could act as a rebound area for oscillatory movement. Right now, RSI has two key zones — 50 and 70 — that define its structure.
🕯 Notice the Ethereum volume behavior: to break through both static and dynamic resistance zones, the volume increased — this happened because a large number of sell orders were stacked in that area, and those orders needed to be filled before price could move upward smoothly. After that breakout, buying volume started to decline slightly, meaning both price and volume are now resting. For Ethereum to break this resistance zone, we either need sell orders to be absorbed or short positions to get squeezed by trapped traders.
🧠 We can outline a few possible scenarios for Ethereum’s position — some of them might be slightly more complex to manage:
🟢 Long Position Scenario 1
We need patience and a price cooldown. Wait for Ethereum to touch its nearest support zone, then rise with increasing volume. If during this move we see setup candles along with a resistance breakout, we can enter the position with a tight stop size.
🟢 Long Position Scenario 2
We can use an order-book stop-buy setup at Ethereum’s resistance and place a wider stop to catch any breakout spike. This allows participation in a potential price surge and can yield solid profit — though these setups usually take longer to reach an ideal risk-to-reward ratio.
🟢 Long Position Scenario 3
This one’s less likely but still worth noting: Ethereum could break its resistance with rising volume, then pull back to retest that same resistance (now turned support). Afterward, if we see volume increase, setup candles, and a confirmed pullback breakout, we can enter with a small stop size.
🔴 Short Position Scenario
A short setup would only make sense if the micro-buyer zone fails, accompanied by heavy whale candles, strong selling pressure, and an overall market crash.
❤️ Disclaimer : This analysis is purely based on my personal opinion and I only trade if the stated triggers are activated .

BTC 4H Analysis | Day 5🥳 Hey everyone! Hope you’re doing great! Welcome to SatoshiFrame channel .
✨ Today we’re diving into the 4-Hour Bitcoin analysis. Stay tuned and follow along!
👀 After breaking out of the descending channel and confirming the long setup I explained in the previous post, Bitcoin moved upward and easily broke through its Maker-buyer zone.
🔍 Over the past two market-holiday days, Bitcoin consolidated in a multi-timeframe accumulation phase with a ceiling at $107,356, which was easily breached. The price then advanced toward its higher-level key resistances. It’s now trading between $110,500 and $113,000 — the $113,000 zone is our long trigger since price has struggled there multiple times before. This makes it a bit risky, but if the upward movement continues, the next resistances could be at $115,800 and $120,836.
🧮 Looking at the RSI oscillator, it has comfortably passed the 50 level on the 4-hour chart and is now heading toward the overbought zone, facing a key resistance at 70. This 70 level overlaps with the 50 zone on the daily timeframe, meaning that if RSI enters overbought on the 4-hour, the daily will just be shifting from a bearish swing phase to a long-position momentum phase — so the 70 zone is crucial.
🕯 If you check the lower-volume section of the chart, you’ll notice something interesting: the breakout above the two-day accumulation range came with a clear rise in buy volume, which helped Bitcoin easily break both the resistance area and the descending trendline (the upper boundary of the previous channel). This suggests Bitcoin may soon take a volume or price correction to gain more strength for another upward move.
⏰ During today’s New York session, we might see some strong moves. Remember last week when U.S. investors were selling off their ETF holdings, and the market was hesitant to buy? That fear caused weak participation. This time, we may have a reason to stay active during New York hours as sentiment shifts.
🧠 Here are the two key scenarios to watch:
🟢 Long Position Scenario
Wait for Bitcoin to react either to the micro-buyer zone or to the $113,000 area. If we see a pullback followed by an indecision candle (confirmation setup) touching the SMA-7, that’s our entry cue — ideally with a tighter stop size.
🔴 Short Position Scenario
Ignore shorts for now. Bitcoin already completed its second downward wave with an imbalanced slope, and over the last two days, seller momentum has weakened. Buyers are now driving price through resistance levels, so shorting here would go against the current flow.
❤️ Disclaimer : This analysis is purely based on my personal opinion and I only trade if the stated triggers are activated .

Can USDT.D break its high ? | USDT.D 4H Analysis🥳 Hey everyone! Hope you’re doing great! Welcome to SatoshiFrame channel .
✨ Today we’re diving into the 4-Hour Ethereum analysis. Stay tuned and follow along!
💵 Can USDT.D break its high & cause crypto drop again ? Tether Dominance is hovering near the 5% zone after the Trump tariff rumors — a key resistance that perfectly aligns with the crypto market’s bottom. A breakout here could trigger another leg down across altcoins.
👀 4-hour timeframe of Tether Dominance and we can see that after breaking the 4.6% area, it gave us a confirmation for an uptrend, and in this area, it also formed a higher low compared to its previous low. It easily broke through several resistance levels and reached its top at the 5.16% area, where it is now rejected. Since we are in the holiday period, we have faced weak downward momentum, and now several breakout triggers have formed on the Tether dominance chart which, with Tether volume passing through these areas, the market can start its next move. Note that this top that has currently formed is the same as the bottom of the altcoins that we see on various charts, so breaking this top will not be easy.
🧮 The RSI oscillator can be a great help to us in this analysis, as it allows us to better identify the tops and bottoms of Tether dominance. If the oscillation passes through those desired areas, we can take positions on coins contrary to the direct supply and demand of the chart itself. The 74 oscillation zone is slightly above the overbought boundary, and crossing this area can increase the oscillation volume of Tether buy trades and cause the crypto market to lose its bottom. The next important area is the 50 zone, where a reaction to this area or passing the oscillation limit from this area can form a lower top for Tether dominance and then give us confirmation to start a bullish leg in the market.
🕯 The size of the Tether dominance candles during the rise was significantly smaller but closed with more strength, while during reactions and pullbacks, the size and number of candles increased, which informs us of the weakness of the Tether sellers' trend. A noteworthy point for Tether dominance is the rejection it received from the top and then moved downward, facing weak upward momentum. If the market bottom is in this area and the Tether dominance top is also in this area and this top does not break, the market can soon tend toward a trend change and a drop in dominance may occur.
❤️ Disclaimer : This analysis is purely based on my personal opinion and I only trade if the stated triggers are activated .
