Scanner
Harmonic and Chart Patterns in ONE IndicatorChart Patterns and Harmonic Patterns using just ONE indicator!
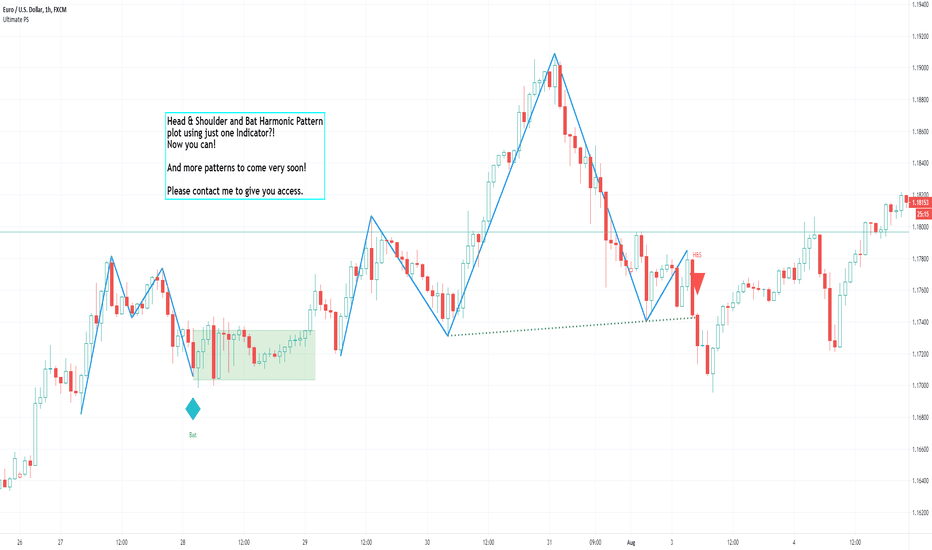
This is a automatic scanner for well know patterns like Head and Shoulder to get started. I'm planning to add more patterns in the near future. It works as follows:
1. Is going to plot the pattern on the chart, lines in blue
2. Is going to show you when the pattern has finished to form, triangles and diamonds
3. It is possible to get an alert when the pattern has form
For example: is going to give a possible entry when the price has broken the trend line of the two shoulders if we take the Head and Shoulder pattern as an example.
Please let me know in the comments if you would like to have more patterns.
======================================================
This versions supports:
1. Head And Shoulder Pattern
- Show possible entries when the trend formed by the shoulders has been broken
2. Bat Harmonic Pattern
- Show Possible Reverzals Zones in green or red boxes
- Alerts when any pattern has form
- Can be used on any instrument
======================================================
======================================================
Next Versions:
- All the harmonic patterns
- Triangles
- Elliot Waves impulses
- Double Top and Bottom
- Triple top and bottom
- Rising and Falling Wedge
- The cup and the handle, etc
- ABCD pattern
Let me know in the comments if you would be interested in something like this please. I'll appreciate your feedback.
thanks
Preparing the week with 100eyes Forex Scanner - CADJPYNow that the markets are closed, we can take a step back and carefully observe all pairs.
After closing in on a strong support zone from the 4h, we see three very bullish signals:
1) The RSI is recovering
2) A hammer has been printed
3) A huge green candle formed after the hammer
This is a great opportunity for a long, and after observing the a confirmation on the price action during the market open we can decide to enter this long trade.
GBP/JPY 4hr Technical AnalysisGBP/JPY pair 4hr timeframe Technical Chart Analysis
risk reward ratio 6:1 entry at vwap crossover vfi_lb at 4hr confimation
Expected bullish economic calendar release for tomorrow CPI's, PPI's, RPI's etc.
Strong momo scanner EA for GBP/Pound 5 min into 15 min weak 1 hr into daily timeframe
And weak for JPY/Yen 5 min into daily
EURJPY copy pasteNothing special yet happening on this chart/pitchfork just thought id share so you can copy it onto your charts and just observe what price will do and how it might/might not interact in the future.
Educational purpose only, not giving signals, use proper risk management if you should trade.


