Predictions and analysis
The Bitcoin futures market is showing signs of a potential reversal short-term bearish impulse, with institutional traders accumulating positions in a newly identified accumulation zone. This zone, marked on the chart, represents an area where large buyers have been actively buying BTC futures contracts. The accumulation zone has been formed after a period of...
In this video, I go over a list of stocks I'll be looking for strength in, to hop into longs on. I go over levels I'll be watching, and what would negate said interest. I run scans each week, to look for ideal candidates for the following week (Longs). My scan this week provided me over 300 Stocks, and these are the ones I believe show the most promise. As...
This asset might be intersting to short. Ideally one should wait for the Chikou Span to get below its cloud.
Here is an interesting zone that could be traded. The Chikou Span in still in the cloud. The better would be to wait for the CS to get below its cloud. But there might be a shorting opportunity here.
Will the price go down to the trendline ? If yes, will it get below it to dump ? The Chikou Span is trying to get below its Kijun Sen.
The volume impact scanner notify me when the currency are changed in Volume positively and often means a change in the direction of the currency. Then the hot ticker gives me currency, when it Trend and are traded on strongly.
The price is almost reached the resistance level , The price will change direction when it reaches this area
The volume impact scanner caught the DNTUSDT when the volume increased more than 1000% it was too early before it goes into an uptrend ,then it did more than 50% in profits
Before hours the Cup showed clearly , Then it was the time to trade the handle and i did a nice profits in 5 hours period
AI called BTC long Pattern is Bullish Wedge (Falling Wedge) RSI is extremely (!) oversold Volumes are nicely going up Let's try this long!
Screen and get Alerts for your Option Strike Price, Target price and portfolio stop loss for 15 tickers.
Screen and get Alerts for your Option Strike Price, Target price and portfolio stop loss for 15 tickers.
CCL bullish wolfe wave pattern and bearish trend line with support and resistance levels.
Welcome to another in-depth breakdown of gold using technical analysis. In this analysis I will help you prepare for the following week using the chart above. I am suggesting a long trade set-up here on XAU/USD. In general gold obviously has a long bias since it's been rising nearly non stop on the larger timeframes. But there are short opportunities on the...
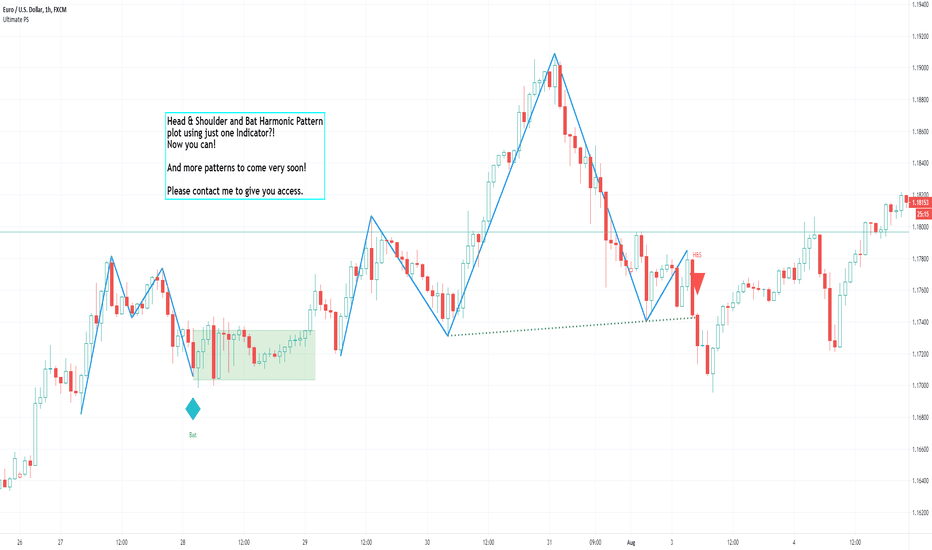
Bat Pattern and PRZ (Potential Reversal Zone) found by our Ultimate PS Indicator. Let's see the price action to enter short on the confirmation on the potential reversal zone.
Chart Patterns and Harmonic Patterns using just ONE indicator! This is a automatic scanner for well know patterns like Head and Shoulder to get started. I'm planning to add more patterns in the near future. It works as follows: 1. Is going to plot the pattern on the chart, lines in blue 2. Is going to show you when the pattern has finished to form, triangles and...


