Compare with Carnival Corporation Ltd.
2.31 USD
2.76 B USD
26.62 B USD
1.25 B
Last report date
—
Report period
—
EPS
—
Revenue
—
Earnings release details
Record Q3 results featured all-time highs in revenue, yields, and net income, with strong cost control and robust booking trends extending into 2027 and 2028. Operational improvements offset inflation and fuel headwinds, while capital returns and balance sheet strength advanced.
Company info
Sector
Industry
CEO
Josh Weinstein
Website
Headquarters
Miami
Founded
1972
ISIN
BMG2004J1036
CUSIP
G2004J103
FIGI
BBG000BF6LY3
Identifiers
ISIN BMG2004J1036
Carnival Corp. Ltd. engages in the operation of cruise ships. It operates through the following business segments: North America Cruise Operations, Europe Cruise Operations, Cruise Support, and Tour and Others. The North America Cruise Operations segment includes the Carnival Cruise Line, Holland America Line, Princess Cruises, and Seabourn. The Europe Cruise Operations segment consists of AIDA, Costa, Cunard, and P&O Cruises (UK). The Cruise Support segment represents port destinations and private islands for the benefit of its cruise brands. The Tour and Other segment operates hotel and transportation operations of Holland America Princess Alaska Tours. The company was founded in 1972 and is headquartered in Miami, FL.
CCL — Demand Zone + Long-Term Trendline ConfluenceCarnival Corporation (CCL) is testing an interesting technical area on the Daily chart.
Price has pulled back into the $21.96–$22.32 demand zone, right where it meets a major rising trendline that has supported the broader structure since 2022. That gives us strong technical confluence around the c
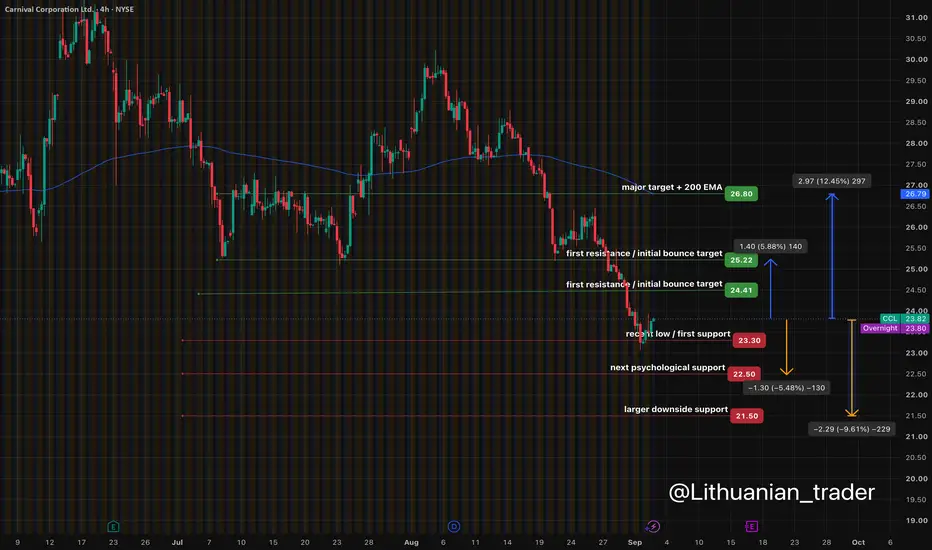
CCL: Reversal Setup | Watching a Bounce Toward the 200 EMACCL is back on my watchlist after a sharp pullback into the $23 area.
Price is currently trading below the 4H 200 EMA, so I’m treating this as a potential recovery/reversal setup, not a confirmed bullish trend.
🟢 Upside levels:
$24.41 — first resistance / initial bounce target
$25.22 — second resi
Carnival Staggers as Stocks Break OutCarnival has been stuck in the doldrums as the broader market breaks out, and some traders may see downside risk.
The first pattern on today’s chart is the peak above $34 in February, its highest level since the pandemic. CCL has drifted lower since, which may reflect a lack of demand for its share
Carnival (CCL): Key Support Test With Upside PotentialCarnival Corporation (CCL) is pulling back into a key support zone around $26, where buyers have previously stepped in.
The stock is still trading below the 200 EMA, so I’d like to see buyers reclaim that level before turning more bullish. If support holds, this could offer an attractive swing trad
CCL — Q2 Earnings Today: Testing Whether the Cruise Recovery HasCCL — Q2 Earnings Today: Testing Whether the Cruise Recovery Has Legs
NYSE:CCL — Carnival Corporation — June 23, 2026**
Carnival reports Q2 earnings this morning with the stock sitting in the middle of its 52-week range (~$23.45–$34). Record booking trends have driven a strong recovery, but fue
Carnival Corp (CCL): A Leveraged Travel Oligopoly Rebuilding ItsExecutive Summary:
Carnival has come out of the pandemic with demand stronger than most investors expected. Free cash flow has returned and ROIC has recovered to roughly 13 percent. The balance sheet, however, still carries about $26 billion of debt, and the business remains highly cyclical and capi
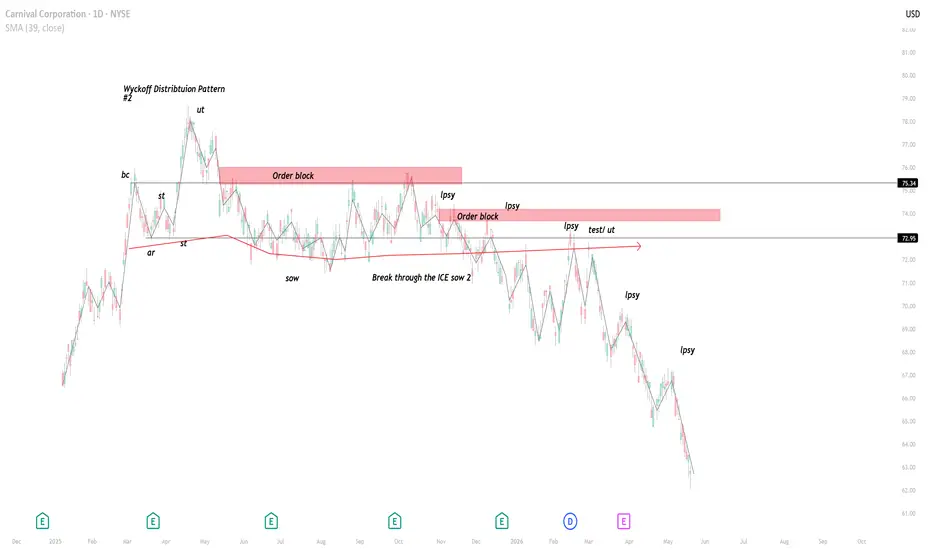
Distribution 2 --No Ut test Heavy selling dominantThis schematic is different. In its phase b, buying pressure reduced and diminished over the trading range. Many test of demand were made overall near the bottoms where some mistake for hidden accumulation. Price made a double top but made no commitment upwards, resulting in an overall downward pres
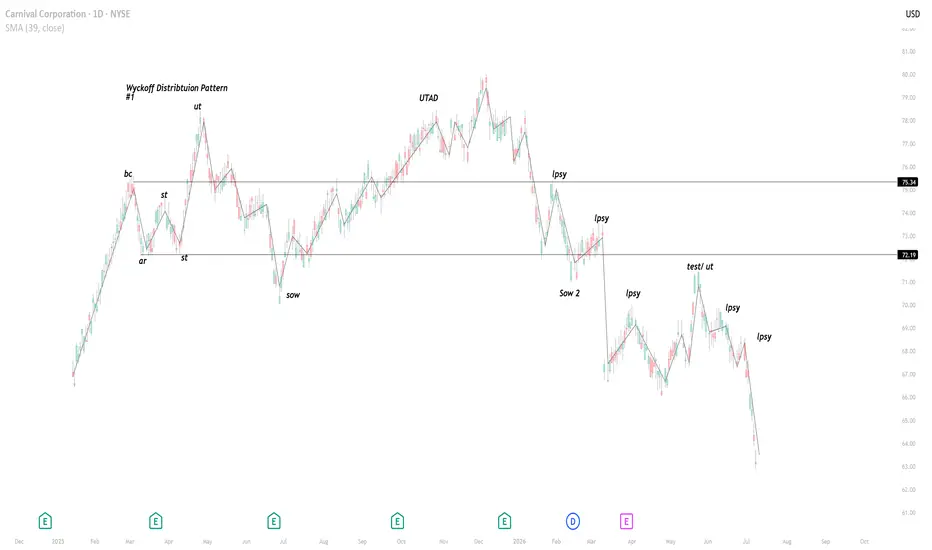
Wyckoff Schematic distribution with UTADJust a schematic of many that ive seen over the years trading. The Trading Ranges for Distributions are wide swings with extreme volatility.
Volatility = Money opportunities for flipping shares at high prices.
It is, however, to take on a full position in these set ups for the bias is Bearish in
See all ideas
Summarizing what the indicators are suggesting.
Neutral
Neutral
Neutral
An aggregate view of professional's ratings.
Neutral
Neutral
Neutral
Displays a symbol's price movements over previous years to identify recurring trends.
Maturity dateFeb 15, 2033
Coupon6.13% (Fixed)
Maturity dateAug 1, 2032
Coupon5.75% (Fixed)
Maturity dateJun 15, 2031
Coupon5.88% (Fixed)
Maturity dateMar 15, 2030
Coupon5.75% (Fixed)
Maturity dateMay 1, 2029
Coupon5.13% (Fixed)
Maturity dateAug 1, 2028
Coupon4.00% (Fixed)
Maturity dateJan 15, 2028
Coupon6.65% (Fixed)
Maturity dateJun 1, 2027
Coupon7.88% (Fixed)
Maturity dateJul 15, 2031
Coupon4.13% (Fixed)
Maturity dateJan 15, 2030
Coupon5.75% (Fixed)
Maturity dateOct 28, 2029
Coupon1.00% (Fixed)
See all CCL bonds
Frequently asked questions
The current price of CCL is 26.13 USD — it has decreased by −0.08% in the past 24 hours. Watch Carnival Corporation Ltd. stock price performance more closely on the chart.
Depending on the exchange, the stock ticker may vary. For instance, on NYSE exchange Carnival Corporation Ltd. stocks are traded under the ticker CCL.
CCL stock has risen by 5.96% compared to the previous week, the month change is a 12.29% rise, over the last year Carnival Corporation Ltd. has showed a −9.24% decrease.
We've gathered analysts' opinions on Carnival Corporation Ltd. future price: according to them, CCL price has a max estimate of 43.00 USD and a min estimate of 23.00 USD. Watch CCL chart and read a more detailed Carnival Corporation Ltd. stock forecast: see what analysts think of Carnival Corporation Ltd. and suggest that you do with its stocks.
CCL stock is 2.82% volatile and has beta coefficient of 1.41. Track Carnival Corporation Ltd. stock price on the chart and check out the list of the most volatile stocks — is Carnival Corporation Ltd. there?
Today Carnival Corporation Ltd. has the market capitalization of 35.13 B, it has increased by 8.31% over the last week.
Yes, you can track Carnival Corporation Ltd. financials in yearly and quarterly reports right on TradingView.
Carnival Corporation Ltd. is going to release the next earnings report on Dec 18, 2026. Keep track of upcoming events with our Earnings Calendar.
CCL earnings for the last quarter are 1.43 USD per share, whereas the estimation was 1.35 USD resulting in a 5.62% surprise. The estimated earnings for the next quarter are 0.22 USD per share. See more details about Carnival Corporation Ltd. earnings.
Carnival Corporation Ltd. revenue for the last quarter amounts to 8.44 B USD, despite the estimated figure of 8.39 B USD. In the next quarter, revenue is expected to reach 6.47 B USD.
CCL net income for the last quarter is 1.92 B USD, while the quarter before that showed 537.00 M USD of net income which accounts for 0.00% change. Track more Carnival Corporation Ltd. financial stats to get the full picture.
Yes, CCL dividends are paid quarterly. The last dividend per share was 0.15 USD. As of today, Dividend Yield (TTM)% is 1.72%. Tracking Carnival Corporation Ltd. dividends might help you take more informed decisions.
Carnival Corporation Ltd. dividend yield was 0.00% in 2025, and payout ratio reached 0.00%. The year before the numbers were 0.00% and 0.00% correspondingly. See high-dividend stocks and find more opportunities for your portfolio.
EBITDA measures a company's operating performance, its growth signifies an improvement in the efficiency of a company. Carnival Corporation Ltd. EBITDA is 7.31 B USD, and current EBITDA margin is 26.96%. See more stats in Carnival Corporation Ltd. financial statements.
Like other stocks, CCL shares are traded on stock exchanges, e.g. Nasdaq, Nyse, Euronext, and the easiest way to buy them is through an online stock broker. To do this, you need to open an account and follow a broker's procedures, then start trading. You can trade Carnival Corporation Ltd. stock right from TradingView charts — choose your broker and connect to your account.
Investing in stocks requires a comprehensive research: you should carefully study all the available data, e.g. company's financials, related news, and its technical analysis. So Carnival Corporation Ltd. technincal analysis shows the neutral today, and its 1 week rating is neutral. Since market conditions are prone to changes, it's worth looking a bit further into the future — according to the 1 month rating Carnival Corporation Ltd. stock shows the neutral signal. See more of Carnival Corporation Ltd. technicals for a more comprehensive analysis.