Gold - Control vs Patience… Who Wins Next?Gold hasn’t done anything crazy lately, and that’s exactly the point.
Zooming out, the structure is still bullish. Every dip so far has been met with buyers, and the market keeps printing higher highs and higher lows.
Right now, price is sitting inside what I like to call a decision zone. This is where the market usually pauses, shakes out impatient traders, and shows its real intention.
As long as we’re holding above this green zone, bulls are still in control. This looks more like a pause or reload than a reversal.
That said, if price loses this area and starts accepting below it, then the story changes... and a deeper correction would be on the table.
What do you think? Will Gold reload and continue higher, or is this where control shifts? 🤔
⚠️ Disclaimer: This is not financial advice. Always do your own research and manage risk properly.
📚 Stick to your trading plan regarding entries, risk, and management.
Good luck! 🍀
All Strategies Are Good; If Managed Properly!
~Richard Nasr
Scenario

BULLISH SCENARIO - USOILHello traders,
USOIL is currently moving inside a descending channel.
A bullish breakout is in focus:
If the price breaks the channel resistance and confirms the close above,
a strong upward movement is expected 🚀
🎯 TARGET: 65.150

AUDUSD – Confluence Buy Zone!AUDUSD is currently testing a major support confluence zone, where the rising blue trendline, the green demand area, and the lower boundary of the short-term red falling channel intersect.
As long as price continues to hold above the 0.6450–0.6485 zone, the bullish outlook remains valid, and I’ll be looking for long opportunities from this area.
A rebound from this level could trigger a move toward 0.6560, followed by 0.6620–0.6670, aligning with the upper boundary of the broader channel.
However, a 4H close below 0.6425 would invalidate this bullish scenario and shift the focus toward the next support zone near 0.6380.
⚠️ Disclaimer: This is not financial advice. Always do your own research and manage risk properly.
📚 Stick to your trading plan regarding entries, risk, and management.
Good luck! 🍀
All Strategies Are Good; If Managed Properly!
~Richard Nasr

SCENARIO STUDY: Bullish or Bearish?Hello fellow traders! Here’s a fresh, USD/JPY plan that blends 4-hour technicals with today’s macro/news flow, plus the most recent trader and bank sentiment. Time to get happy!
USD/JPY for Aug 15, 2025, U.S. morning/afternoon
4H structure: After a slide that tested ~146.2–146.4 support, the USD/JPY keeps running into 147.8 and 148.5 as notable 4H hurdles.
Macro/news today: U.S. PPI (July) surprised hotter, cooling talk of a 50 bp Fed cut (market leans 25 bp for Sep 17); Japan Q2 GDP beat aided the yen and BoJ-hike chatter.
BoJ backdrop: July meeting opinions/outlook show a cautious tightening bias and discussion of resuming hikes; 10-yr JGB around ~1.5%.
Positioning & sentiment (latest):
CFTC JPY (non-commercial) net longs have fallen from mid-July peaks to ~82k (Aug 8). Retail (spot) sits near 54% long / 46% short.
Banks’ bias (based on recent published views):
UBS CIO guides for USD/JPY drifting lower through year-end (~140 by Dec 2025) as BoJ tightens gradually, and J.P. Morgan Research also expects weaker USD into late-2025 (USD/JPY ~141 Sep, 140 Dec).
4-hour levels to mark
Support: 146.20–146.40, then ~146.00 (deeper swing shelf).
Resistance: 147.80, 148.50 (recent 4H/spot pivot and swing high).
Scenario A — Bullish (rebound off support / corrective pop)
Why it could play out: Hotter U.S. PPI trimmed aggressive-cut bets; if incoming U.S. data/fedspeak doesn’t further dent yields, a corrective USD bounce can lift price from support toward overhead supply! Go Bulls? :D
Bullish Plan (4H execution):
Entry: 146.40–146.70 on a 4H bullish candle or RSI divergence near S1. (Structure band per the 4H map.)
Stop: 145.95 (clean break of the lower shelf).
Take Profit 1: 147.80 (first supply).
Take Profit 2: 148.50 (recent high / strong supply).
Respect Supports: 146.40–146.20, then 146.00.
Resistances to fade/scale: 147.80, 148.50.
Indicative R:R: from 146.60 risk ~65 pips to stop for ~+120 pips to TP2 (≈1:1.8), +120–190 pips if extension through 148.5.
Scenario B — Bearish (trend continuation from resistance)
Why it could play out: 4H downswing remains intact below 147.8/148.5; BoJ tone leans cautious-hawkish, Japan data firmed (GDP), while CFTC shows less crowded JPY longs (reduced squeeze risk). UBS/JPM public pieces lean medium-term lower USD/JPY.
Bearish Plan (4H execution):
Entry: 147.80–148.00 on a 4H rejection wick / failure swing at R1.
Stop: 148.60 (invalidate above R2 swing high).
TP1: 147.00 (recent intraday base).
TP2: 146.20–146.40 (key 4H demand).
Resistances to lean on: 147.80, 148.50.
Supports to target: 147.00, 146.20–146.40, then ~146.00 if momentum accelerates. Go Bears? :D
BUT WAIT..... Which is more probable now?
As for the team here at How To (dot) Forex, we are collectively leaning bearish (Scenario B) over the next few sessions. And, here is why....
Structure: Price remains capped beneath 147.8/148.5 on the 4H map.
Macro skew: Hot PPI pared back “big cut” bets but markets still favor a 25 bp cut; meanwhile Japan GDP beat + BoJ talk of possible resuming hikes is JPY-supportive.
Sentiment: Retail near 50/50 (slight long) and CFTC net JPY longs off the highs → fewer asymmetric squeeze dynamics for upside USD.
What are the banks saying?
Recent UBS and JPM predictions point to lower USD/JPY into year-end, aligning with fade-rallies bias unless price reclaims R2 decisively.
_________________________________________________
OPINION AND COMMENTARY:
we prefer fade-rally shorts into 147.8–148.0 unless a 4H close above 148.5 flips bias. If you see a strong 4H basing signal at 146.2–146.4, the bullish corrective setup is valid — just keep targets conservative at 147.8/148.5.
If you have questions, or want to see a specific type of analysis not presented here, leave us a comment below. Thank you for reading. We appreciate your support. Happy trading!
_________________________________________________
DISCLAIMER: This analysis was conducted by our in-house team of multi-level traders. We are not responsible for any losses you may incur. Always do you own research before trading. If you are new to trading, consider practicing with a free paper trading account. Ask your broker for details.

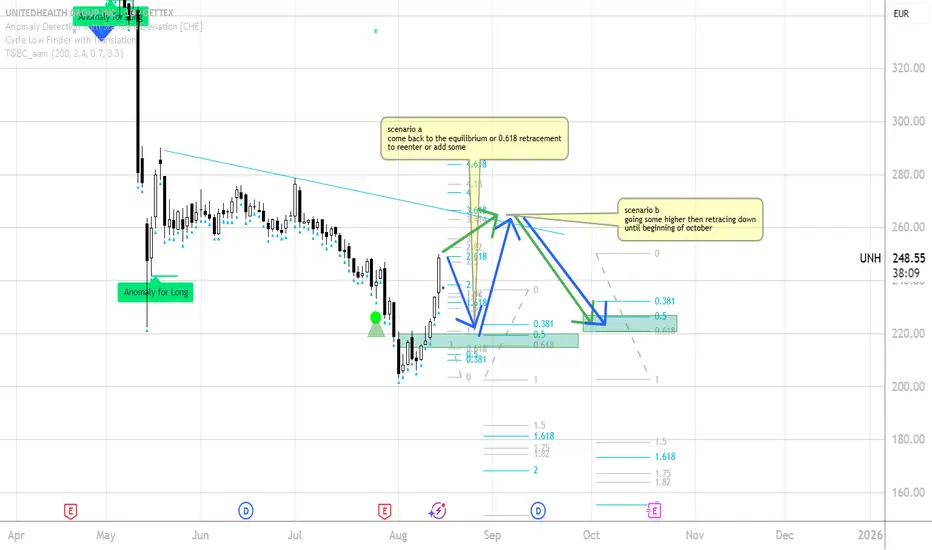
UNITED HEALTH UNH - Two scenarios based on my understanding a sescenario a:
coming back to the 50% or 0.618 retracement then up, then in a typical seasonal bearish period down until beginning of october
scenario b:
First target could be at the descrending trendline then retracement until beginning of october
to the 50% or 0.618
this is of course not a trade call or advide. for educational purpose only...
please comment or chat with me about it!
cheers!
Scenario Study: (USD/JPY) BULLS vs BEARSHere’s a fresh, focused read on USD/JPY using today’s news, data, and technicals, plus trader sentiment on 4 hour charts.
What changed today so far... (Aug 13, 2025)
CPI came in mild (~2.7% YoY) → markets ramped up odds of a September Fed cut (≈94–98%) → Treasury yields/dollar slipped. That kept USD/JPY heavy after a pop to ~148.5 earlier in the week.
4-hour technicals (levels that matter)
Range defined by MAs: Price has been ping-ponging between the 4h 100-bar MA (~147.94) and 4h 200-bar MA (~146.73). A break of either side likely sets the near-term trend.
Nearby resistance: 148.00/148.50 (recent weekly high ~148.52). A sustained 4h close above opens 149.00 → 149.50.
Nearby support: 147.10 (intra-range floor) then 146.70 (4h 200-MA); below that, risk toward 146.00–145.50.
Short MAs (8 & 16 on 4h charts): With CPI softness pressuring USD, the very short MAs are flattening/near price (typical in a range). A bearish tilt re-asserts if price rides below them toward the 200-MA; a bullish turn needs reclaims above them and a close >148.00/148.50. (Directional inference from the cited 4h range behavior.)
Sentiment & positioning
Retail positioning: Net-long skew persists (~61% long / 39% short), a contrarian negative for USD/JPY if the skew persists into weakness. Ahead of/after CPI, trader bias for USD leaned bearish (BofA), and the dollar index eased post-release. That favors JPY on dips unless risk rallies push yields back up.
Tradeable take (4-hour game plan)
Bias now: Mildly bearish / range-to-down while below 148.00–148.50 and especially if price holds under the 8/16 4h MAs toward the 200-bar MA (~146.7).
Bearish continuation trigger: 4h close below 146.70 (200-MA) → momentum target 146.00 → 145.50; invalidation back above 147.20–147.40.
Bullish reversal trigger: 4h close above 148.50 (and holding above the short MAs) → targets 149.00 → 149.50; invalidation on a drop back below 148.00.
THE BOTTOM LINE
Today’s softer CPI + higher cut odds keep USD/JPY on the back foot, with the pair stuck between the 4h 100- and 200-bar MAs. Until 148.50 breaks, risk skews to a grind lower toward 146.7 → 146.0; a clean topside break flips bias to 149+~.
Thank you for reading, and happy trading!
_________________________________
DISCLAIMER: This analysis was conducted by our in-house team of multi-level traders. We are not responsible for any losses you may incur. Always do you own research before trading.

SILVER - BEARISH SCENARIOHello Traders !
The Silver price failed to create a new higher high !
Let's expect the bearish scenario:
If the market breaks the higher low and closes below that,
We will see a bearish move📉
TARGET: 31.23🎯

SILVER - BEARISH SCENARIOHello Traders !
After a huge bearish move,
The silver price reached the support level (28.70 - 29.0).
So, let's expect the bearish scenario:
If the market breaks below the support level and closes below that,
We will see a new bearish move📉
TARGET: 26.65🎯
Previous Analysis:

Will Monday Bring a Breakout or a Correction?Last week was characterized by extreme volatility, with price movements reflecting significant reactions across different trading sessions. On Friday, the Asian session managed to push past the $3057 mark, only for early European trading to see a pullback. However, the US session reversed course, fueling a rally that extended until market close.
Key Levels to Watch on Monday
Looking ahead, the critical question is whether the Asian session can break above $3086, potentially paving the way for a push beyond $3100. If this breakout fails, we could see a price correction similar to Friday's, especially during European trading.
At present, I'm taking a cautious approach, observing the market while many anticipate further upside. While momentum appears strong, I prefer to wait for clearer confirmations before making a move.
Potential Scenarios
Breakout Above $3086
A successful push above this level could signal continuation toward $3100+, reinforcing the bullish sentiment.
Failure at $3086 – Potential Pullback
If the market struggles to sustain levels above $3086, a decline to $3076 is likely.
A break below $3076 could see further downside to $3067 and possibly lower.
Technical Indicators & Market Sentiment
RSI (1H): Currently at 52, indicating neutral momentum.
RSI (4H): Around 90, showing overbought conditions—especially following the Asian session rally.
Market Sentiment:
Many traders expect an upward continuation, but caution is warranted given overbought signals and the possibility of a correction.
External Factors: Tariffs & Global Trends
As we approach April 2nd, when new tariffs take effect, global markets have been showing signs of weakness. Uncertainty persists, and with gold acting as a safe haven, investors may seek protection, adding another layer of complexity to Monday’s price action.
Conclusion
The start of the week will likely be dictated by whether the Asian session can achieve a breakout above $3086. If it does, bullish momentum could drive prices higher. However, failure at this level could result in a correction, with key support levels at $3076 and $3067 in focus. Given the broader market conditions and upcoming economic events, a cautious approach remains prudent.
📉 Will Monday bring a correction, or is there still room for another rally? Share your thoughts in the comments! 🚀
-------------------------------------------------------------------------
This is just my personal market idea and not financial advice! 📢 Trading gold and other financial instruments carries risks – only invest what you can afford to lose. Always do your own analysis, use solid risk management, and trade responsibly.
Good luck and safe trading! 🚀📊

EURUSD - 2 ScenariosHello Traders !
On Tuesday 11 March, Th EURUSD reached the resistance level (1.09374 - 1.09058).
So, We have 2 Scenarios:
BULLISH SCENARIO:
If the market breaks above the resistance level and closes above that,
We will see a bullish move📈
TARGET: 1.11580🎯
BEARISH SCENARIO:
If the price breaks and closes below the neckline,
We will see a huge bearish move📉
TARGET: 1.06350🎯

EURUSD - BULLISH SCENARIOHello Traders !
On Friday 7 March, The EURUSD reached the resistance level (1.09374 - 1.08834).
Let's expect the BULLISH SCENARIO:
If the market breaks above the resistance level and closes above that,
We will see a bullish move📈
TARGET: 1.11580🎯

GOLD - BEARISH SCENARIOHello Traders !
The GOLD price formed a falling rising wedge.
So, Let's expect the Bearish Scenario📉
if the market breaks the support level (2864 - 2882) and closes below that,
We will see a huge bearish move📉
__
TARGET: 2793🎯

USDJPY - BULLISH SCENARIOHello Traders !
On Thursday 20 FEB, The USDJPY reached the support level (149.356 - 148.639) and failed to break it !
So, We have a bullish scenario:
If the price breaks and closes above the lower high (150.733 - 150.469),
We will see a bullish move🚀
_______________
TARGET: 153.700🎯

BITCOIN - BEARISH SCENARIOHello Traders !
On the daily time frame, The BTC price reached a strong support level (89000 - 92000).
So, Let's expect the Bearish Scenario📉
if the market breaks the support level and closes below that,
We will see a huge bearish move📉
__________
TARGET: 74500🎯

USDCAD - BEARISH SCENARIOHello Traders !
The USDCAD failed to break the resistance level (1.45957 - 1.46900).
Currently, The price is trading in the support level (1.43100 - 1.42610).
So, Let's expect the bearish scenario :
if the market breaks the support level and closes below that,
We will see a huge bearish move📉
__________
TARGET: 1.41100🎯

HBAR/USDT: A Potential Super Long-Term Impulse Wave Take a look at this super long-term potential impulse wave for HBAR. This chart captures a massive Elliott Wave structure that could define the next big move in the crypto market.
We’re seeing the foundation of Wave 3, with the potential for a trend-defining breakout as HBAR progresses through its impulsive phases. The critical zone? A breach of the upper trend line would validate this structure and could signal higher highs on the horizon.
This isn’t just a week-to-week setup—it’s a multi-year roadmap. If the Hurst cycles align, we’re looking at one of the most promising long-term plays.
What’s your take? Do we see confirmation, or does this remain a dream scenario? Share your thoughts and follow for more long-term crypto insights! 🚀

USDCHF - 2 SCENARIOSHello Traders !
On Wednesday 18 Dec, The USDCHF reached the resistance level (0.90504 - 0.90114).
So, We have 2 scenarios:
BULLISH SCENARIO:
If the market breaks above the resistance level and closes above that,
We will see a bullish move📈
TARGET: 0.91250🎯
BEARISH SCENARIO:
If the price breaks and closes below the higher low (0.89137 - 0.89282),
We will see a huge bearish move📉
TARGET: 0.87900🎯

GBPUSD - BULLISH SCENARIOOn the weekly time frame, The GBPUSD price reached a resistance level (1.32988 - 1.31804).
Let's expect the bullish scenario:
If the market breaks and closes above the resistance level,
We will see a bullish move📈
_______________
TARGET: 1.35530🎯

BITCOIN SCENARIOThis weakly candle is very very very important, there is a scenario that btc is registering higher low in Daily timeframe to push up price, but we should have a look on interest rates cut, its not time to be panic, the market is full of fear, dont sell your BTC to BIG GAME PLAYERS.
This analysis has only an educational aspect in the form of a possible scenario and is not published for signaling purposes.

GOLD - BEARISH SCENARIOHi Traders !
The Gold price reached the support level (2391 - 2398).
Let's expect the bearish scenario:
if the price breaks the support level and closes below that,
We will see a bearish move📉
____________
TARGET: 2360.500🎯

BITCOIN - BULLISH SCENARIOHello Traders !
The BTC price reached the resistance level (62830 - 63801).
Let's expect the bullish scenario📈
If the market breaks and closes above the resistance level,
We will see a bullish move📈
_____________
TARGET: 66000🎯

EURUSD - BULLISH SCENARIOHello Traders !
On Wednesday 26 June, The EURUSD reached a support level (1.06661 - 1.06494) and failed to break it !
Let's expect the Bullish Scenario:
if the price breaks above the resistance level (1.07614 - 1.07436) and closes above that,
We will see a bullish move📈
TARGET: 1.08065🎯

GBPUSD - BEARISH SCENARIO Hello Traders !
On the daily time frame, The GBPUSD failed to break the resistance level (1.28570 - 1.28940)
Currently, The price is trading in support level (1.26756 - 1.27015).
Let's expect the bearish scenario:
If the price breaks and closes below the support level,
We will see a huge bearish move📉
-------------
TARGET: 1.25026🎯
