Bitmex ltcbtc possible current wave count...5 maybe $ltc $btcyes a wise man would have charted on an exchange that has full price history...but I am not a wise man...I am a lazy man.... kinda looks like one of those spring loaded boxing gloves...or that invention Data from the goonies had in his coat.
Search in ideas for "BITMEX:"

Bitmex 83% profitable strategy for BitcoinSure swing strategy is 83% profitable, made 100% profits for one year back testing of Bitcoin XBTUSD.

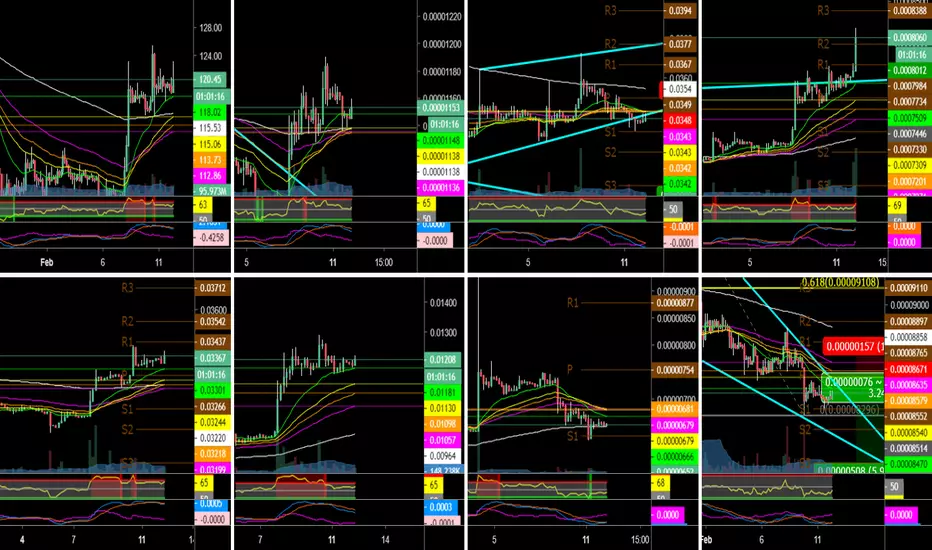
Bitmex Altcoin UpdateVery Interesting day we have here. I would be very careful shorting right now. Most of the coins in Bitmex are on the uptrend on the 4hr charts, except BCH, and XRP. Tron is hovering just above the 200ema and bounced off the support so that could be a continuation of it's uptrend. Keeping an eye on XRP, we will long it once it breaks this falling wedge. Trade safely, and Let's keep up this winning streak!

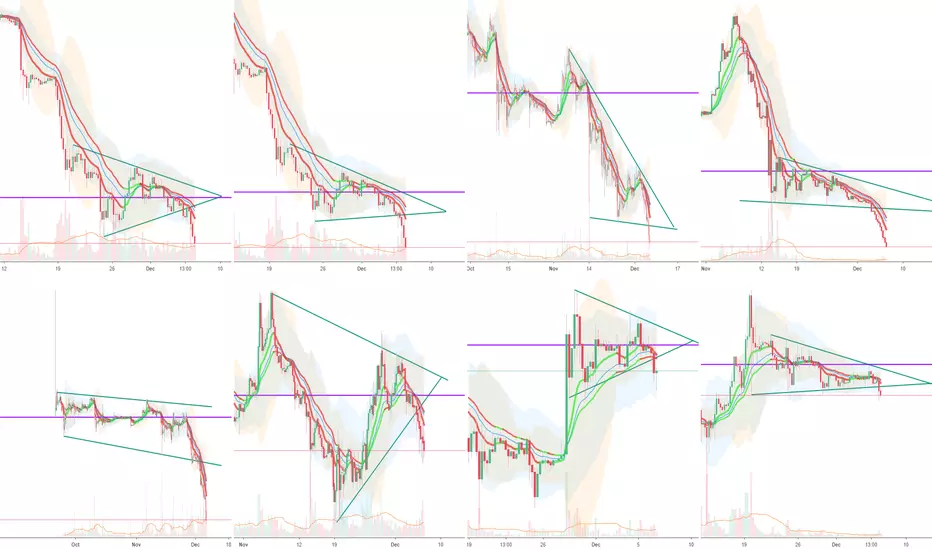
[BitMex] BCHh19Simple up move that is followed by a correction which results in a trend continuation.

[BitMex] ETHUSD Flat SetupPotential flat forming,
expecting a down move towards $120 range
and then an impulsive move up.

BitMEX CEO Bullish on Ethereum. Here’s WhyCurrently trading at 128 against the US Dollar, ETH is completing a much-needed retracement and has been trading sideways for almost 2 days, most likely due to Christmas. It is still up more than 17% for the last 7 days but down 2.66% in the last 24 hours at the time of writing and according to CoinMarketCap.
The pair is likely to find support at the 200-period EMA on a 4-hour chart but also 127 is now acting as good support so we may get a push higher from here. Keep in mind that the Winter Holidays usually generate irregular volatility and sometimes unpredictable market movement, so make sure you limit your exposure and consequently, your risk.
Support zone: 127 (currently tested) and the 200 EMA (4-hour chart)
Resistance zone: round numbers (140, 150) and the high at 163
Most likely scenario: choppy markets, irregular price action
Alternate scenario: strong directional movement


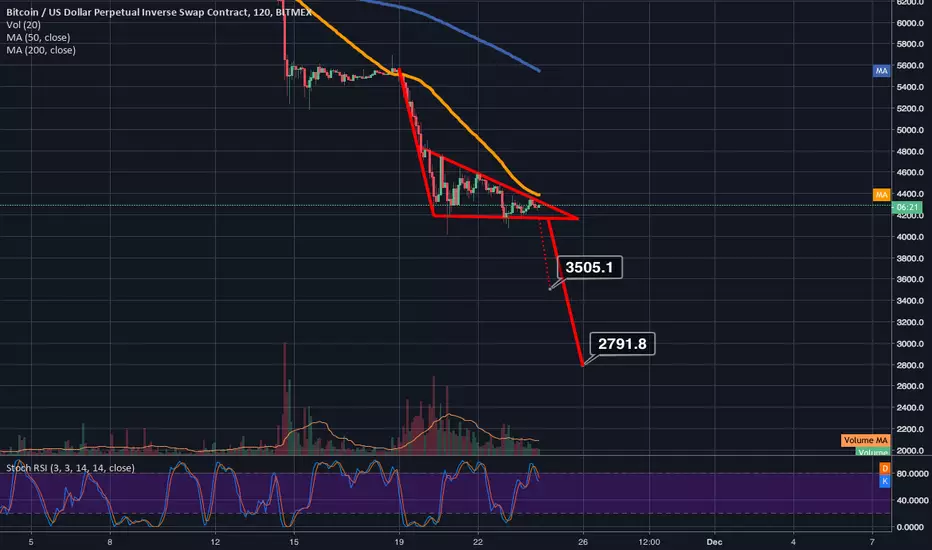
bitmex bearflag still valid but may act as descending triangleOn bitmex the original bear flag with the descending triangle pennant is still valid but the descending triangle of it is getting larger and larger and will soon be too long to be a bear flag and will likely act as just a descending triangle instead. If we break down from it it is more likely that we only drop the length of the triangle than it is that we would drop the length of the pole. Let's keep in mind falling wedge and and inverted head and shoulders are still in play on the bullish perspective so its anyones guess what out of all of them will trigger and confirm most valid.
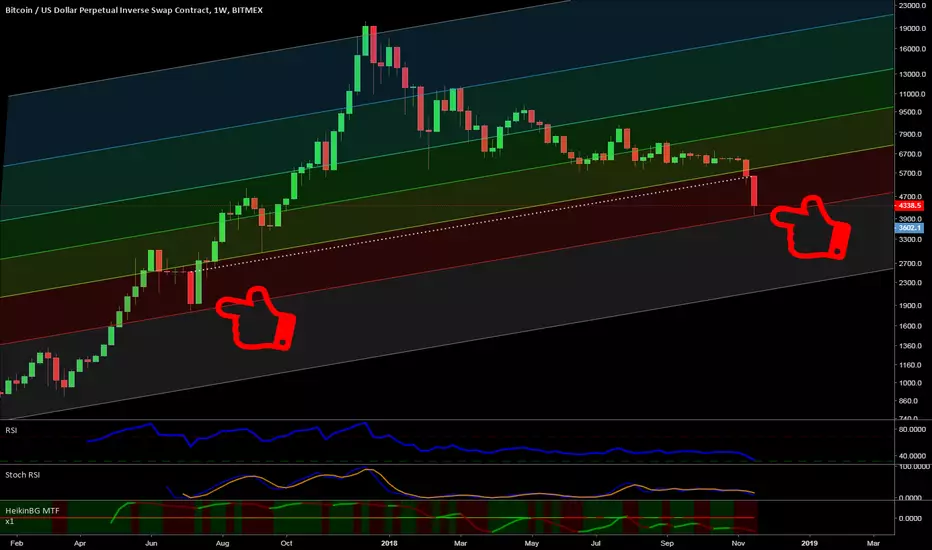
BITMEX WeeklyThis is what gets me - this simple pattern of 2 weekly candles of the same equal log metric height. Could this really bounce here?


Bitmex trade strategy Hello ,
as you can see , we have two positions , lets see how BTC will play with this plan .
Telegram Channel : t.me
Good Luck ,

Bitmex PlanPlease Follow telegram channel for more details .
i will update this chart later .
Telegram: t.me

Bitmex XBT strategy Scalip
Long @ 7000
take profits @ 7100
i will update my chart for good entry price (long/short)
Best Regards.
please join my telegram channel for more updates : t.me

BITCOIN BOTTOM @ $5400-ish by AUGUST ???BITMEX CEO Arthur Hayes thinks we have yet to hit bottom. He feels the bottom is BTC @ $5,000.
CME BTC FUTURES expire Friday, July 27th. There are more Trading Contracts than Open Interest Contracts for the next 2 weeks.
It would make sense for a bottom to occur in August so that September can build up to a full rally by October thru December.
It's only a matter of time. HODL now, SLEL later. (SLEL is SELL, duh....) BTW my chart is descending from the Top and the Bottom w/ 11/11/17 low denoted as well.
#Cryptocurrency #BTC #Cryptocurrencies
THIS IS NOT INVESTMENT ADVICE, THIS IS JUST MY OPINION.
-ADUMB-

Bitmex Nested Wedges BattleTwo nested Wedges, the parent is an ascending one isn't yet ready for breakdown, and the nested one is descending, almost ready for a break up, which makes sense because the parent wedge seems to need maybe at least one more resistance testing before breaking down.
