gone SHORT - Gainz Mastering the MarketAfter locking in the 15% Gainz we made this morning, we have re-entered the game for further profits
If you get this in time, enjoy your profits X
#spiritualtrader #5Dascention #masterthemarket #therealdeal #earikbeann #bertha #naturalcycles #gann #geometrictrading #astrophysics #numerology #sqaureofnine #marketstructure #bitcoin #bitcoinfreesignals #bybitsignals #bitmex #bitmexsignals #cryptocurrency #crypto #cryptotrading #bitcointrading #passiveincome #bybit #cornix
Search in ideas for "BITMEX:"

TRX Sun Moon?Opened a long on TRX . We can see bulligh rsi divergence, upticking histogram, potential macd bull cross, and increasing volume. Additionally dominance is declining. However, I have to be careful becuase a btc pump could rekt this. It's holding above the 4hr 20ma @ 191, and I like the confluence with the 4hr 50ma @192. This could be pretty. My target is just below the 0.272 fib extention of the previous wave. I also like the risk:reward on the trade: 7. Let's see how this plays out.
#TRX/Z19
Exchanges: Bitmex
Signal Type: Regular (Long)
Leverage: 5
Entry Zone: 190-193
Take-Profit Targets: 199-210-220-230-240
Stop Targets: 185
Risk: 18.25%
Rate: 192

Bitcoin (XBTUSD) Long Setup (57.5% ROE Possible on 5X Lev.)BITCOIN (XBTUSD) CAN GO HIGHER!
Let's take a look at the chart below and see if you are interested in a low-risk trade with great potential and a tight stop-loss...
Bitcoin (XBTUSD) tried to break above EMA100 on the 4H time frame multiple times before succeeding. I would like to take a closer look at this...
Please allow me to entertain you for a few minutes:
First we see over 12 failed attempts to break above EMA100, which is the blue line. But XBTUSD would always produce a higher low on the retrace after each attempt.
It finally broke above EMA100 and remained above it. There was an attempt to push the price down unsuccessfully and XBTUSD moved to close above $8075 with good strength and volume. With this move, we can expect additional bullish action.
Both the MACD and RSI are on the bullish zone which gives further strength to this setup.
If XBTUSD can remain trading above EMA100, it is very like that it will go higher and reach $8750 or up to $9000+... Certain conditions must be met so it can move back down.
I am looking at a low-risk but highly profitable trade setup here if you trade on BitMEX... Up to 57.5% ROE for profits potential in a short amount of time...
All the details are on the chart.
Would you like to see this trade?
If we get 150 likes we will share the full trade details (buy-in, targets, stop-loss, lev, and additional details).
We had a recent trade for Litecoin (LTCM19) with amazing results. We also did good with Tron (TRXM19), Ripple (XRPM19) and basically all of our latest BitMEX trades.
You can find the last one here:
Thanks a lot for reading.
Namaste.
----------
THIS IS NOT FINANCIAL ADVICE.
LEVERAGE TRADING IS ULTRA HIGH RISK AND INTENDED FOR EXPERIENCED/ADVANCED TRADERS ONLY.
This is not for beginners, beginners should trade altcoins in any of the major exchanges and skip BitMEX all together.
-----------
Previous analysis:

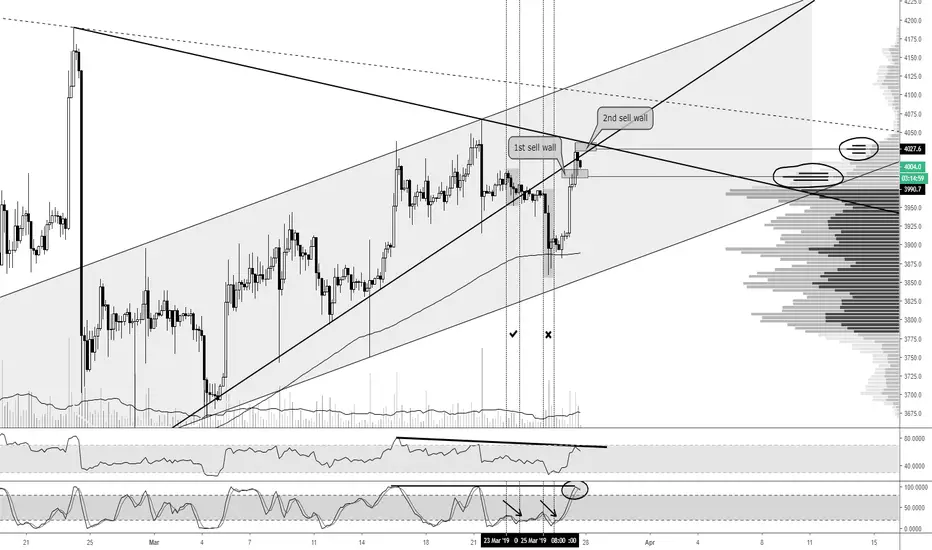
BTC - Time For a Good SHORT.It will be a huge analysis, so be ready to spend 4-6 minutes of your time to read this text. Let's start.
Firstly, let's consider the classic analysis. We can see that $BTC has just touched a triangle's resistance zone, which is a quite bearish signal. Second, let's pay attention to the fact that Bitcoin is still inside the ascending channels.
There are some chances that the price can possibly move to the zone of $4080 - $4100 zone ( thin dotted line on the chart ), I want to emphasize the word " possibly ", because, at the current point, the priority of the price movement is downward, so a possible upward impulse can be considered as a good chance to enter a SHORT position at a higher price. Moreover, I advise you to pay attention to the oscillators, RSI and Stoch. RSI, they are completely overbought on all popular time-frames until 12H.
Now let's take a look at events that are quite difficult to track using classic TA.
To begin with, I want to remind you about the results of the last CME Futures Report, where we found the following SHORT/LONG ratio: 1460/2528 ( Huge Leveraged funds ) and 272/1003 ( Small non-reportable traders ). This ratio tells us that the priority is downward, as the crowd believes in the growth.
The same results we have at the Bitfinex exchange:
LONGS: $98,299,100 (55.06%)
SHORTS: $80,241,257 (44.94%)
Bitmex:
LONGS: $262,066,609 (61.38%)
SHORTS: $ 164,921,829 (38.62%)
TOTAL:
LONGS: $360,365,709 (59.51%)
SHORTS: $245,163,086 (40.49%)
There are more smart traders on Bitfinex exchange because this exchange has a minimum amount for deposit of $10k , which explains the smaller spread. Unlike at the Bitmex exchange, where people mostly try to "feel" the direction of the next market movement by looking at a bare chart.
Now we can finally take a look at the most interesting thing! What have I marked with arrows and checkmarks on the chart?
1. Consider the first vertical column: Stoch RSI leaves the oversold zone during the flat, the price drops slightly. Good tight sale of MM!
2. Consider the second vertical column:
The stochastic leaves the oversold zone but leaves it little bit sharper and the price drops heavily. What happened? Looking at good volumes of small traders, "MM" sells 30-40% instead of the usual 20% (as in P1), which leads to the reaction of stops and liquidations. It could also be noticed on some websites that track liquidates.
To sum up, I'm sure that the $BTC should dump in the very near future. Our goal now is to open a good SHORT position. All reasons for a dump were described above.
If you like this idea, do not forget to put Like and subscribe to the profile, so as not to miss the update.
BitcoinSwing Trade - position trade
Look how its working
BTCUSD moving in falling wedge - reversal pattern. Stoch RSI - oversold. Target - red line ( the bigest volume) indicator Visible Range
Little bit different charts Bitfinex and Bitmex
This is signal for Bitmex;)

$ADA #ADABTC Extensive Technical Analysis - Day Trader ExplainsHello Lads and Ladies,
Welcome back to TJs Daily TA session, today requested by the Elite Trading Group, we will be taking a look into ADA/BTC on Binance and yet combine it with a trade opportunity on BitMex.
If you are following my TA long enough, you know exactly that I love trading ADA/BTC and it has been pretty accurate overall. Today once again I will jump straight into it, using horizontal supports/resistances, trend-lines, trend-angles and important zones.
We see with ADABTC here pretty much a similar outcome like we see with many other alt coins at the moment. First a big big crash and now finally some significant bounces and sustainable sideway movements without crashing immediately again.
Looking at ADA we have a nice up trending angle for the uptrend support indicated in red here. This "good" angle is very important because it gives us more room to have a small retracement and load up the longing positions without leaving or reversing the trend.
The first big bounce has been really amazing and has shown once again that ADABTC is not dead and people are still very interested in buying it and not letting it go too deep. Nevertheless, it had its small sideway action and moved down a little afterwards to re-test that uptrend support, the small bounce that it had from there is in my perspective not enough for it to immediately moon and go back up. As I thought, it stayed pretty near to it but has not re-tested it a second time and now it is in some way or another a pennant. This pennant is showcased in the white colour and is providing us with a small support but as well resistance. It would have a bigger move up by breaking the resistance than just breaking or wicking down the support. It has a lot of buying possibilities below that white support in small steps from each other. On the other side upwards.. it has fewer steps with more space between them, giving it allowed sell pressure and room to pick up some momentum and pump it a little at least to our showcased targets.
We have at the top actually two important zones, one is the yellow profit taking zone and the other is the strong shorting zone. This is because in the yellow <you can easily take your profits and be happy to buy the next sub or burger, yet in the strong shorting zone you would have a very very good RRR for a SL directly above it and with staggers inside it. I hope you see and understand what I mean by that.. A small zone, with just small wicks yet in it, staggers inside it to make your avg entry as high as possible and a SL behind/above which would also mean a nice impulse move by ADABTC. What do you need more for a nice and safe shorting position?
Now, taking a look at the indicators.
FOMO has had a nice short and is now probably about to turn, and if it does not turn yet, it might just fill our orders and will then turn green and give us nice uptrend.
RSI is overall trending up from a very oversold area and has not been near 70 points for a really long time.. this has a great chance of happening since the longer it takes the stronger comes the pull upwards. Moreover, taking an exact look on RSI you will see that the very last small wick has not made anything big for it. Which leaves the RSI support flat but chart RSI trending upwards, which is from my understanding a hidden bullish divergence.
Taking a look at my desired StochasticRSI, we can very well see that it is at the bottom and turing upwards, indicating us the next possible move upwards pretty soon.
VJs Trendline indicator also seems to bending upwards and turning green pretty soon, so from my side a lot of things are speaking for a long position which I have displayed in the chart and will put now in a nice format of how I will make my own trade, for all lazy readers here.
ADA/BTC (ADAZ18)
LONG (max 10x)
Staggers - NOW - 1160 - 1139 - 1116
Targets - 1210 - 1259 - (1300-1335)
Stop Loss at a CLOSE BELOW 1095
SHORT THE RED ZONE (1336-1390) SL behind 1400.
Like and Follow me and you will find this page interesting because I am a TA expert and professional day trader in crypto since 2012 that does daily updates and new posts about the hottest and most discussed coins.
This is as always a delayed post, if you are interested in first hand news, feel free to join our group,
Cheers, TJ

#Bitcoin - #BTC another IH&S - PS.Don't hate me Just sharing what I see on the charts, interestingly it lines up close with our #bearish #BAT idea
I personally missed out on short, I did short form 10290 but took profit at around 87xx then we longed from 8460 & closed at around 9000, Opened a Short trade for auto traders around 91xx but personally didn't, Good thing is I trade on FTX so my collateral is sitting in USD & not BTC, unlike Bitmex.
won't advise to open up a super big position as this idea is based on weekly but who am I to say anyways - just a guy from internet as always you can also use Leverage on FTX, bybit or Bitmex to multiply your profits but remember Leverage Trading is HIGH RISK So is Crypto trading & that's why I am legally obliged to say
#DYOR
remember I am not a financial advisor & this are all just my thoughts :)
make sure to leave a comment & if you agree then hit that thumbs up, Don't forget to check out the telegram channel for timely signals & Autotrade my ideas (i talk more there then here 😜😜
Do not forget to check out other ideas & do share it with your friends :)

[XRPU19][LONG][7X][165.13% ROE] Ripple 7X Lev. (165% ROE)Here is our full trade for Ripple ( XRPU19 ) on BitMEX.
We are using 7X (high leverage) for high ROE.
BitMEX (leveraged) trading is for experienced/advanced traders only.
This is not financial advice. We are sharing our views and opinion for learning and entertainment purposes only.
A trade setup can do good just as it can go bad. Some we win others we lose. If you decide to trade, you do so at your own risk.
We recommend trading altcoins pairs for beginners, margin trading should be done only after you have lots of experience and you have patience as well.
Patience is key.
Thanks a lot for your continued support.
Now, let's take a look at the numbers for our Ripple ( XRPU19 ) trade:
_________________
Pair: LONG XRPU19 (Ripple)
Leverage: 7X
Entry: 0.00002550 – 0.00002670
Time frame: 4H
Targets:
(1) 0.00002700
(2) 0.00002820
(3) 0.00002900
(4) 0.00003110
(5) 0.00003300
Stop-loss: Close daily (1D) below 0.00002400.
Liq. price: 0.00002356
(Buy-in calculated at 0.00002670)
Potential profits: 165.13% ROE
Capital allocation: 6%.
_________________
If you have any questions, feel free to use the comments section below.
This is Alan Masters.
Namaste.

XBT/USD Bitmex. Reasoning.Let me explain the whole situation in details:
1. We fixed above the zone of $3550 - $3560 , so at the first glance, we can start entering the scalp LONG on XBT now.
However, given the weak volumes, we can still fall lower, just knocking out liquidations.
The small fall can also help us to draw a Ruby (reversal pattern) and after that go up.
The first target of this upward movement is the first strong level of the market maker - $3620 ;
The next target is the resistance of the falling channel that we are following - $3650 .
2. On the other hand:
We are still under the MM level , under the mark of $3620 , therefore the LONG from this point can be considered as a very risky trade. Thus, it is easier to open a SHORT position in the zone of $3560 - $3670 with Stop Loss over the resistance of the falling channel in the zone of $3700 or higher . So, we will be able to minimize the risks of losses due to the descending nature of the market, taking a SHORT position at the point where MM usually sell, and placing a SL above the point of a maximum risk mark of MM.
3. I also want to note one interesting point:
After analyzing the charts of the LONGs and SHORTs on the Bitfinex exchange, you can see that neither LONG nor SHORT positions were opened during this dump, which tells us that the MM is still in the SHORT position. That tells us that this dump was triggered by an ordinary major player and was the consequence of a single sale for the market price. Also, if you look at the minute charts on Bitmex and Bitfinex exchanges, you can see that on Bitmex the price steadily went down by X points per minute, and on the Bitfinex exchange for 4 minutes there were both red and green candles, which tells us that the initiator of the dump was the player on the Bitfinex exchange, which confirms our hypothesis.
4. Conclusion: SHORT looks much more profitable here. Sell zone: $3560-$3670. Targets: $3520 - $3470 - $3440 - $3400 - $3370.

Comparing Bitfinex and Bitmex. Whose telling the right story?As we all know by now, there are very close to no points or reasons we should look at Bitfinex's chart.
The chart is broken!
Remember Bitfinex going nuts about two weeks ago?
It scared a lot of us, because not only it was nuts but also that now we have to decide which chart to look at. Because they all tell the different stories now!
Anyways, what can we do about the chart eh?
Based on trend line analysis on Bitfinex's chart, some might say it should be about close to the right time to get back in. (refer to the lighter green trend line)
We can observe a valid trend line indicated in lighter green which might give us a reason to believe.
However, we shouldn't forget that Bitfinex's chart is a complete mess right now. We should be VERRRRRY cautious about whether or not to believe in the lighter green trend line. Because other charts don't agree with what Bitfinex is telling us.
Bitmex for example, darker green trend line is the valid trend line.
According to Bitmex's chart the price now is definitely not the bottom.
At some point prices should (and will) sync in between exchanges so buyers like us have a better and more consistent standard (which is chart!).
If we're talking syncing, the darker trend line on both charts very much shows similar picture.
In conclusion, if you're going in for long, be very cautious (ha, everyone should be anyways ;))
What if you're not?
Stay out and watch it sync or sink!
Boo! world is falling apart these days.
Bitcoin (including some major coins) might have a chance to shine again soon. Big boys need something with a right cause.
p.s. the RSI shows that it will soon move like a bull or a bear not a larva.

The COBRA 4 hour indicates slightly bearish Bias.We are trading in a narrow range, not much to expect here yet.
Observations and NEWS:
Volume is at an all time low, as I see some indications of consolidation. I have noticed on GDAX/Coinbase, some heavy buys on bitcoin, during attempted dumps over the last couple of days.
The Tether situation seems to have normalized, however we are seeing it around 97 cents. There has been a significant amount of tether removed from circulation recently. Keep in mind, that Tether has less impact (especially on non tether exchanges) then the community tends to believe in my opinion.
Ether seems to be weaker then bitcoin in regards to bullish moves.
The 4 hour indicates we will continue to pullback in the near future. We are currently bouncing slightly but I am tar-getting 6350 on bitmex. I warned of a release of the RUBY COBRA yesterday after we topped out at 6450s based on STOCH on the 4 hour indicated overbought, plus a high number of long dominance on bitmex was observed during this period. RSI isn't supporting a breakout YET, so I didn't feel it is time to long at this stage. RUBY COBRA is still in the house until we hit 6350's.
Once target is hit, (could be a couple of days after the stablecoin phase or sooner) 4 hour stoch will be below 30 and we bounce up a little from there, however I expect to remain in a tight range as the Daily Triangle continues to tighten as we travel right.
RSI is in the middle therefore I don't expect a major break of daily triangle just yet in either direction. I recommend watching alts market caps for now.

[May 17th/BITMEX] Bitcoin Trend Analysis $8014 - $8470Hello, guys.
I usually make a script for me and people.
But on today, I am going to analyze how this wave is going.
As you can see, the chart shows that it is still bearish.
Yesterday, it was dropped below 8200 which I was expected.
No one believed my opinion among my "friends" on yesterday.
But it was reached below 8200.
Today, I assume that it gonna be dropped til below 8150/8050.
Of course, it can be pumped. Who knows right?
However, so far, I would say
70% confirmed below 8150
25% confirmed below 8050
5% confirmed below 7900
BTC market is so volatile and weak.
I'm currently playing on BITMEX.
Long position open orders $8113 and $8013. (x10)
Short position $8310 and gonna close $8155. (switching)
If you like this post, please comment or push the like button
If you wanna play on BITMEX, register through it; www.bitmex.com
Thank you so much!
P.S. If you do not disagree, please comment it. I like listening all kinds of opinions.
Have a great day!

LTCZ20 possible shortI have been staying off bitmex a little lately since all the drama around Arthur but slowly edging back into it now after a short stint on binance futures.
Watching LTC closely here for a short term short play.
We have retraced past the 618 and sitting on a significant EQ right now and the MACD looks to have some descent momentum to continue selling further.
Im watching this EQ break for a short position back down to previous low or just above, i may not get to greedy as it could be short lived if BTC gets stuck in the range for any longer.
I will update when the trades active

all targets achieved - Profit: 26% 📈⚡️⚡️ #BTC/USD ⚡️⚡️
Exchanges: ByBit, BitMEX
Signal Type: Regular
Leverage: Isolated (25.0X)
Entry Targets:
1) 9270
Take-Profit Targets:
1) 9360
....
ByBit, BitMEX
#BTC/USD All take-profit targets achieved 😎
Profit: 26.7547% 📈
Period: 1 Days 1 Hours 04 Minutes ⏰

XRP/M20 & XRP/BTC On the lookout for the break ...I have been expecting XRP to start moving up for a week now after first a strong bullish RSI divergence on the daily and hourly timeframes. But as always nothing is certain and the market can stay irrational for a while.
Now there is an even more bullish pattern, a falling wedge and these tend to break to the upside quite strongly.
As I don't trust the XRP chart too much ( without big government/bank adoption the long term looks bearish ) and I know general sentiment in the crypto community towards XRP is quite negative, I would only trade this as a breakout trade. But if it breaks it will move quickly.
The benefit of trading it through a M20 BitMEX derivative Contract is that you can use leverage and increase your Profit/Loss ratio quite a bit, with the stop loss just under the break level the risk is low.
Be careful leverage trading is risky so manage your position sizing accordingly!
If you like my ideas and the work I do, please check out the links in the signature and give me a like ;).

Bitcoin traders, this week's market is just the worstBitcoin can't be trusted right now
If you are a noob, forget this week
If you are a pro-trader, I feel you man. This has been hell
#spiritualtrader #5Dascention #masterthemarket #therealdeal #earikbeann #bertha #naturalcycles #gann #geometrictrading #astrophysics #numerology #sqaureofnine #marketstructure #bitcoin #bitcoinfreesignals #bybitsignals #bitmex #bitmexsignals #cryptocurrency #crypto #cryptotrading #bitcointrading #passiveincome #bybit #cornix

Waiting for the next SHORT to load - Gainz Mastering the MarketIn a down trend we buy the highs and short the lows
This is where I anticipate the next short position to open...
#spiritualtrader #5Dascention #masterthemarket #therealdeal #earikbeann #bertha #naturalcycles #gann #geometrictrading #astrophysics #numerology #sqaureofnine #marketstructure #bitcoin #bitcoinfreesignals #bybitsignals #bitmex #bitmexsignals #cryptocurrency #crypto #cryptotrading #bitcointrading #passiveincome #bybit #cornix

ETHBTC: Swing LongBought ETHBTC as planned at ~0.020. First target I'm looking at is 0.022 btc, and 0.025 btc the next one.
Hit the "LIKE" button and follow to support, thank you.
Information is just for educational purposes, never financial advice. Always do your own research.

#XBTUSD #Bitmex xbt Entered into rangingMarket entered into ranging which side likely to be dominated
Short Side evidence :
1.Should retest weekly support aroubd 6.8k before trending up.
2. Most Oscillators in overbought region .
3.Forming a possible double top on 4h(conformo aftr close blw its nekline)
4. Not much expected volume for a healthy up trend.
Long Side Evidence :
1. Gap on CME around 8.4k region and as history prevails gaps are liked to be filled
2. RSI and Stoch trending up from 50
3. Weekly resistance around 8.2k region
4. Might see end of up trend with a roll over zone arnd 8.4k with then followed by phase IV downtrend


Going long on ETH 25xHere we can see that ETH is about to form a bullish pattern, this can be providing $180 as the new support level, I am opening a trade now on Bitmex for 1% of my total portfolio, the position is long ETH 25x leverage. My SL is put at $170.

Following up - Yesterdays callIf you had followed my analysis yesterday on BTC you can see I had predicted the move up to or above $8500 based on key resistance levels being breached at $8300, as a result of this we have seen BTC reach $8600 plus, my next move is to watch and see if we go back below $8500 it could swing back the other way, other than that I remain bullish for an upward spike, just liquidated all bitmex contracts entered at $8210 exited with 25x leverage at $8615. To join my VIP signals channel contact me directly by DM.
Remember only invest 1% of your portfolio per trade, do not get to greedy that is when you get burnt.

#XBT #BitmexWho sees the wedge?
The whole market sees it, this is a short figure, only now they are making different decisions. It will be wiser to wait for a breakdown in one of the parties, and then enter.
Most take shorts and hide a stop for $ 11,000 - $ 11,250.
access to the Vit channel from the signal
that go to subscribers earn from 10% per month
write in a telegram to the administrator for a subscription @tradingroommmm
according to the POROKH promo code! get a 20% discount
