Ripple (XRPH19) Prepares 15X Leverage On BitMEXCheck your guru before you trust him!
I've been looking at the Ripple ( XRPH19 ) chart on BitMEX after its normal and expected movements... One thing is clear, the weak hands have not yet been removed.
There is a clear set up developing here, more risk after the wild move... Details are on the chart.
Note: This is not a piece of trade advice. My trades all contain buy-in, targets, stop-loss, potential ROE, capital allocation and additional details.
If you want to see a full trade for Ripple on BitMEX ( XRPH19 ), hit like to show your support. If enough people hit like, I will know that there is enough interest and share a full trade.
Thanks a lot for the support.
See you with the full trade.
Namaste.
The time is now.
I'm the guru you have been waiting for!
Here to dethrone the fake gurus that INFEST the main page of tradingview right now.
Help us reach that goal, be couragous, wise, strong, powerful and press like and follow on profile.
Don't trust, verify - GettingAnotherMillion®
Search in ideas for "BITMEX:"

ARTHUR IS NOT A SAINT BUT BITMEX LOST MY BUSINESSTHANK you Arthur Hayes you know our stops and liquidation prices. Casino always wins. I hope bakkt provides a better service come on wall street come in with a legit margin trading service. Ill make it back. IF you didnt start no stuff thered be no stuff Arthur! hahahaha
SHORT BITMEX!!!! I ACTUALLY WANT BITMEX TO OPEN A SERVICE IN THE STATES! BUT A FAIR SERVICE! WE KNOW ARTHUR LIKES HIS CHEAT CODES ON GRAND THEFT AUTO 5 lol he couldnt beat GTA San Andreas on normal so he had to enter cheat codes for unlimited ammo lol.

[BCHZ18] Bitcoin Cash BitMex Leveraged Signal [32.93 ROE]Do you enjoy trading on BitMex?
Here is a leveraged trade for Bitcoin’ Cash for you, we really hope you enjoy it.
Let's get started... Let's trade!
Bitcoin Cash (BCHZ18’) Leveraged (BitMex) Trade by Alan Masters
Trade: Long BCHZ18’
Current Price: 0.0826
Buy In: 0.0819-0.0825
Time Frame: 1 Hour
Leverage: 10x
Current Resistance: 0.0856
Take Profits:
(1). 0.0832
(2). 0.0839
(3). 0.0840
(4). 0.0847
Stop Loss: 0.0809
Profit Potential: 32.93% ROE
Capital Allocation: <5%
Feel free to like, share, comment and follow if you like this trade, and if you want more.
Namaste.

No more "Short Squeeze".. Because Bitmex Funding rate is > 0For people who still think there will be short squeeze soon ( 21 Aug 2018 ) and the price will jump skyrocket like in April 2018, think again.
They already tried to do short squeeze when bitfinex short position was around 36k a few days back but the bull can only pump the price to around 6630$ and then slam down hard.
I think the better indicator to look for the short squeeze possibility is Bitmex Funding Rate.
Because when funding rate is < 0 ==> it's mean people hold short position more than long position.
The far from 0 down, the more of short positions accumulated. ( You can check rate history here coinfarm.online )
And right now, the rate is > 0 and will be 0.01% soon... it's mean that short and long are almost equal. So no more stupid bears will get Rekt in the near future....
==================
I think a lot of weak hand people, noobies or gamblers already got rekt at Bitmex and those people are out of the market ( no money! )
Right now, only some strong and ( a bit ) smart trader left, and no more stupid 50x-100x at the resistant zone so no more Rekt chain reaction....

XRP bitmex pivot point scaping TF 15 Fibonacci Pivot PointXRP bitmex pivot point scaping TF 15 Fibonacci Pivot Point
Try to make limit for bitmex using Fibonacci Pivot Point

EOS: BITMEX LISTING & NOVOGRATZ STATEMENT - PROFIT = 35.13%!!!Our "Crypto Bottom" Trade Indicator has correctly identified a buy in point on the 29th of May 2018.
Using this buy in point and selling at today's peak price as identified by our NEW "Crypto Peak" Trade Indicator, you would have expected to net 35.13% PROFIT!!!
The increase in price may also be explained by positive developments including:
April 6: Release of EOSIO Dawn 3.0 ahead of schedule which introduces improvements in performance (increasing the transactions processed per second to a maximum of 8000 TPS), compression improvements
April 6: Block.one signs $200m Joint Venture Partnership to Accelerate Asia-Focused EOSIO Ecosystem Development
April 19: Bitfinex announces full support for the upcoming EOS mainnet token swap
April 24: EOS Mainnet is expected to launch on 2nd June (33 days).
April 24: eToro (a social trading platform with over 9 million users) has allowed users to buy and trade the EOS token.
May 31 : The EOSIO launches the Bug Bounty Program.
May 31: EOSIO Stack Exchange site is now fully open to the public and community members.
June 2: Block.one (publisher of EOSIO blockchain protocol), and SVK Crypto (an investor in blockchain technologies), announced today that they have partnered to launch a new US$50 million fund to accelerate the growth and development of the EOSIO blockchain ecosystem.
June 1: Block.one Closes Record $4 Billion EOS ICO.
June 2: Block.one releases version 1.0 of its open source EOSIO blockchain software. This software enables businesses to rapidly build and deploy high-performance and high-security blockchain-based applications.
June 2: Block.one launches the EOSIO Developer Portal.
The general uptrend in the crypto markets as well as the positive developments outlined above (in particular, ending of the ICO and release of version 1.0 of its open source EOSIO blockchain software).
(NEW) June 5: Billionaire Mike Novogratz notes he is bullish on EOS.
(NEW) June 6: Infinito Wallet adds support for EOS.
(NEW) June 6: Bitmex lists EOS and EOS futures trading (with up to 20x leverage).
The general uptrend in the crypto markets as well as the positive developments outlined above (in particular, ending of the ICO and its listing on Bitmex).
***The "Crypto Bottom Signal" used in this analysis is included as part of the Crypto Trade Signals subscription.***

XBTUSD Breakout on bitMEXIn order to benefit from the bitMEX Inverse Swap Perpetual markets, We must take full advantage of the Breakouts.
I achieve this by setting 'Stop Market Orders' I set One just north of the ceiling of the 'squeeze' & One just south of the 'Floor of squeeze'
In the scenario we just witnessed I set my Stop market order to LONG bitcoin @ $7439
& set the other Stop Market Order to Short bitcoin @ $7360 ish.
This works in our favor Bcuz regardless the price goes North, It takes our order, If the price drops Well again it takes our order for an easy 100+ point profit...
Cheers,
I hope this Helps clarify my strategy on bitMEX
I use a 1 & 4 hour candel to draw the 'squeeze ceilings & floors OR some call it a 'Flag OR Pinnet' Regardless. Then to set my Stop Market Orders I use the 5 min candel view to get precisely the right entry prices


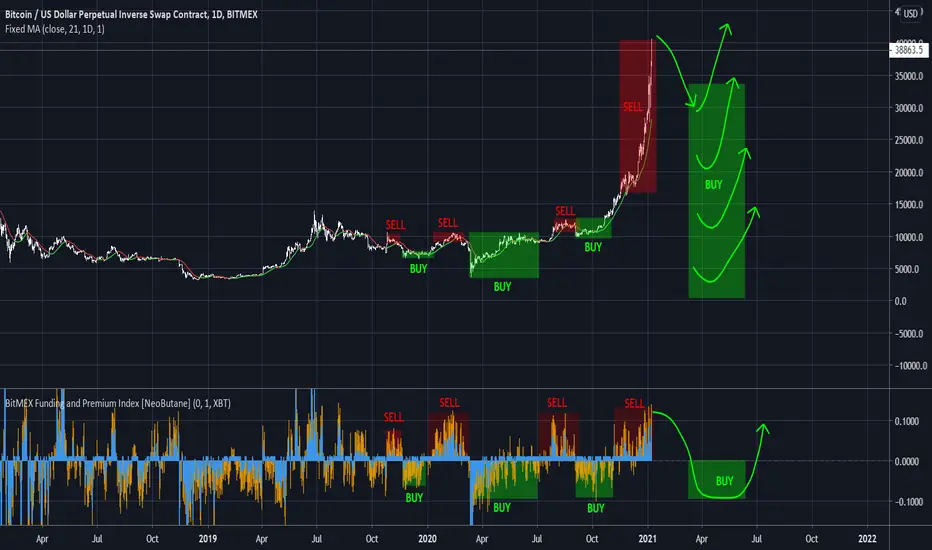
BITMEX - the best indicator in extreme once again !Bitmex funding rate is one of the most reliable indicators I have ever seen. Basically it shows, if traders are in LONG or SHORT. And because most traders are always on the wrong side of the market, this LONG/SHORT ratio is beautiful contrarian indicator. Cycles of greed & fear are constantly changing and right now, we should be on the peak of the "greed" cycle. I won´t buy single satoshi right now, until I see that "fear" on bitmex funding rate. We could only correct down to 30k and maybe there will be bunch of fear, then I will buy at 30k. On the other hand, there might not be any fear even at 20k,10k, then I won´t buy at 20k, 10k and I would wait for lower prices.
Bitcoin Weekly BITMEX 6 hour Bitfinex and Dominance ChartBitcoin Dominance chart on the daily , Bitmex on the weekly and Bitfinex on the 6 Hour . Interesting patterns forming , which way will they break .
Bitcoin halvening has past , how will this make btc react now

ADAM20 Bitmex - 4hr ChartLooking at the 4HR chart for ADAM20 on Bitmex, I've noticed the following;
1) Fib retrace to 61.80% has occurred
2) Higher Low has been made
3) Downtrend line has been broken
4) 4HR Candle close above Mid Boillinger Band
5) Waiting for Higher Higher and Higher Low to be made
6) MacD & RSI looking like buyers are coming in
7) Potential for a nice full retrace to 620 sats if Uptrend continues
First chart published, feedback would be great.

XBTH20 - Bitmex March 2020 Futures CaptureCapture of Bitmex March 2020 Futures data for future reference. Also, just released a new indicator that captures Contango in terms of percentage. Added both indicators for analysis of futures curve in $ value or % value

ETHUSD Bitmex - We want cheaper ETHGreen= 4H lvl
Yellow= Weekly lvl
I'm waiting for 230 - 210 $$ for a long time
PA looks ok to me
This is a bitmex chart so one can not blindly long this lvls although, I will load my ETH bag with more on spot around this prices
As for short positioned traders; watch the PA at 240 - 236 $$

XBTUSD BitMEX Chart Analysis December 26th
Hello.
Hope you had a wonderful Christmas.
Today I am quite overload with my works so my analysis is a bit late.
Please don’t forget to “Follow” me and press “Likes”.
I will begin XBTUSD BitMEX Chart Analysis for December 26th
(Tomorrow the chart will be changed to Bybit)
This is 30m candle chart on Christmas Eve.
I’ve deleted unnecessary parts.
I already explained you on the live streaming so I will be brief on here.
Based on the downtrend signal from $7,700 on 4H candle chart, the price followed route B. Right after touching the weekly CME Gap, a short rebound came up forward.
I already entered short position and my stop loss was $7,481. I planned to keep my position if the price does not touch or just touches $7,481 once or came down with tail.
It was Tuesday with variable and the price suddenly fell.
Congratulations for those who made profits.
This is daily candle chart.
The candle is created right below the middle line of Bollinger band.
And I brought a strategy based on this.
This is 30m candle chart.
I will briefly explain.
1. Please check route A & B with A’s long position / B’s short position entry timing with each price point
2. Route A : Please check the price does not go down below the entry point
(If the price goes down below the orange trend line with an additional candle, please refer to route B)
3. Route B : When you enter short position at the indicated position, please check whether the price goes above the green parallel resistance line. If it goes up with an additional candle, please refer to route A.
4. I also indicated bonus points with blue finger pointer for route A / and red finger pointer for route B. Hope you cope well with it.
The Bollinger band’s resistance line for 4H candle chart is opened. So if the price does not follow route A today, it would very much likely to make a trick of uptrend wave and then suddenly fall.
If it were sudden fall, it would have a chance of rebound.
However, making a detour and then a drastic fall would be quite vulnerable.
We will be on safe zone if the price goes above the final “smile face” line.
Hope you had a good day.
I will come back to you with FX margin trading, overseas futures analysis in the afternoon.
Thank you.
(Translation
Jae Ho Shin)

XBTUSD BitMEX Chart Analysis December 23th
Hello.
Make it simple and make profit.
It’s BitCoinGuide.
Hope you had a nice weekend.
We are already at the end of this year.
Let’s always keep up the good work.
Don’t forget to “Follow” me and press “Likes”.
I will begin XBTUSD BitMEX Chart Analysis for December 23th
This is 30m candle chart for last week.
On Friday we had no particular movement.
The important part was the price does not go down below too much on the weekend.
Then it went over the green parallel line and 4H parallel blue resistance line successively.
It made a bit of a detour and then rose up when the cloud changed from “blue cloud” to “red cloud”.
The price went over the “smile face” line and touched the “bell” line.
This is daily candle chart.
As I explained last week, it went over the parallel resistance line.
So we newly have a daily candle chart’s parallel lines.
And now we have a converging section based on the orange mid term trend line.
As there is weekly CME Gap, the movement will be very important for 2 days.
So I brought a trading strategy quite tight for safety.
This is 30m candle chart for today.
In fact, it is very hard to measure wave pattern and trading strategy right after a drastic movement of a trend.
As a whole, I brought a long position strategy.
To briefly summarize,
1. Please check route A & B with long position entry timing and price point at the right side.
2. Route A: Please check the price does not go down below the entry point. If it does, it will end up drifting sideways.
3. Route B : Please check the final long position entry point (If it goes down below, please check out the price gap for weekly CME market.
This is it.
I’ve indicated bonus points.
Blue finger pointer for route A (short position shortly)
Red finger pointer for route B
Hope you cope well with it.
In case of Altcoins, we will have to consider the correction and weekly CME Gap. Then I will try to operate simultaneously with Bitcoin.
Hope you have a good day.
I will come back to you with FX Margin trading, overseas trading in the afternoon.
Thank you.
(Translation
Jae Ho Shin)

XBTUSD BitMEX Chart Analysis December 20th
Hello.
It’s BitCoinGuide~
Don’t forget to press “Likes” and “Follow” me.
I will begin XBTUSD BitMEX Chart Analysis for December 20th
This is 30m candle chart for yesterday.
As you can see from 30m candle chart, it ended up drifting sideways between route A and B.
On YouTube Live Streaming, I opened long position at the middle line of Bollinger band with tight stop loss and made a little bit of profit.
I waited for long position at the point I’ve mentioned. But it did not come down.
But we have lots of chances for tomorrow.
So don’t be regretful.
This is 4H chart.
I believe a direction will be decided within the colored box.
Currently we are on “red cloud” with MACD Dead Cross coming soon.
I brought a strategy based on this.
This is 30m candle chart for today.
I will briefly summarize.
1. Please check route A & B with A’s long position / B’s short position entry timing and price point of $7,150.
2. Route A : Please check the price does not go down below the entry point. If it does, please refer to route B. When you have entered the position, please check the price touches the final “smile face” line. If it leaves tail with just one touch, please switch into short position. Also, if the price does not make it to the blue parallel resistance line for 4H candle chart, switch into short position.
3. Route B : Right at the short position entry point, please check if the price goes above the green parallel resistance line. If it does not make it, please enter short position.
This is it for today.
I’ve indicated bonus points with blue finger pointer for route A / red finger pointer for route B. For those who can cope with it, please take advantage of the opportunity.
If we reach the point where the bell is located, or the price seems to move upward, you can simultaneously operate major altcoins on the weekend.
I will come back to you with FX margin trading and overseas chart analysis in the afternoon.
(Sorry for yesterday as I was so tired)
Thank you.
(Translation
Jae Ho Shin)

XBTUSD BitMEX Chart Analysis December 19th
Hello.
It’s BitcoinGuide.
Don’t forget to press “Likes” and “Follow” me.
I will begin XBTUSD BitMEX Chart Analysis for December 19th
This is 30m candle chart for yesterday.
I’ve mentioned several times about this pattern comparing with that of December 4th
Along with route B, it first came down and made the wave pattern following the red arrow.
From the long position entry point of route B, it passed the route A.
At the blue finger pointer area, it consistently went up, filling up the gap and ended up at the final blue parallel resistance line.
It was about $1,000 profit.
Congratulations.
This is daily candle chart.
If we breakout the blue parallel resistance line, we have orange mid-term resistance line.
We have two blue parallel lines and if we breakout the first one, we will have to face the next uptrend parallel line.
We are currently at the middle line of Bollinger band.
I brought a strategy based on this.
This is today’s 30m candle chart.
I will briefly summarize,
1. Please refer to route A & B with A’s long position entry timing / B’s short position entry timing with price points.
2. Route A : Please check the price goes down below the entry point. If it does, please follow route B. If the price goes up, you should check the price touches the final “smile face” line. If it leaves a tall shadow with one touch, or without a touch, please operate short position.
3. Route B : Please check $6,945 long position entry point. If it goes down with an additional candle, please call it a day with no position. If it rebounds, please check the price goes above the green parallel resistance line. Then it would be considered switching into route A.
Please check out the blue and red finger pointers where you can take advantage of in real time basis.
Regretful to say but, today I may not be able to upload FX margin trading, overseas trading analysis.
Hope you understand and have a good day.
Thank you.
(Translation Jae Ho Shin)

XBTUSD BitMEX Chart Analysis December 18th
Hello,
it’s BitcoinGuide.
Don’t forget to press “Likes” and “Follow” me.
I will begin XBTUSD BitMEX Chart Analysis for December 18th
This is 30m candle chart for yesterday.
I’ve deleted unnecessary lines.
It seemed like there will be a trick as it was Tuesday.
It ignored route A and B wave pattern. Rather, it newly made a wave at a delayed point.
If the price becomes very steady, ignoring the A & B wave pattern, the indicated routes are invalidated.
At A long position entry point, the cloud changed into “red” cloud in 15m candle chart.
Right after, the price drastically fell.
As I explained yesterday, price fall in the midst of cloud’s turning point tends to be severe.
According to the situation, I entered long position and coped with it in real time basis.
For those who could not participate for the live streaming, I’ll explain one more time.
After opening position, the price went over the orange trend line. Target point was $7,000 at maximum, and stop loss for $6,860.
The price went over the orange trend line, however, reached to the stop loss point(suspicious movement).
Then the price suddenly dropped precisely from the red finger point. It was about $300 fall.
The timing of creating a wave pattern via route B was delayed. By making a detour, rather the downtrend channel was reinforced.
Each route strategy was invalidated and the price heavily fell.
This is weekly candle chart.
We newly have blue parallel supporting and resistance line for daily chart. And please refer to the below red supporting line / and $6,020 price point.
Yesterday’s downtrend wave ignored the middle line of monthly candle chart and once again strongly fell.
I brought a strategy based on this fact.
Today’s strategy.
It is 30m candle chart.
To briefly summarize,
1. Please check route A & B with long position entry timing and price points
2. In case of route A, please check if the price goes down below the entry point. If it does please refer to route B.
If the price does not touch the final “smile face” line above, and shows a suspicious movement including tall shadow, please switch into short position (please check the blue finger pointer)
3. Route B : please check long position entry timing and price point.
If we see a rebound from the entry point, please refer to red finger pointer. (Recently there has been frequent downtrend pattern with this kind of a trick).
If the price goes above green parallel resistance line, please follow route A.
Also check out the converging triangle for green parallel line and blue supporting line.
There are no such uptrend and downtrend without a reason.
Especially, in case of downtrend, it firstly makes a short uptrend and creates a position. Then a heavy fall comes after, you should be careful for it.
(Long position is quite different)
Above all, the downtrend seems strong, so I hope you could operate your long position in short term basis.
This is it for today.
I will come back to you with FX margin trading in the afternoon.
Thank you.
(Translation Jae Ho Shin)

XBTUSD BitMEX Chart Analysis December 17th
Hello,
it’s BitcoinGuide.
Hope my analysis is helpful for you. And if it is, please don’t forget to press “Likes” and “Follow” me.
I will begin XBTUSD BitMEX Chart Analysis for December 17th
This is 30m candle chart for yesterday.
It was long -> short movement.
If you look at the left point, the price suddenly fell before the entry timing.
And it was a variable.
If the price dropped to $7,035 once again, then the wave could have a power to possibly rise until the top of weekend CME gap.
With lack of power, price dropped from the finger pointer at the right side.
(I’ve mentioned several times about entering short position, and I believe you must have made profit this time)
So congratulations for those who made profits.
This is monthly candle chart.
Unfortunately, we have reached the point where I hoped I wouldn’t see.
Please refer to the point.
I brought a strategy based on this factor.
Today’s strategy.
It is long position strategy, and we have 30m candle chart.
I will briefly summarize.
1. Please refer to route A & B with long position entry timing and price points.
2. In case of route A, please check if the price goes down below the entry point / If it does, please refer to route B. If you make it to enter long position, please check whether the price reaches green parallel resistance line and finally “smile face” line.
If the price does not make it to the resistance line, please refer to the blue arrows for your additional switching points.
3. When the price follows route B, please check long position entry timing and price points.
If the price goes down below $6,760, please call it a day with no position.
(I’ve made this point a long position because we have a strong possibility for a strong rebound)
Please look at the red finger pointer. If the price does not lose its power and supports well for this level, it would go straight up to the route A.
This is it for today.
Today is Tuesday when we frequently see a twist.
However, due to the fact that the price strongly dropped just like last week, we need some time to wait for a rebound until the weekly CME Gap point.
So, please consider there is pretty much chance of just drifting sideways. Hope you cope well with it.
I will come back to you with FX margin trading in the afternoon.
Thank you.
(Translation Help
Jae Ho shin)

XBTUSD BitMex Chart Analysis for December 12th
Hello.
It’s BitcoinGuide.
If my words are helpful, don’t forget to “Follow” me and press “Likes”.
I will begin XBTUSD BitMex Chart Analysis for December 12th
This is 30m candle chart for yesterday.
It followed route B except the last tall shadow.
Important part was the point when the price could not touch the B long position entry point.
It was a bit delayed and when it touched the price, it suddenly went up and down.
In 30m candle chart, the movement was between the resistance and supporting line. So it was in consolidation. The wave which should have come out yesterday was delayed and came out suddenly today morning.
As you see the red finger point for short position ($7,352.5), I’ve mentioned this additional information in our private member’s room.
It precisely touched the “smile face” line once, and came back to where it belonged.
Recently, there has been too much tricks and long consolidation period.
But I also made profit for $21 movement.
Congratulations for those who earned in this difficult period.
This shows monthly candle chart.
Please refer to $6,850 that I checked for your reference.
Today’s strategy.
It is 30m candle chart.
I will briefly summarize the major information.
1. Please confirm route A & B with A’s long position entry timing / B’s short position timing with each price point.
2. In case of route A, please confirm whether the price does not go down below the entry point.
If it does, it is highly likely to go to route B / If you manage to enter route A long position, please check the price goes above the “smile face” line.
(if the price breaks the point of 30m candle chart’s parallel line and 4H candle chart’s line continuously, it would cause a huge price shooting)
3. Please confirm the first long position entry point for route B. After, check short position where the route A and B meet. (If the price does not have power to break out this point, please enter short position)
4. If it follows route B, please put limit price on $6,834 for long position. It is very likely to see a strong rebound from this point.
This is it for today.
Hope you have a good day.
I will come back to you with FX, overseas futures analysis.
Thank you.
(Translation Help
Jae Ho Shin)

December 12th XBTUSD BitMex Chart Analysis
Hello.
It’s BitcoinGuide.
If my words are helpful, don’t forget to “Follow” me and press “Likes”.
I will begin XBTUSD BitMex Chart Analysis for December 12th
This is 30m candle chart for yesterday.
It followed route B except the last tall shadow.
Important part was the point when the price could not touch the B long position entry point.
It was a bit delayed and when it touched the price, it suddenly went up and down.
In 30m candle chart, the movement was between the resistance and supporting line. So it was in consolidation. The wave which should have come out yesterday was delayed and came out suddenly today morning.
As you see the red finger point for short position ($7,352.5), I’ve mentioned this additional information in our private member’s room.
It precisely touched the “smile face” line once, and came back to where it belonged.
Recently, there has been too much tricks and long consolidation period.
But I also made profit for $21 movement.
Congratulations for those who earned in this difficult period.
This shows monthly candle chart.
Please refer to $6,850 that I checked for your reference.
Today’s strategy.
It is 30m candle chart.
I will briefly summarize the major information.
1. Please confirm route A & B with A’s long position entry timing / B’s short position timing with each price point.
2. In case of route A, please confirm whether the price does not go down below the entry point.
If it does, it is highly likely to go to route B / If you manage to enter route A long position, please check the price goes above the “smile face” line.
(if the price breaks the point of 30m candle chart’s parallel line and 4H candle chart’s line continuously, it would cause a huge price shooting)
3. Please confirm the first long position entry point for route B. After, check short position where the route A and B meet. (If the price does not have power to break out this point, please enter short position)
4. If it follows route B, please put limit price on $6,834 for long position. It is very likely to see a strong rebound from this point.
This is it for today.
Hope you have a good day.
I will come back to you with FX, overseas futures analysis.
Thank you.
(Translation Help
Jae Ho Shin)

XBTUSD BitMex Chart Analysis December 11th
Hello.
“Make it simple and make profit”, It’s BitcoinGuide.
Please “Follow” me and press “Likes”.
I will begin XBTUSD BitMex Chart Analysis for December 11th
This is 30M candle chart for yesterday.
I deleted unnecessary lines.
It moved along with route B.
On the live YouTube broadcasting, I’ve explained you the chart would fall after a very weak rebound. And the fall happened precisely at the point I’ve indicated with the finger.
We missed the long position, but congratulations for those who made profits.
Today I brought a strategy based on “Blue cloud” and “MACD” of 4H candle chart.
We have to see when the MACD “Golden Cross” comes out and whether the price perfectly breaks out the “Blue cloud”
This is today’s strategy.
To briefly summarize,
1. Please check route A & B with A’s long position timing / B’s short position timing with price points.
(The entry point for A and B is the major location where the route might cross over.)
2. In case of route A, please check the price does not go down below the entry point with an additional candle. If it does, please check route B / Also check out the short position entry point above / When the price goes over the “smile face” line, we are at the safe zone.
3. When it comes to route B, please check long position entry timing and price point. Afterward, keep your position until you confirm the price goes above green parallel resistance line with an additional candle / If it does, follow with route A.
Please also refer to the price for each entry point at the right side.
For today, it does not seem to have a strong wave, and the direction is not perfectly set. So please wait with patience and I recommend you to do day-trading.
This is it for today, I will come back to you tomorrow at this time.
Thank you.
(Translation help
Jae Ho Shin)

December 11th XBTUSD BitMex Chart Analysis
Hello.
“Make it simple and make profit”, It’s BitcoinGuide.
Please “Follow” me and press “Likes”.
I will begin XBTUSD BitMex Chart Analysis for December 11th
This is 30M candle chart for yesterday.
I deleted unnecessary lines.
It moved along with route B.
On the live YouTube broadcasting, I’ve explained you the chart would fall after a very weak rebound. And the fall happened precisely at the point I’ve indicated with the finger.
We missed the long position, but congratulations for those who made profits.
Today I brought a strategy based on “Blue cloud” and “MACD” of 4H candle chart.
We have to see when the MACD “Golden Cross” comes out and whether the price perfectly breaks out the “Blue cloud”
This is today’s strategy.
To briefly summarize,
1. Please check route A & B with A’s long position timing / B’s short position timing with price points.
(The entry point for A and B is the major location where the route might cross over.)
2. In case of route A, please check the price does not go down below the entry point with an additional candle. If it does, please check route B / Also check out the short position entry point above / When the price goes over the “smile face” line, we are at the safe zone.
3. When it comes to route B, please check long position entry timing and price point. Afterward, keep your position until you confirm the price goes above green parallel resistance line with an additional candle / If it does, follow with route A.
Please also refer to the price for each entry point at the right side.
For today, it does not seem to have a strong wave, and the direction is not perfectly set. So please wait with patience and I recommend you to do day-trading.
This is it for today, I will come back to you tomorrow at this time.
Thank you.
(Translation help
Jae Ho Shin)
