Short DASH/ETH BITTREXIf this area is broken, the market trend will be down.
waiting to buy in zone 2
Search in ideas for "BITTREX:"

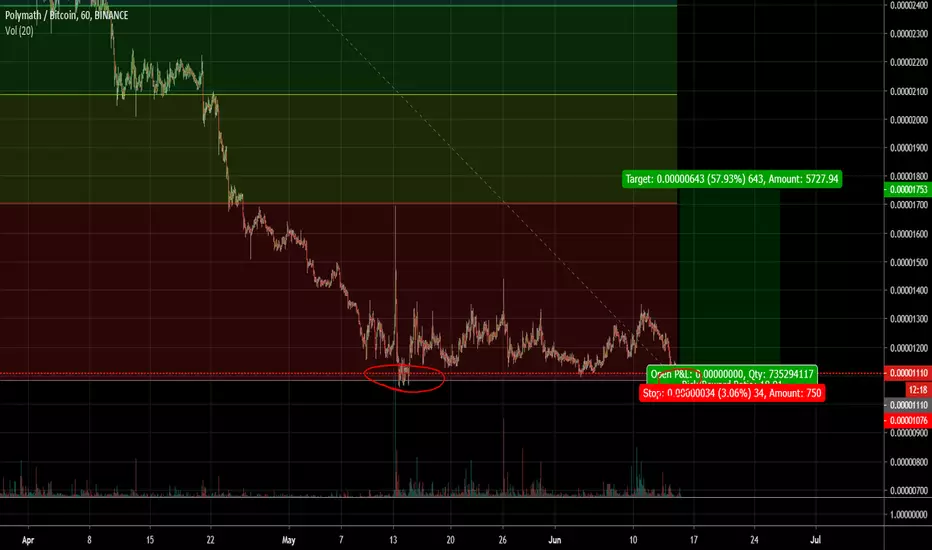
$POLY touching support again, double bottom, should go upI consider this as a high risk trade, because of BTC dominance we might see a low-price action, or maybe neutral, BUT! We're at a double bottom.
With Binance/Bittrex US regulations, $POLY is a few of the coins that fits right into these regulations and can be trade by anyone, anywhere, so, more buyers.
Playing this with a tight SL.
DYOR, and trade safe.

LOOM Hits Support, Will It Bounce? Altcoins Market AnalysisLoom Network is bouncing from very strong support, marking a triple bottom. But, will LOOMBTC be able to move up from here or will it go lower?
Feel free to hit like to find out, and let's continue with this chart analysis.
Before we get started, let me clarify a small detail. We call altcoins all the alts that are available for trading on Binance, Bittrex, Poloniex, HitBTC, Huobi, KuCoin, and all other exchanges with the exception of CoinMakertCap Top10. These Top 10 we call by name, like Bitcoin, Ethereum, Ripple, etc., rather than naming them just "altcoins".
There are thousands of cryptocurrency projects that fall in the category of altcoins and most of these altcoins have very low market cap. compared to the Top 10. So these move differently, so we label them in different categories.
So when you see me mentioning "Altcoins", I am talking about all these medium and small-sized cryptocurrency/altcoins projects, such as the ones I write about in this channel.
Now, getting back to Loom Network (LOOMBTC) and this chart analysis...
Will it move up from here?
What about the rest of the Binance altcoins that are bouncing on support?
The market is waiting to see how Bitcoin (BTCUSD) will move, will it continue up or fall.
The conventional mindset is set on the fact that the altcoins most drop if Bitcoin drops, but this doesn't have to be the case.
Altcoins drop when Bitcoin drops if the market is in a full bear cycle, but in a bull cycle, the altcoins rise when Bitcoin drops; why is that?
As the market enters a bull cycle and the altcoins have huge potential for moving up, when money leaves Bitcoin it flows to the altcoins.
So if we are to enter, or entering, a bull cycle, we can expect to see something different this time around.
This time around we might see altcoins make a big jump when/if Bitcoin drops, if the market is to turn bullish long term (bull market).
If we are going to see a continuation of the bear market, new lows for Bitcoin and altcoins as well, then you can expect the altcoins to drop if Bitcoin also fails.
What's your take on this perspective?
Share your thoughts in the comments section below.
Thanks a lot for reading.
This is Alan Masters.
Namaste.

[LONG][LTCM19][7X][142.1% ROE] Litecoin Signal @alanmastersHello my dear Litecoin trader, please allow me to share this trade with you as promised... Thanks a lot for the amazing support.
But before we get started, let's remind us of a few points:
TIPS TO BECOME A BETTER TRADER
Always diversify: Split your money between several different trades.
Have a plan: Plan your strategy before you start trading.
Have patience: Always breath deeply and think before taking any action. If one opportunity goes, another one comes.
Be grateful: Always be grateful for your earnings/profits. Take your money and use it for your own growth, good and betterment.
Read Alan Masters: Your support is highly appreciated.
General guidelines and tips for Alan Masters BitMEX trades
Please remember that this is for experienced/advanced traders only, not beginners; Binance, Bittrex, Poloniex and such for beginners.
This is not financial advice.
All information shared on this channel and/or by Alan Masters is intended for learning and entertainment purposes only. This is not financial advice.
IMPORTANT TRADING TIPS FOR LEVERAGED TRADES
Secure your profits. Sell 50% of your holdings on the first target to secure profits.
Secure your trade. Raise stop-loss above buy-in price after hitting the first target.
The above tips are valid for all of our BitMEX trades. These rule of thumbs can be used to maximize profits.
I will be sharing more tips in my next article... Trade below.
Remember to hit like.
----------------
Trade: LONG LTCM19
Leverage: 7X
Buy-in: 0.01271 - 0.01336
Time frame: 1D
Targets:
(1) 0.01391
(2) 0.01471
(3) 0.01520
(4) 0.01600
Stop-loss: Close 1D candle below 0.01222
Liq. price: 0.01160
(Buy-in calculated at 0.01330)
Potential profits: 142.1% ROE
Capital allocation: 5%.
----------------
Thanks a lot for reading.
Namaste.

Halimsk Special BITTREXFAQ'S
-----
Can this indicator make me rich or guarantee income in every trade?
No. Purpose of indicator is to give you 80-90% idea of how the market is going to perform. While trading you have to follow strict Risk/Reward Ratio.
Overall it will give you profit, you can use other indicators with it too.
Anyone who guarantees you will make money, is pretty much guaranteeing that you will lose money. Trading and technical analysis is extremely difficult, it takes patience, discipline and most people do not make it. Applying these tools and investing in your trading education can help put the odds in your favor but will only assist the individual in their execution, decision making, thought process and executing their own individual trades, NOT make them for you.

BTCUSDT Bittrex 1D chartBTC USDT Bittrex 1D chart shows a hidden bearish divergence (purple line) also we have a rising wedge and that is a sign of reversal pattern. Major support between 6500 and 7000 USDT, once we get there the chart will look very bullish again, there will be a hidden bullish divergence (green line). BTC will gain power for next leg up to 9000-10000 USDT.

Tierion (TNTBTC) Goes For 270%+ Profits In Just 2 Days! (More ToBitcoin SV is not the only altcoin doing massive numbers, it printed a 131% profits candle yesterday... You can see it here:
Tierion (TNTBTC) has gone above Bitcoin SV (BSVBTC) and generated over 270% profits within 2 days... This is the type of bullish action we see right when we enter a bull market, that is for cryptocurrency/altcoins.
Bitcoin grew by 150% within just 90 days. We mentioned many times that altcoins would grow when Bitcoin stops or retraces. So many people claimed this wasn't going to happen and that the alts would fall, but instead, if you look at Bittrex, Binance, Poloniex, HitBTC and other major exchanges, all of the altcoin market is exploding to the bull side, exactly as we predicted.
Seeing the bullishness Bitcoin was going through, based on past experience and market cycles, we clearly saw money entering the market which would later flow to altcoins rather than leave. And this is the confirmation for me that the bull market is here for cryptocurrency. If we were bearish, altcoins would drop when Bitcoin drops, instead, Bitcoin didn't really drop, it only stopped and all the altcoins, major and minor, started to move up.
Today's massive bullish from Tieron (TNTBTC) can be taken as another signal and confirmation that the bull market is starting now... This is just the beginning.
Note: Yes, there will be retrace, correction, periods of bear action, this is normal. We have small cycles within bigger cycles. But we are looking at creating higher highs and higher lows (bull market), which would signal a complete change of trend compared to early this year and last year, when everything was lower lows and lower highs (bear market).
What's your take on this bullishness we are seeing within the cryptocurrency market?
Are you on the bull side yet?
Of course, we are at the apex of change... Expect massive growth in the years ahead for the cryptocurrency market.
Study now.
Prepare now.
Be ready BEFORE the real action starts.
Patience.
Then enjoy massive wealth.
Thanks a lot for reading.
Remember to hit like.
Namaste.

[MOBIBTC](120%) Mobius Starts To Move, More To ComeMobius (MOBIBTC) just made a strong move on Bittrex after hitting a new all time low. Looking at this chart, it tells me that this pair can do more.
This move is just starting so there is a high probability of additional bullish action, here are the targets.
MOBIBTC Targets
(1) 0.00000328
(2) 0.00000412
(3) 0.00000473
(4) 0.00000550
Stop-loss: Close below 0.00000191 on the daily time frame.
Feel free to hit like if you enjoyed this post.
Namaste.

DigiByte (DGBBTC) Wakes Up (1360% Profits Potential To ATH)DigiByte (DGBBTC) just woke up after a long, long sleep. This altcoin is one of the first to be created and a complete classic.
It normally holds really strong (no new low) and it tends to go up strong when in bull mode.
Feel free to hit like now and let's get started with this analysis... Thanks a lot for your continued support.
Let's take a closer look at the chart:
Here we have a Doji on the weekly time frame, coming up at the bottom of a trend. A clear trend reversal signal if you go by candlestick reading. Still, a few parameters need to be met but this is the signal.
We are looking at a high volume bar on a Tuesday, this is the weekly time frame we are looking at and the week is only getting started. So this week can end up being a really high volume week. We can end up with something like the highest volume in a week since July 2018.
Next is the RSI, it hit its lowest ever. Notice that DGBBTC has been available for trading on Bittrex since late 2014... So the lowest ever is quite a feast. Here you can see the chart:
This also leads to what is called "hidden bullish divergence"... I'll leave the explanation for another time.
These signals are enough for me. What about you? Is there anything that you want to share with us? Use the comments section below... and remember to hit like to show your support.
Thanks a lot for reading.
You are Divine, in every meaning of this word.
Namaste.

New Data Currency on BittrexThere is a bullish falling wedge and divergence on price and RSI, expect this to retest 38 satoshis soon.

BTC/USDT - bittrex
I just started posting at tradingview for 3 weeks, and i already have 18/20 chart done target. And now let's start with analysis . Great Ichimoku kinkohyo Guys
Based on our previous post, we will continue to follow bitcoin
My previous post: www.tradingview.com
Follow me for more update

Selfkey Gains Momentum (Important Altcoins Market Update Inside)We are now seeing Selfkey (KEYBTC) breaking above resistance with good momentum and I expect additional bullish action in the weeks to come from this altcoin.
We can look at all the classic signals if you like, like the MACD bullish crossover and bullish RSI, but instead I want to call our attention to something completely different today, and this is something that is just a small detail but can surely help you gain more profits, faster, on your next choice of trade...
So feel free to hit like now, and let me share with you what is on my mind today.
We had a very strong bullish wave that lasted from February all the way to early April, and we enjoyed massive profits from a large number of altcoins mainly on Binance and Bittrex, but there were a few pairs that didn't make it to the top, instead of making big numbers, they had a small jump and then started to go back.
One example is DENT (DENTBTC), this one didn't make it up, but was the first to move last week.
Now we are looking at Selfkey (KEYBTC), this is the pair that is now giving us the best earnings and profits.
There are more examples, of course, this pattern is showing that those that didn't move on the last wave, can be first to move on the next one come.
So we will be looking at pairs such as NPXSBTC, SCBTC and more. If you are agree with this trade idea, make sure to hit like to show your support.
This is Alan Masters, and I am always sending out massive blessings when sharing with you through these words.
Thanks a lot for reading, from me you can always expect more.
Namaste.

[PALBTC](38%)PAL Network About To Hit Demand Zone
PAL Network (PAL) Overview
PolicyPal Network is a platform built with a twofold vision of addressing key issues that overlap the fields of both insurance and cryptoassets in the world today.
PAL Network is a token based on Ethereum blockchain.
PAL Network (PALBTC) Chart Analysis
I am looking at PAL Network on the request of one of our great followers and the charts are looking good ready to generate some profits, please allow me to show you. Full chart for PALBTC on Bittrex above:
Beautiful and easy to read chart. The green zone at the bottom is our “demand zone”. Notice how the price jumps each time this area is tested.
PALBTC is reaching this demand zone and the signals are starting to show for a bounce here.
We can see the MACD curving, volume going lower and descending RSI.
The price bounced at 100 satoshis but the fact that PALBTC is trading below EMA10 can tell us that it can go lower. So we can buy at the current price and wait or place a limit buy order in our demand zone thinking of future profits… As usual, this is will be a very low-risk but high rewards trade.
Let’s get to the trade.
PAL Network (PALBTC) Trade by Alan Masters
Buy-in: 92 - 105
Targets:
(1) 113
(2) 126
(3) 136
Stoploss: Close weekly below 81.
Capital allocation: <5%.
THAT’S HOW LIFE WORKS
Events in life are not to be labeled as being good or bad, right or wrong.
Each experience brings something with it for everybody and is complete on its own.
Next time something strange, different or rare happens, just remember that’s how life works.
Take the blessings from this experience, not by judging or feeling sorry for yourself, but by being happy that you were there and actually involved.
That’s the beauty of life, everything that goes around us and happens around us, is essentially part of us.
Namaste.


BURSTCoin 78%+ Breakout, Multiple Resistances Taken Out!BURSTCoin (BURSTBTC) just printed a massive green candlestick on the daily chart. This is the highest volume BURSTBTC has seen since July 2018. This break managed to take out EMA50, EMA100, and EMA200. BURSTCoin price stopped short of reaching EMA300 (gray line).
The RSI is at its highest since December 2018 and it is going to reach the highest today since the 2017 cryptocurrency market bull run.
You can expect additional bullish action coming from BURSTBTC in the weeks to come.
Feel free to hit like to show your support.
Bittrex altcoins are moving ahead of the rest of the market, you can read more about it here:
Namaste.

Cred (LBA) Is Doing Great Numbers, But Can Start FallingCred (LBABTC) has been doing great numbers on Bittrex, the chart is pretty impressive, but it might be reaching a top.
Feel free to hit like now so that we can get started, if you want to, and let's take a look at these signals together...
Cred (LBABTC) Chart Analysis
LBABTC hit peak price (all-time high) on the 10th April, on a big green candle and high volume bar. It has continued to grow steadily but without being able to challenge again this peak.
The MACD peaked on the 14th April, marking bearish divergence compared to LBABTC's price. The MACD moves higher while prices are moving lower.
Trading volume has been decreasing on the last green candles, momentum is leaving the side of the bulls.
The MACD histogram is moving in favor of the bears.
The RSI is really strong and the price remains trading above EMA10.
So overall we have a very bullish chart which is starting to show early bearish signals. So there are big chances of LBABTC starting to retrace.
If LBABTC remains above EMA10 (green line), it maintains its bullish potential, but if instead LBABTC breaks and closes below EMA10, with good strength and volume, you can expect a strong retrace to happen that can push the price down to EMA50 at the least or lower.
This analysis is shared exclusively for my Trading View readers, followers, and amazing supporters and is intended for learning and entertainment purposes.
Thanks a lot for reading...
Make sure to hit like if you enjoyed this post.
This is Alan Masters.
Namaste.

Crowd Machine Seals Its Bottom, Breaks To The Upside (1500%+)Crowd Machine (CMCTBTC) just had a very strong breakout today which completely removed EMA10 as a resistance for this altcoin pair.
We are looking at the biggest volume bar ever, and the RSI is the highest and strongest since this altcoin was introduced to Bittrex late June last year (2018).
Now challenging EMA50 (magenta line), CMCTBTC is showing huge profits potential for long term growth.
We are looking at 1500%+ by aiming at July's 2018 peak. All the additional details are shared on the chart.
If you decide to trade this altcoin, please allow time for the charts to fully develop. We are looking at huge potential here but it can take several months for the price to start moving to the upside.
Remember our first tool for trading... PATIENCE.
Patience is key!
DO MORE WITHOUT DOING
By taking time out, you can do more.
By resting, you can do more.
By breathing, you can do more.
By being, you can enjoy more.
You can do, feel, be and experience so much more without doing anything, other than dedicating more time, love and energy to yourself.
Love yourself more… That’s how you can do more without doing.
Namaste.

TTCBTC a hort short term opportunity to make profitCurrent situation at the Bitcoin market brings a nice volatility to alts market. Many coins start to grow rapidly. Market scan revealed that TTC gains momentum for a good run.
There is a technical study of 1 and 12 hours timeframes. We can see that the price touches the support level and bounces while indicators are bullish. More thorough analysis of market players behavior reveals a three drives pattern in a parallel channel. With a subsequent volume increase there should be a significant breakout soon. Bullish divergence of price action and price oscillator confirms the forecast
Signal information
Position: TTC/BTC
Exchange: Bittrex
Duration: Short term
Risk level: Medium
Buy zone:
0.0000221-0.0000240
Sell targets:
0.0000257
0.0000269
0.0000284
0.0000304
Stop loss:
Below: 0.0000213


Litecoin (LTCM19) SHORT BitMEX (Up to 113.9% ROE at 10X)I am looking at Litecoin (LTCM19) on BitMEX.
It had some really awesome bullish action, together with the entire cryptocurrency market... We love this bullish action and there is more coming in the near future.
After a wave up, comes a wave down.
A am looking at an exhausted MACD and RSI.
A classic ABC correction after the first peak was hit, so the retrace can resume now.
A break below EMA10, this signal is yet to be confirmed (4H candle is yet to close).
the last candle is displaying growing bear volume.
These are just a few of the signals that I am seeing right now which tells me that LTCM19 might retrace further... This is not a piece of trade advice, this is a chart analysis. All the details on the chart.
All of my trades contain buy-in, targets, stop-loss, profits potential (ROE), capital allocation, and much more.
Trading on BitMEX is for smart, robust and highly experienced traders only. If you are a beginner, make sure to start trading in exchanges such as Binance and Bittrex, there is no liquidation there and just too easy and profitable, the only tool needed to profit is patience.
Trades can generate great fast easy profits, just as they can generate a loss. Intermediate and advanced traders are quite familiar with this. If by any chance you believe that trades can only go right, please start with non-leverage trading as it will be better for your mind and money.
Feel free to hit like if you would like to see a full trade for LTCM19. If this trade idea receives more than 150 likes, I will share this trade with over 110% ROE (normally develops fully within a few days).
Thanks a lot for reading.
Namaste.


[BLTBTC] Bloom Chart Analysis Bittrex (+153% Profits generated)Bloom (BLT) Overview
We are bringing credit to the modern age. Bloom is a blockchain solution for secure identity and credit scoring. Bloom gives consumers ownership over their identity and financial data. By decentralizing the way that information is shared between untrusted parties, the system reduces risk of identity theft and minimizes costs associated with customer onboarding, compliance and fraud prevention.
Bloom (BLTBTC) Chart Analysis
Daily chart:
Bloom (BLTBTC) is looking beautiful on the chart with a high volume breakout above EMA10 and EMA50.
The next resistance to break is EMA100 marked with a blue line.
We have a massive increase in volume as well as a super bullish RSI.
The MACD is on the bullish zone and shows plenty of room left available for growth.
With the bullishness we are seeing in the altcoins market, something we haven’t seen in over a year, this is an easy trade set up.
Bloom (BLTBTC) Targets
Buy-in calculated at 0.00001100
Targets:
(1) 0.00001590 -Reached 30-March (+44%)
(2) 0.00001720 -Reached 30-March (+56%)
(3) 0.00002010 -Reached 1-April (+83%)
(4) 0.00002380 -Reached 1-April (+116%)
(5) 0.00002790 -Reached 3-April (+153%)
Stop loss: Close weekly below 0.00000600.
Capital allocation: <5%.
SOMETIMES YOU HAVE TO FIGHT TO GET IT
When we are in the spiritual path and move with the flow, everything hard is left behind, we learn to be good at moving on.
But it is important to understand when it is right to persist, to fight to get what you want.
Somethings are necessary, the hardships represent the challenges and are there to test if this is something that you truly want.
Keep on going, keep trying, until your heart’s content.
In the end, the results will tell you, if you are being hard headed or if all the hardship was a test.
Namaste.
