GOLD GLD Proxy Potential $192-$197 retracement then rise!Explore the latest update on GLD Gold, featuring insights into our bullish outlook for the intermediate to long term, alongside expectations of short-term corrections. GOLD GLD Proxy Potential $192-$197 retracement then rise! Learn more about potential price levels and strategies by checking out CandlestickNinjaTV on YT!
Search in ideas for "CANDLESTICK"

My idea for BIDUNASDAQ:BIDU
A shooting star followed by a red candlestick. A reversal show for a short term. Might go down within Fibonacci labels. Waiting for a reversal candlesticks for the next week. Let the waiting begins.

Evening StarDuring an uptrend, the market builds strength on a long white candlestick. The second candlestick trades within a small range and closes at or near its open. This scenario generally shows an erosion of confidence in the current trend. Confirmation of the trend reversal is the black third candlestick. A gap between the second and the third bodies is not a must.

USDJPY rejects bullish trend line, faces resistanceThe USDJPY pair tested a yearly bullish trend line and was quickly rejected. There may be a candlestick formation called a "shooting star" on the daily time frame, and a reversal candlestick pattern formed on the 4-hour chart, ending with a bullish engulfing candle. Based on the above, the price is likely to rise to touch the weekly bearish trend line, which is also the location where the 38.2 Fibonacci level and the 50-period moving average on the 4-hour chart meet. However, we may see another downward price reaction at that point.
-------------------------------------------------------------------------
Let me know your thoughts in the comments, and show your support by liking the idea.
Please follow if you're interested in more ideas like this.
Your support is greatly appreciated!

Possible Downturn in CADJPYThe CADJPY is still in an uptrend, although it has shown signs of weakening over the past three weeks. This is evident from the converging peaks and the inability to make new highs, as well as the appearance of divergences on momentum indicators. By examining the weekly chart, it is clear that there is a Doji candlestick, while the daily chart shows a bearish engulfing candlestick pattern, indicating strong selling pressure. Looking at the 4-hour timeframe, we can study the movement based on the general direction of the currency, and we can see that the price has formed a triangle pattern, which it is still responding to. We are waiting for the price to retest the upper edge of the triangle as a final attempt to climb before breaking the triangle and heading down towards 99.5.
-------------------------------------------------------------------------
Let me know your thoughts in the comments, and show your support by liking the idea.
Please follow if you're interested in more ideas like this.
Your support is greatly appreciated!

S&P 500 (SPX) - May 6th Week Ahead (Bullish Harami!)S&P 500 (SPX) - May 6th Week Ahead Bullish Forecast
This week, we've observed a bullish signal with a weekly harami candlestick pattern, indicating potential upward momentum. Here's the forecast for the week ahead:
Short-term Outlook (May 6th Week):
We anticipate the S&P 500 to continue its bullish momentum, aiming for new highs.
The weekly harami bullish close suggests a reversal of previous downward sentiment, setting the stage for upward movement.
Our short-term target is 5665 for the S&P 500.
VIX Analysis:
The VIX, currently around $12, may test lower levels this week, possibly dipping below $12.
However, we may see temporary bounces around the $12 mark, possibly occurring a few more times before sustained downward movement.
In the short term, expect fluctuations in the VIX, with potential tests around $12.
Intermediate to Long-term Outlook (Most Likely Q4):
Looking ahead to the intermediate to long term, particularly in Q4, we forecast further decline in VIX values.
We anticipate sub-$12 levels, possibly down to $11.50 or lower, with multiple daily closes supporting this trend.
Upon reaching these levels, we'll position ourselves for ultra-long UVIX/UVXY trades, employing laddered expirations ranging from one week to multiple weeks/months.
We'll maintain directly held positions in anticipation of increased volatility, capitalizing on the VIX's movement.
Summary:
Short-term bullish sentiment prevails, with a target of 5665 for the S&P 500.
VIX may test lower levels, potentially dipping below $12, with short-term fluctuations and possible bounces around this mark.
In the intermediate to long term, expect a decline in VIX values towards sub-$12 levels, where we'll position ourselves for ultra-long trades.

VIX Update: Staging a Rise to $19.50 - Potential Short-Term Top?Don't miss our latest analysis on the VIX! We're observing a rise towards $19.50, with a potential short-term top in sight. Stay updated with Candlestick Ninja on TradingView!

StorjUSD Update 4/13/24: Bearish Diamond Points to .35 Psych SupJoin us for an in-depth analysis of Alt Coin StorjUSD! Candlestick Ninja explores the technical indicators and potential price movements, providing traders with actionable insights. Stay ahead of the curve with our expert analysis!

No April Fools! Stay LAZR Focused on Luminar!Get the latest insights on Luminar Technologies (LAZR) from Candlestick Ninja! No April Fools' tricks, just a continuation of bullish momentum. Follow for more updates! #LAZR #Bullish #TechnicalAnalysis

One more Easter Egg for you on ticker MULN - Last chance inboundCheck out Candlestick Ninja's latest analysis on Mullen Automotive (MULN) for insights into short to intermediate-term projections, short interest, and off-exchange trading. Join the discussion and stay informed!
This is for informational and educational purposes only but expect falls towards $4.75-$5 psych and a possible bullish diamond formation as we consolidate before our rise towards $8 Psych, then $9 and eventually $11+


Short term is bearish to sideways then bullishWeek Ahead Glance on Corbus Pharmaceuticals (Ticker: CRBP) as of February 4th, 2024, by Candlestick Ninja! 🌟 Discover the latest insights into CRBP's recent explosive breakout to $40, forming a bullish head and shoulders pattern. We'll explore how it temporarily weakened under $27.50 and why a break of $27.50, eventually $29, could propel us to $35 swiftly.
I

Bull diamond to $3 underway Bull diamond to $3 underway … short term should hit 2.55 then 3$+ agree?

LONG - CADJPY - 1H Instrument:- CADJPY
Position:- Long
Timeframe:- 1 Hour
Method:- Dow Theory + Candlesticks
Reason:-
* Multiple bullish candlesticks (Candlestick analysis)
* Price in Uptrend with Multiple Higher highs and Higher Lows with no break in the uptrend (Dow theory)
Entry @ CMP (105.852)
Take Profit @ 107.995
Stop loss @ 104.926
Risk to Reward :- 2:1

Bitcoin pointing to a bear market rally towards 50k if..Bitcoin is pointing towards a bear market rally, a much needed rally if our current weekly candlestick eats away at the bearish wick before Sunday Feb 13th new weekly candle plots.
Stock markets have been on a roar until
Recently abs relatively stocks have not dropped a lot, with Ukrainian stuff lingering it could hurt stocks. But the news has now caused market participants to price in an all out invasion of
ARussiam
Into the Ukrainian, anything other than an invasion (if they back down, or linger and don’t invade or there’s peace somehow ) then the markets will revert up.
But regardless of what happens there I’m convinced Bitcoin and other cryptos are due and will get a bear market rally. Unlike stocks Cryptos have been dropping a lot more. I am a pure t cynical
Analyst abs going off the weekly chart we do have a head abs shoulders pattern, but we are at a bounce area with an “almost” morning star bullish candle formation
On the weekly confirmed at last Sundays weekly close. Our current weeks candle has a big bearish wick and if bulls push us up to 43,500-44,000+ before tomorrows weekly candle close on Bitcoin, I see us rising towards $50,000 within the next week or two.
I plotted two Fibonacci ratio plots from the relative recent high to low, the blue one is using the candle bodies and the green Fibonacci plotting uses the wicks or intraweek extreme levels.
If you follow Riot Arocl if this plays out, I see Riot at $22-$23 pps by next Friday and $27-$34 within the next month
If we close
Our week at <$41,000-$41,500 we can see sideways action for
A whole but I only place a 10-15% chance of this happening- I’m bullish until $52000-$57000 on Bitcoin.

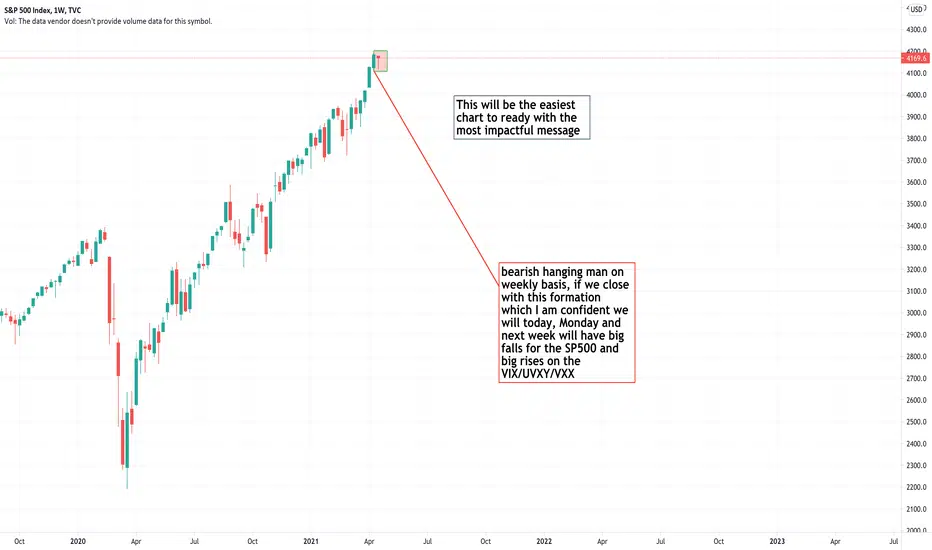
don't get 'hung up' at the top!don't get hung up at the top of this thing, it has already begun, the big descent! ref: sf.ezoiccdn.com
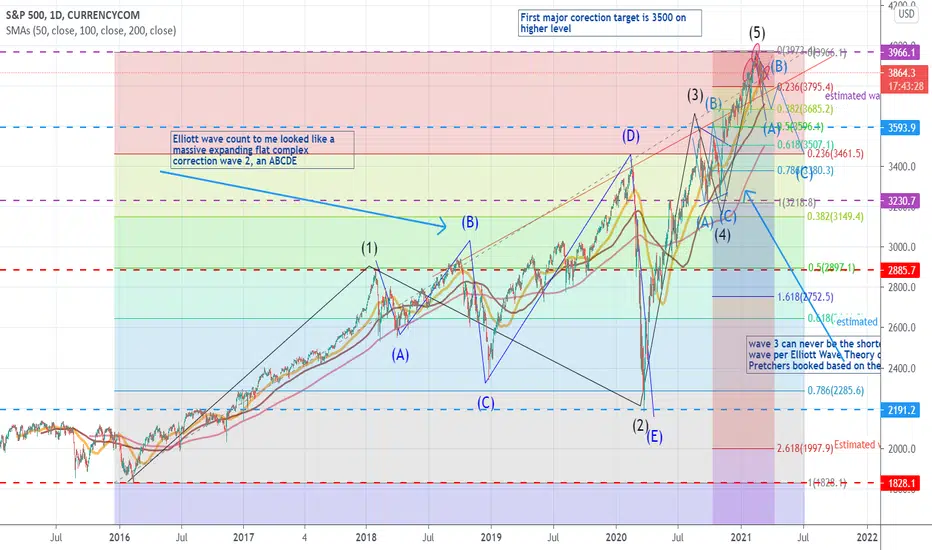
EWP Count Starting 2016, feedback welcome!Elliot Wave Principal and wave counts are really based off of the Fibonacci Sequence, you can arrive at similar conclusions with different counts as long as you follow the rules, this is my best count on the S&P500 With my ABC correction post wave 5 which I assume has ended around 3950. This is relatively a shallow correction and if it does play out over the next 2-4 months in a such a way it may very well turn into a complex correction that's deeper, but I'm starting with a more shallow correction and keeping it simple. I'm not great at elliot wave counts, my strong suite is in Fibonacci extensions and retracements and candlestick patterns :)
Big Commerce (BIGC) to retest $100BIGC is on a tear, but like all IPOs, it will find its ceiling, and it will come crashing down while people take profits. There are a couple major things going for it, it's rival Shopify (SHOP) is valued at $1088/share, which many missed out on the lows of $300 in March 2020. They believe BigCommerce will be the next Shoppify, as you can see from the IPO.
Employees of the company are barred to trade their shares in a 180 lockout agreement that was published in the companies S1 to the SEC. There will be no inside trades for the first 6 months.
The price rose ALL the way to $94, before people started realizing (I should probably take a quick profit right now) it was time to sell. The news generated so much of a shockwave, that it presented a Gap Up in the candlesticks, demonstrating a potential bullish move. The next candlestick was a neutral Doji in the bullish direction, where it was rejected just over $100, and again rejected a 2nd time over $100 at the same level. The day then closed out with 2 red candlesticks, the last one not making it past previous resistance turned support.
We should see a jump from this price, perhaps another Gap Trade and we will re-test highs, before seeing what happens next!

4 hour wave 5 termination confirmation of $1.88-$1.90 WFT Ultimate Intermediate Term Price Target of $1.88-$1.90 zone in line with fundamental analyst projections of $2 'true value'. Last chance to buy as bullish technical divergence and bullish candlestick formations combined with a confluence of many indicators are pointing to a pop to an above $1 soon! The termination at 1.88-1.90 is wave 5 from my 4 hour chart

Dollar/Yen Dollar Yen for the past 55-60 days has been in a bullish uptrend to a major resistance area. We watched price reach the key major resistance level for it to left unbroken and rejected. Now we are in a mid-term bearish trade,holding for the next 66 days till we reach major support area.
@candlestickcapitalgroup on instagram
t.me/candlestickcapitalgroup on telegram

Grand Super Cycle S&P 500 Analysis: Riding the Fifth of the FiftIn Elliott Wave Theory, we're navigating the vast ocean of market cycles, and currently, we find ourselves in uncharted waters: the fifth of the fifth of the Grand Super Cycle or Grand Millennium Wave. This level of analysis delves into macroeconomic cycles of epic proportions, spanning centuries, and it's raising questions, even some of a doomsday nature.
1. The Fifth of the Fifth: Unprecedented Territory
We're accustomed to analyzing cycles within cycles, but reaching the fifth of the fifth at the Grand Super Cycle level is unprecedented. This raises profound questions about the nature of market behavior, suggesting we're witnessing historical shifts in global economics.
2. Where Does the Fifth End?
The big question is where this fifth wave concludes. The sheer scale of this cycle prompts speculation about significant market events, perhaps even a structural shift in the global financial system.
3. "The Fifth Wave" Movie: Coincidence or Significance?
The release of the movie "The Fifth Wave" in 2016 adds an intriguing layer to this analysis. While it's speculative, it's fascinating to ponder if there's a connection between cultural expressions and market cycles. Are there subtle signals in popular media about broader economic shifts?
4. Significance of the Next Correction
To grasp the significance of our next correction, we need to understand the scale of the Grand Super Cycle. Consider that the Tech boom and bust, the 2008 real estate Great Recession, and even COVID-19 can be contained within smaller waves. For instance, the Tech boom and bust and 2008 recession could be viewed as an ABC correction in the wave 2 of the Grand Super Cycle, while COVID-19 might be seen as an expanded flat wave within the Millennium Super Cycle, itself a part of a larger wave three of a step up in the Grand Millennium Super Cycle.
Conclusion:
Analyzing the S&P 500 at the Grand Super Cycle level is like navigating through the cosmos of economic cycles. We're currently at a juncture never seen before, the fifth of the fifth, prompting profound questions about the future trajectory of global markets. While we can't predict with certainty where this wave will end, understanding its scale and significance can provide valuable insights into potential market movements and economic shifts on a grand scale.
(Note: This analysis is speculative and based on Elliott Wave Theory. Investors should conduct thorough research and consult with financial professionals before making any investment decisions.)

Bullish on MULN: Accelerating Automotive InnovationRecent Buy: $4.14 | .618 Retracement
Short Term Target (5/3/24): $5.50 | Intermediate Target (Week Ahead): $6.80+
Stop Loss Trigger: $3.80
Mullen Automotive (NASDAQ: MULN) is gearing up for a bullish run, and here's why I'm optimistic:
1. Electric Vehicle (EV) Sector Growth:
The electric vehicle industry is experiencing exponential growth, driven by increasing environmental concerns and technological advancements. Mullen Automotive, with its innovative EV designs, is well-positioned to capitalize on this trend.
2. Strategic Partnerships:
Mullen has been forging strategic partnerships to bolster its position in the EV market. Collaborations with established players in the automotive and technology sectors provide Mullen with access to resources and expertise necessary for success.
3. Product Development:
Mullen's focus on developing affordable EVs with cutting-edge features and performance sets it apart in the market. The company's commitment to innovation and sustainability is likely to attract a broad customer base.
4. Technical Analysis:
After a recent retracement to the .618 Fibonacci level, MULN appears primed for a rebound. The stock has shown resilience at this level, indicating strong support. The MACD and RSI indicators are also signaling a potential uptrend.
5. Catalysts:
Several catalysts could drive MULN's stock price higher:
Product Launches: Mullen is expected to announce new vehicle models and features, generating excitement among investors and consumers.
Earnings Report: Mullen's earnings report is scheduled for 5/17/24. Positive results could provide a significant boost to the stock price.
Buy/Sell Targets and Stop Loss:
Recent Buy: $4.14
Short Term Target (5/3/24): $5.50
Intermediate Target (Week Ahead): $6.80+
Stop Loss Trigger: $3.80
Earnings Strategy:
Considering earnings on 5/17/24, and your plan to hedge against potential sell-offs, you may want to consider the following:
Last Buy Decision: Base your last buy decision on the market situation closer to the earnings date. If there's a sell-off before earnings, use it as an opportunity to buy more, ensuring a hedged position.
Hedging Strategy: Depending on where the VIX (CBOE Volatility Index) stands, you could employ options strategies such as purchasing protective puts or selling covered calls to hedge against potential downside risk.
Managing Positions: If your position is not closed before earnings, closely monitor the market sentiment and your risk exposure. Adjust your hedging strategy accordingly to protect your investment.
Conclusion:
Mullen Automotive presents a compelling investment opportunity in the EV sector. With a robust product lineup, strategic partnerships, and upcoming earnings, MULN is poised for growth. By carefully managing your positions and employing hedging strategies, you can navigate market volatility and capitalize on MULN's potential.
(Note: Always conduct your own research and consider your risk tolerance before investing. Options trading involves risks and may not be suitable for all investors.)

VIX & UVXY Update: Short-Term Bearish Outlook Amidst Loose MoneyStay informed with CandlestickNinja's analysis on the VIX and UVXY! Despite recent spikes, a short-term bearish outlook prevails due to loose money actions. Follow us on TradingView for more insights. #VIX #UVXY #TechnicalAnalysis #MarketSentiment
